


 Arguments


Recent Comments
Prev 2015 2016 2017 2018 2019 2020 2021 2022 2023 2024 2025 2026 2027 2028 2029 2030 Next
Comments 101101 to 101150:
-
HumanityRules at 12:52 PM on 16 December 2010An Even Cloudier Outlook for Low Climate Sensitivity
100 e I agree with you Spencer is saying (some) temperature change is initiated by clouds not that ENSO is initiated by clouds. 102 dhogaza I read the email exchange, I don't see where he says or infers "ENSO are caused by clouds". Please reproduce the quote here so I can find it in the emails. 96 Stephen Baines Stephen you fail to mention deltaT here and it seems to be the relationship between clouds and deltaT that Spencer is arguing over not ENSO. I think when it comes to "initiators" and "feedback" it's the relationship to deltaT that Spencer is concerned about. Anybody want to move on from this and talk about phase space plots? -
HumanityRules at 12:23 PM on 16 December 2010An Even Cloudier Outlook for Low Climate Sensitivity
97 Albatross I'm not questioning the sincerity of Dessler, I'm not trying to look for angels and devils in the process. I think the reader at RC is lead down that particular path by the paragraphs following the "ENSO are caused by clouds" statement, I'm not suggesting that Dessler is consciously trying to lead us there but that is what is happening. It's difficult to know where to take this particular arguement when Spencer has explicitly stated on his blog that he does not support the idea that ENSO are caused by clouds. Albatross this is again getting away from the science, I should have ignored NewYorkJ and dhogaza's lead. There is actually lots of science in both authors papers that is being ignored by this narrow focus. Hopefully you'll ignore this post and focus on what I raised earlier. -
dhogaza at 12:11 PM on 16 December 2010An Even Cloudier Outlook for Low Climate Sensitivity
HR: "These are Spencer's words, not Dessler's interpretation of Spencer's words. " Uh, his e-mail messages are his words, too, and Dessler presents them verbatim so we can interpret them ourselves. It is clear that Spencer's claiming that scientists have the arrow backwards regarding clouds and ENSO. He says so directly. -
HumanityRules at 12:07 PM on 16 December 2010An Even Cloudier Outlook for Low Climate Sensitivity
88 Albatross and Riccardo It looks like in Spencer's Fig1 that he actually takes Dessler's approach to calculating radiative forcing. He uses different data sets but the methodology is the same. In that figure he seems to show that depending on exactly which data set you use (HADCRUT or satellite for temp) and how you handle the data (different averaging periods) you can get very big differences in the radiative forcing estimate (0-2.5 W m-2 K-1). I guess Dessler would counter that he shows robustness by using two data sets of his own and getting similar results. Any greater merit in either authors approach? Maybe this is not actually getting to the point of disagreement between Spencer and Dessler anyway. The curious thing is using Desslers method Spencer actually gets very similar results to Dessler only with much greater range (Spencer 0 - 2.5 and Dessler -0.2 - 1.3). The point both you (and Dessler) seem to want to emphasise could still be made with Spencer's result, that is using this method there is no evidence of large negative feedback. From what I can see though Spencer's issue isn't just about the robustness of the method but whether Dessler's method is valid at all. Even for Spencer that is not answered by the confidence in the stats but by using a different method, phase space plots. I guess what we should be focussing on is whether phase space plots are giving us the added information that shows that Dessler (and others) method for estimating feedback is invalid. -
An Even Cloudier Outlook for Low Climate Sensitivity
HR @94, It sounds to me like Spencer is just nitpicking semantics. Temperature change is one of the chief characteristics of ENSO, and Spencer is clearly arguing that this temperature change is initiated by clouds. That view is indeed outside of the mainstream. -
Rob Honeycutt at 11:27 AM on 16 December 2010An Even Cloudier Outlook for Low Climate Sensitivity
This is somewhat OT but related to climate sensitivity. Remember the news last week about the NASA study showing negative feedbacks from plants that bring climate sensitivity down to 1.64C? Potholer54 on youtube has done a great video debunking that myth. If you haven't heard of Potholer54 for before (aka journalist Peter Hadfield) definitely check out his other videos. He's the kind of quality journalist this world is severely lacking these days. -
muoncounter at 11:18 AM on 16 December 2010Human CO2 is a tiny % of CO2 emissions
#92: "more importantly nothing to indicate distance. The arrows in the figure suggest vary large distances " These are schematics of the flow of materials in a dynamic system. There is no distance scale involved. This type of figure is the standard, in use for decades; for example, see figure 10 in Post et al 1990. "would like to have people acknowledg or refute my assertion that the figure is bad science" An assertion that this is 'bad science' needs some substantiation. There are far more egregious example of bad science to be found on a routine basis in the denialist sources. -
Albatross at 11:11 AM on 16 December 2010An Even Cloudier Outlook for Low Climate Sensitivity
Stephen @96, Interesting perspective and insights. Of course another possibility is that Spencer let the "truth" slip in his exchange with Dessler (i.e., let slip his true feelings on the issue). -
Albatross at 11:05 AM on 16 December 2010An Even Cloudier Outlook for Low Climate Sensitivity
HR, I think that you might also be going off on a "flight of fancy" when you suggest "The power of that argument is to place Spencer so far outside the mainstream as to discredit everything he says". I would argue that Spencer's behavior and comments in recent years (many of which were made on his own blog) are in fact doing just that (i.e., discrediting him). Dessler strikes me as a sincere person who is not likely to engage in the tactics that you are accusing him of. Also, I do not see Dessler et al. holding a press conference the very minute a "skeptic" paper is officially released in order to try and sabotage it. It is Spencer who is playing games, not Dessler. The logic of the contentious statement that Spencer made in his email definitely suggests that for the 2007-2008 La Nina, changes in clouds preceded changes in temperature. Now in Spencer's defense, it was an email, which is a horrible medium for communicating sometimes. Maybe he was simply not clear or mis-spoke. What I do not understand is why Spencer has not spoken up to clarify his position since Dessler made his post at RC, or why he did not take the opportunity to discuss the matter further by email with Dessler. This whole ENSO fiasco is just a distraction though. Dessler's main points are that the cloud feedback in response to warming is very likely positive and that the models are doing a pretty good job in reproducing this short-term (positive) feedback. Anyone still trying to claim that climate sensitivity is low, is on incredibly thin ice-- some might even go so far as to say that they are already flailing in the water. -
Stephen Baines at 10:54 AM on 16 December 2010An Even Cloudier Outlook for Low Climate Sensitivity
The question HR is why does he clearly hold one view when talking to Dessler and another when blogging to the public. The point that Dessler is making in the emails is that if ENSO is initiated by ocean-atmosphere interactions, and if this leads to cloud formation that reinforce that change, then that is a feedback. It is the magnitude of that very feedback that Dessler is trying to measure. When confronted with that reasoning in the emails, Spencer argues that the clouds initiate ENSO by affecting surface temp so as to avoid admitting that clouds are acting as feedbacks. In the quote you provide above from his site, he seems to be talking about clouds as a feedback mechanism, which essentially means Dessler is correct in his approach. He seems to realize (and take advantage of)the fact that he is talking to an audience who is not aware of the important distinction between clouds as initiators and clouds as feedback mechanism, and therefore who won't realize that he is backing into a corner. -
HumanityRules at 10:52 AM on 16 December 2010An Even Cloudier Outlook for Low Climate Sensitivity
To put it simply I think Dessler thinks A) ENSO causes temperature change which causes cloud changes which cause further temperature changes. A classic feedback situation While Spencer is proposing some role for B) ENSO causes circulation changes which cause cloud changes which causes temperature changes. Unforced internal variability I'm not sure Spencer is proposing the first one does not exist just that what is showing up in the data set is a mixture of both. It's this that makes Desslers (and others) methodologies different from Spencer's. Anyway I'll post this on Spencer's blog to see what he has to say. -
HumanityRules at 10:39 AM on 16 December 2010An Even Cloudier Outlook for Low Climate Sensitivity
91 NewYorkJ 93 dhogaza You could also try this on Spencer's blog I'll even copy the relevent bit for you "To Dessler’s credit, he actually references our paper. But he then immediately discounts our interpretation of the satellite data. Why? Because, as he claims, (1) most of the climate variability during the satellite period of record (2000 to 2010) was due to El Nino and La Nina (which is largely true), and (2) no researcher has ever claimed that El Nino or La Nina are caused by clouds. This simple, blanket claim was then intended to negate all of the evidence we published. But this is not what we were claiming, nor is it a necessary condition for our interpretation to be correct. El Nino and La Nina represent a temporary change in the way the coupled atmospheric-ocean circulation system operates. And any change in the atmospheric circulation can cause a change in cloud cover, which can in turn cause a change in ocean temperatures. We even showed this behavior for the major La Nina cooling event of 2007-08 in our paper! It doesn’t mean that “clouds cause El Nino”, as Dessler suggests we are claiming, which would be too simplistic and misleading of a statement. Clouds are complicated beasts, and climate researchers ignore that complexity at their peril." These are Spencer's words, not Dessler's interpretation of Spencer's words. It can't be any clearer that he does not hold the view that Dessler assigns him. I understand what Spencer is saying here and I'm not a climate scientist. He's not arguing clouds cause ENSO, he's questioning the assumptions about the relationship between clouds and temperature. In Spencer's first email he says clouds proceed temperature, not clouds proceed ENSO. It's Dessler that seems to think that this means ENSO is caused by clouds. My reading of Spencer's work is to try to understand what he calls "internal radiative forcing" and other's call "unforced internal variability". This isn't just his theory, what's novel about Spencer's work seems to be in the understanding of how these processes affect the measurement of short term radiative forcing. While Spencer goes off on a flight of fancy about the timing of the publication, and should really hold his head in shame over that, I do think he has a point about Dessler's use of the "clouds cause ENSO" arguement. The power of that arguement is to place Spencer so far outside the mainstream as to discredit everything he says. It's no more worthy a tactic than Spencer's conspiracy theory and no better at discrediting the science. -
Tom Curtis at 10:01 AM on 16 December 2010Stratospheric Cooling and Tropospheric Warming
Ebel @243, the majority of emmissions near the 15 micron band comes from CO2 in the troposphere, from about an altitude of 8 - 10 km. If you use the Modtran model linked to several times in this thread, with a look down altitude of 10 km, you will see the main part of the emmission spectrum still present (as in fig 2 above). You will not see the spike at the center, of course, because it comes from the stratosphere and hence from above 10km. If you use Modtran, and a 10km look up altitude, you will see the spike, but not the main band. Clearly, though, the spike, being an increase of outgoing energy, must be an emmission rather than an absorption. -
Riccardo at 09:59 AM on 16 December 2010It's albedo
Rovinpiper not sure I understood your mate's question. If referred to Kirchoff law, it is valid at each wavelength and need not be integrated. Integration, instead, is performed when computing the radiative balance. -
Daniel Bailey at 08:46 AM on 16 December 2010It's the sun
Re: TheCaz (748) Short answer? In the paleo record, CO2 acted as a feedback to temperatures, with orbital factors being a primary driver of climate change (with the exception of methane burps [think PETM]). What is different today is the immense bolus, or carbon slug, of CO2 mankind has injected into the atmosphere. By doing so, we have changed the game: instead of CO2 acting as a feedback, it now acts as forcing, causing a cascade feedback reaction of warming that also drives more CO2 and CH4 release, causing further warming.
 The warming will continue until CO2/CH4 emissions stablize + about 40 years for the thermal lag of the oceans to catch up. Once radiative balance is then achieved, temps and resulting large and micro-scale climate patterns will stabilize.
 And that was the short answer.
The Yooper
And that was the short answer.
The Yooper
-
TheCaz at 08:12 AM on 16 December 2010It's the sun
The figure (and referenced data) show a de-coupling of solar output from Earth's surface temperatures, starting in the mid 1970s. The conclusion is that there must be another causative agent that overwhelms solar influences, starting around that time (greenhouse gases). But the data's weakness is that the prior correlation only goes back a few hundred years. If the data was traced back a few thousand years, then would it show any other periods of uncoupling? Or is the recent uncoupling unique in the holocene? -
Ebel at 07:40 AM on 16 December 2010Stratospheric Cooling and Tropospheric Warming
The radiation of the entire 15μm bands at 220K is from the stratosphere, which has over the entire thickness almost 220K (yellow line). The small spike in the middle is caused by a particularly strong absorption, so that the emission comes almost exclusively from the height of the ozone area. See also # 234th -
dhogaza at 07:36 AM on 16 December 2010An Even Cloudier Outlook for Low Climate Sensitivity
Yes, it's very clear. Over at RC Dessler made it clear that it was this e-mail exchange that convinced him that Spencer really *is* arguing that clouds are driving ENSO. He speaks specifically of satellite data showing causation in a recent La Niña, and that it's clouds=>temperature. -
Stephen Baines at 07:33 AM on 16 December 2010Human CO2 is a tiny % of CO2 emissions
hfranzen I spoke about the seasonal variation and terrestrial carbon storage because you were trying to understand seasonal variation in CO2 as a function of ocean CO2 uptake, which is the wrong path to take. The reason there are large positive and negative fluxes of CO2 into the ocean is because some regions are net sources and some regions are net sinks of CO2. Those arrows indicate the sum release for the net source areas (like the equatorial Pacific), and the sum of uptake in the net uptake areas (like the subantarctic regions north of the Southern Ocean). As you can tell these areas are large. The minimal scale is essentially set by the minimum cell or pixel size of dynamic models of ocean physics and satellite observations (usually >kms) -- the in and out numbers do not refer to both gross flux terms of the net flux at one point...that would be pointless for the reasons you point out. Scientists study the spatial variability in PCO2 flux because efflux and influx can be decoupled by things like ENSO (on the short term) and ventillation (on the long term). It allows you to explicitly address the ability of the ocean to store CO2 in the future under different climate/oceanographic conditions and different time scales of exposure to increased CO2. We are discussing some of this on the acidicfication page as pointed out my muoncounter above. I think it's good science. You also have to include those arrows because they are in every global C cycle produced over the last few decades. As a consequence, you can't ignore them because cynics will say your hiding something when you're not. Ackowledging those arrows and explaining why they don't negate the importance of athropogenic CO2 is important. As for the time and mass units they are years and Gt CO2 (not C). If you go back to the original IPCC figure you can figure that out. In fact, the IPCC report covers all of what I said above pretty well. I'd read it. -
Joe Blog at 07:28 AM on 16 December 2010The 2nd law of thermodynamics and the greenhouse effect
damorbel at 00:00 AM Ned has already said it, but i realize on reading what i wrote how it may be interpreted, the lapse rate, may be due to density/gravitational compression(which also effects path length), but the energy contained is due to energy in vrs path length out. As can be seen in the graphic in NEDs post. The stratosphere is an entirely different kettle o fish, it absorbs UV through O3, and is optically thick for UV, but is relatively transparent to LW, so CO2 cools it, But UV heats it from the top down, there is a thread on it here at the moment. In which there has been a bit o a discussion about the relevance of radiation to the lapse rate and convection. -
scaddenp at 07:16 AM on 16 December 2010The 2nd law of thermodynamics and the greenhouse effect
Also, for what happens to the upper level photons, the graphic at jg's (meant for explaining stratospheric cooling) is useful. And dont forget DLR is measured, something damorel struggles to explain. -
Eric (skeptic) at 07:04 AM on 16 December 2010It's albedo
Here's a link to that paper /news.php?n=481&p=2#34079 -
Eric (skeptic) at 06:57 AM on 16 December 2010It's albedo
#19, I recommend Climate modeling through radiative-convective models (Ramanathan 1978) equation 16 (absorption and scattering of solar radiation) which integrates over wave number, angle of incidence, etc. -
Ned at 06:57 AM on 16 December 2010It's albedo
Hi, Rovinpiper. Sorry to have missed your first question: What is "s" in your equation for energy emitted? It should be a "sigma" ... it's the Stefan-Bolzmann constant. Since it's constant, the equation tells us that emitted energy at a given wavelength is a function of just the object's temperature and its emissivity (fraction) at that wavelength. [...] he states that we must integrate over the whole spectrum. Must integrate over the whole spectrum to do what? What's he "skeptical" about? The spectral distribution of incoming solar radiation is very different than the spectral distribution of outgoing longwave radiation. The former is almost entirely at short wavelengths (probably > 99% of it is below 3 micrometers) , while the latter is almost entirely long wavelengths (definitely > 99% of it longer than 3 micrometers). The latter is why the Earth doesn't glow in visible light (lava flows and forest fires excepted...). So you don't really need to integrate across the entire spectrum (or integrate anything, really) to answer the questions you were talking about earlier in this thread. Changing the visible-wavelength albedo of an object will change how much it absorbs, without necessarily implying a corresponding change in the efficiency with which it emits longwave radiation. In that case, the object will warm up or cool down until it reaches a new equilibrium. Dunno if this helps at all. -
Stephen Baines at 06:33 AM on 16 December 2010An Even Cloudier Outlook for Low Climate Sensitivity
Yep...Spencer is definitely saying clouds are initiating ENSO in that exchange. The mechanistic sequence is not really explained though. Nature paper there if he can convince anyone... -
hfranzen at 06:23 AM on 16 December 2010Human CO2 is a tiny % of CO2 emissions
I think I understand the basic science quite well and am familiar with the details of the Keeloing curve. I am certain without knowing the details that I can visualize what is hapeening at the ocean-atmosphere interface. One of my current interests is to try to bridge the severe communication problem between scientists and nonscientists. I have at every opportunity made myself available to speak or write about the aspects of this probelm that I think I understand well. As part of this effort I turned to the Skeptical Scientist for guidance and the first thing I came upon was this thread and the figure (7.3) from the IPCC that seems to me to undercut the effort. In this figure a cycle involving 300+ GT of CO2 to and from the ocean is "given" - nothing to indicate the time span (although one could surmise a year) but more importantly nothing to indicate distance. The arrows in the figure suggest vary large distances but in what sense does one know (or feel qualified to suggest) that 300+ GT of CO2 move from point A to point B on the earth? My point is that the quoted 300+ GT of carbon (or CO2 - not even that is clear)are meaningless and these numbers only serve to confuse an already confused situation. If you are inclined to respond please know that I know how much CO2 humans are producing, how much of it is going into the atmosphere, how much CO2 (and bicarbonate and cardonate) are dissoled in the ocean, I understand heterogeous equilibria, and etc. I just want to know why figure 7.3 was the first response of many possible to the original query, and would like to have people acknowledg or refute my assertion that the figure is bad science and therefore bad communication. -
NewYorkJ at 06:19 AM on 16 December 2010An Even Cloudier Outlook for Low Climate Sensitivity
HR, This should be obvious in their exchange: http://geotest.tamu.edu/userfiles/216/emailExchange.pdf http://www.realclimate.org/index.php/archives/2010/12/feedback-on-cloud-feedback/ -
Stephen Baines at 06:07 AM on 16 December 2010Human CO2 is a tiny % of CO2 emissions
Here is link to an image of the CO2 flying carpet showing spatial and temporal variability combined. -
Rovinpiper at 06:03 AM on 16 December 2010It's albedo
I am facing that most intractable of global warming deniers, the old physicist. Faced with what we just discussed about Kirchoff's Law he states that we must integrate over the whole spectrum. How do you do that? -
Stephen Baines at 05:57 AM on 16 December 2010Ocean acidification isn't serious
Glad someone has the patience and time to post those images! "So anyone who says 'atmospheric CO2 increase is solely due to ocean outgassing' is all wet." On that we should be able to agree. Physical and chemical considerations as well the evidence from stable isotopes, physical measurements, times series of pH and pCO2 pattern/trends are in agreement and unequivocal. -
Stephen Baines at 05:46 AM on 16 December 2010Human CO2 is a tiny % of CO2 emissions
Hfranzen "but in what way is a dynamic exchange of CO2 a cycle?" As noted, there is a lot more spatial variability implicit in that image than can be presented effectively. Also a cycle as used in earth science also implies transitions between different states (inorganic/organic, aqueous/gaseous) that can occur in a single space. That's just the usage. -
muoncounter at 05:35 AM on 16 December 2010Human CO2 is a tiny % of CO2 emissions
#87: "in what way is a dynamic exchange of CO2 a cycle?" To use a familiar illustration, here is a 'dynamic exchange' of CO2 in/out of the biosphere. The result is a regular 6-7 ppm peak to trough cycle each year. It is superimposed on the long-term increase of ~2ppm per year due to anthropogenic CO2. The annual peak is in April, at the start of the growing season in the northern hemisphere; the annual trough is in September-October, aka 'fall'.
-
Stephen Baines at 05:27 AM on 16 December 2010Human CO2 is a tiny % of CO2 emissions
Hfranzen Most of that annual cycle has to do with seasonal cycles in carbon stored in terrestrial organic matter as biomass that builds up in spring and is later decomposed. For this reaons the annual cycle gets progressively less obvious as one moves from northern latitudes (with large proportion of surface area as land mass), to southern latitudes (where most of the surface area is covered by ocean). Biomass can accumulate on land because plants are more complex and there is a lag between formation and decomposition of organic matter (those processes also show lagged seasonal cycles). Plants in the ocean are largely single cells and get quickly eaten or decomposed. So even though there is almost as much photosynthesis in the ocean as on land, it is impossible to store much carbon in biomass in the ocean. Therefore, net CO2 flux into the ocean on the short time scale tends to be driven by abiotic factors (pCO2 in water and air, water temp, wind, currents, upwelling/downwelling). As for how these numbers are measured, I think that is covered in the IPCC AR4. In both terrestrial and oceanic systems there are areas than act as sinks and sources. We know the ocean is a net sink because it is acidifying as CO2 invades (in fact, becasue of that you can say that we actually know the net flux there better than the gross fluxes back and forth!) We also have calculated maps of CO2 flux based on physical/ biological controls that are consistent with a net influx under current conditions. Those are pretty good, but are improving all the time. Land use and biomass inventories suggest that overall the land is a net source due to deforestation - but regional reforestation has meant that some areas have been CO2 sinks over the last century. Uncertainty on the inventories is large but getting better - an active area of research. There are also biophysical models of primary production and decomposition that are driven by satellite data and physiological constraints. These are groundtruthed against long term plots used in the inventory studies. One can cross check both land and oceanic net flux estimates against changes in pCO2 as air masses pass over water bodies and land as constrained by known physical constrains on exchange. That can be done on the small scale (eddy diffusivity measurements in forest or grassland plots) or the very large scale (over Amazonia or the Southern Ocean) using so called inversion techniques which infer exchange rates -- essentially a complex regression whose fit is constrained by physical considerations. So basically on the budget side the focus has been on measuring net exchange in many ways rather than following individual molecules or plumes of CO2 (although that is interesting in and of itself). You can infer how far a typical molecule of CO2 travels in the atmosphere, but that turns out to be a consequence of the measurements and does not affect them. Hope that helps... -
muoncounter at 05:19 AM on 16 December 2010Ocean acidification isn't serious
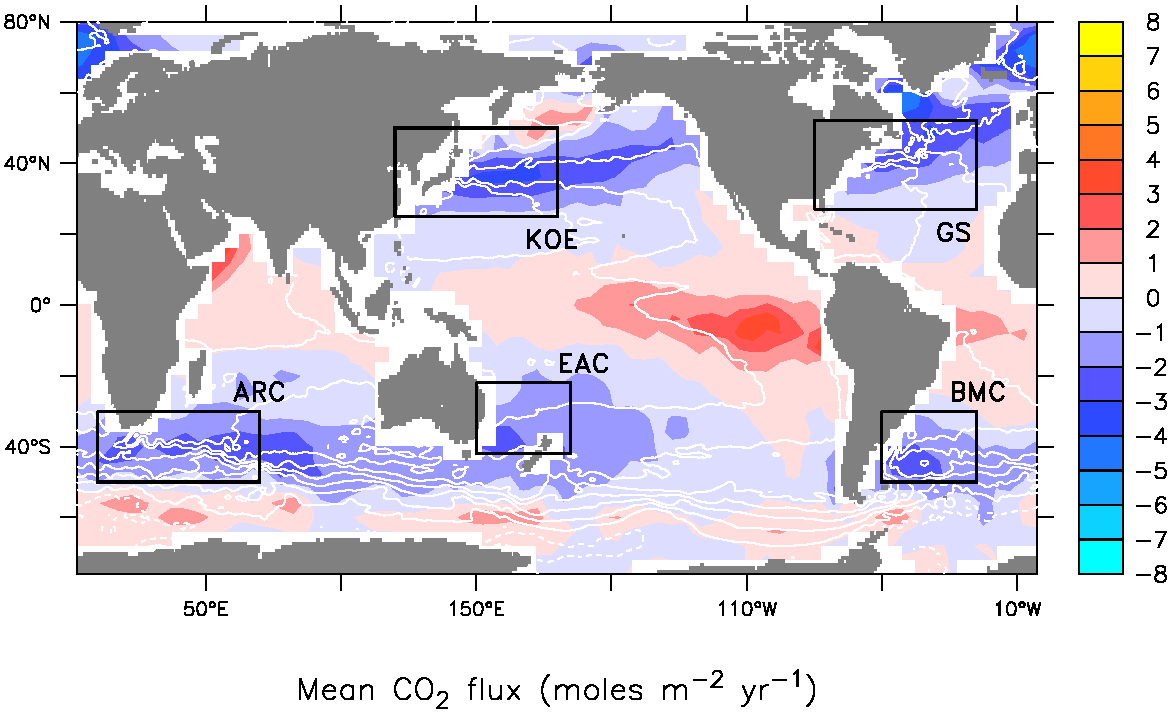
Lovenduski's Fig 4 captures in time series format the changes going on south of 35S latitude. For 'natural flux', the trend turned from - (sink) to + (source) in the mid 80s; a warming sign? But when she adds in 'anthropogenic' to create the 'net flux', the long term trend is driven downwards towards a stronger sink. Hence this patch of southern ocean is, on balance, soaking up CO2 and acidifying. But the picture changes in other parts of the world: --from Lamont Doherty
 --from NOAA PMEL
So anyone who says 'atmospheric CO2 increase is solely due to ocean outgassing' is all wet.
--from NOAA PMEL
So anyone who says 'atmospheric CO2 increase is solely due to ocean outgassing' is all wet.
-
hfranzen at 05:18 AM on 16 December 2010Human CO2 is a tiny % of CO2 emissions
Many thanks,I am fully aware of the point of your second paragraph -I have developed a power point discusing the CO2 atmospheric balance and detailiong the physical chemistry of its effect upon the earth. Does anyone want a copy? As regards your first paragraph, that may be the way they are thinking, but in what way is a dynamic exchange of CO2 a cycle? If I take a bottle of soda water in and out of the refrigerator and think about doing it a rediculously huge number of times am I then justied in calling what I envision a carbon cycle and putting 300+ GT arrows in my drawing of the soda bottle? I.e. a dynamic exchange of that charater may justifiably be considered a microcycle but it has no relavance to the type of macrocycle one thinks of when one considers, for example, the water cycle during which water is moved thousands of kilomters in periods of weeks. My major point is that a cycle means movement and to discuss movement in terms of quantity alone is, in this case for sure, meaningless. What is needed is quantity a distance and a time and the figure gives only a quantity. It is very poor communication at best and very poor science at worst. -
Stephen Baines at 04:22 AM on 16 December 2010Ocean acidification isn't serious
As for whether clouds are trickier than oceanic CO2 exchange, you'd have to say the Luvenduski paper does an outstanding job of reproducing the mesocale SST variability across the Southern Ocean (fig 2). I have pretty good confidence in their prediction of the underlying physical variables that largely constrain CO2 flux. Clouds are WAY more difficult, I think. -
Stephen Baines at 04:08 AM on 16 December 2010Ocean acidification isn't serious
Muoncounter - "How is it possible for oceans to simultaneously absorb and emit CO2?" Actually a simple source of confusion may be the separation of natural and anthropogenic CO2 that is made the Luvenduski paper. It helps to know that net flux of CO2 into the ocean really reflects the balance between CO2 influx and outflux, just like temperature of the ocean reflects a net energy balance. So there can be a net flux of anthropogenic CO2 in (as all of it is in the atmosphere), but a net total flux of CO2 out due to local imbalances between pCO2 in water and air. It can be hard to parse that out in words without being confusing, as that text you quote makes quite clea! But fig 3 does a good job. The complex pattern of "natural" CO2 influx and outflux (Fig 3b)reflects upwelling of CO2 rich water, temp changes, downwelling (well constrained) as well as sea surface exhange and phytoplankton growth/sinking (both less well constrained) on the CO2 balance. The contemporary pattern differs in that influx of CO2 has increased regionwide due to anthorpogenic CO2. The spatial pattern of that increase is shown in Fig3c. That's the shift toward sink state I mentioned. One big unknown in all of this is if the biological pump in this region may respond to changing CO2 in this region. People are working on various aspects of that as we speak. -
Michael T. at 04:03 AM on 16 December 2010A new resource - high rez climate graphics
This NOAA graph of CO2 and global temperature should be used more often when communicating to the public. Moderator Response: [Daniel Bailey] Link here: http://www1.ncdc.noaa.gov/pub/data/cmb/images/indicators/global-temp-and-co2-1880-2009.gif
 -
muoncounter at 03:00 AM on 16 December 2010Human CO2 is a tiny % of CO2 emissions
#82: "how do I reconcile several hundred GT changes in the atmosphere with the ca. 5 GT annual change of the Keeling curve?" I may be oversimplifying it a bit, but I visualize the '~330 Gt up/down' as being an equilibrium cycle. Even if we released zero anthropogenic CO2, that cycle would still be there. Add in the CO2 we release from fossil fuel consumption -- on the order of 30 Gtons annually in recent years -- and you get the annual change in average atmospheric CO2 concentration (+1.5-2.5 ppm by volume). It is not difficult to work out how this excess mass of CO2 in Gtons converts to +2ppm by volume in the atmosphere, as long as approximately 50% of this mass is taken from the atmosphere by land/ocean sinks. You can actually trace the increasing rate of atmospheric CO2 concentration from increasing annual CO2 emissions; data are available here. -
muoncounter at 02:41 AM on 16 December 2010Human CO2 is a tiny % of CO2 emissions
#83: "the sign of this flux is spatially and temporally heterogeneous." Is it ever. We're trying to decipher some of this at Ocean acidification. -
indulis at 02:14 AM on 16 December 2010A new resource - high rez climate graphics
Or (thanks to Wolframalpha.com) ~~ 5.6 × 2003 estimated energy in world's total fossil fuel reserves (~~ 3.9×10^22 J ) -
indulis at 02:10 AM on 16 December 2010A new resource - high rez climate graphics
I think it'd be good to put chart 2 into units people understand for more visceral impact. A couple of options. Based on my calculations, the energy gain of the earth has been the equivalent of detonating 52 Million x 1 Megaton atomic bombs. That is 100 x 1 Megaton atomic bombs every hour, for the last 60 years. Another way of looking at it is that over 60 years, the planet has been warmed by the energy equivalent of 62x of the output all of the world's power plants (2010 power plants), operating for 60 years. DOE says total worldwide electricity generation in 2010 was 16,385 Billion Kwh. My calculations: 1 joule 0.0002778 watt hours 1.00E+21 joules 2.78E+17 watt hours 2.20E+23 Joules total earth energy gain 6.11E+16 KWh 60 years 525600 hours 1892160000 seconds 1.16E+11 kW net gain (assuming linear over 60 years) 1.6358E+13 Annual electrical energy production Kwh (per DOE) 1,867,351,598 Electrical power generation worldwide KW (average) 62.27 Energy gain of planet vs current electricity production 1 Megaton atomic bomb 4.184E+15 Joules 5.26E+07 Atomic bombs energy equivalent 1.00E+02 Atomic bombs every hour over 60 years -
Paul D at 01:49 AM on 16 December 2010A new resource - high rez climate graphics
I think Inkscape might convert pdf to SVG?? It's a free open source drawing package. -
hfranzen at 01:43 AM on 16 December 2010Human CO2 is a tiny % of CO2 emissions
Thanks for the answer (and rest assured I am definitly on the side of the IPCC. But,how far does the CO2 have to travel from source to sink to be inclded? Clearly CO2 is entering and leaving the ocean everywhere at all times, but to get a number to put on the quantity one has to define the transport as being between two points. How does one decide upon the two points? It seems to me that that decsision would be totally arbitrary i.e. one could get any number up to some meaningless maximum for which the CO2 travels only a millimeter or a micron. What am I missing here? -
indulis at 01:14 AM on 16 December 2010It hasn't warmed since 1998
A really nice temp chart is here at NASA Earth Observatory
-
The 2nd law of thermodynamics and the greenhouse effect
damorbel - By George, I think you've got it! Even if you don't recognize it. The surface of the Earth (e) radiates greenhouse gas IR bands proportionally to T(e)^4. If there were no greenhouse gases, that would go straight to space (s), which has a temperature of ~3K. Instead, we have an atmosphere (a) with greenhouse gases, which emits IR at those wavelengths proportionally to T(a)^4. Summing radiative energy transfer in those bands (as per your post): - No GHG's -> (T(e)^4 - T(s)^4), T(s) = 3K - GHG's -> (T(e)^4 - T(a)^4), T(a) = 287K Note that 287K >> 3K, and that in the GHG case much less energy leaves the surface of the Earth in those bands - lowering emissivity. The effective emissivity (proportion of energy emitted versus a black body) of the Earth has dropped, and to radiate the same incoming solar energy with a lower emissivity the temperature will go up. -
Ned at 00:54 AM on 16 December 2010The 2nd law of thermodynamics and the greenhouse effect
There is no logical connection between this paragraph: This would be fine if the temperature in the troposphere was a function of the radiation but it isn't. DT/dz in the troposphere is about the same over the poles as it is over the equator, this temperature gradient is called the lapse rate and it has nothing to do with radiation. and the preceding paragraph, to which it is presumably intended as a response. Nobody said that the lapse rate is determined by radiation. That is a complete red herring (something that should be no surprise to readers of this thread, or the preceding one). Raising altitude of emission (due to GHGs), and keeping the lapse rate constant (not due to GHGs), implies warming of the surface. If you're unwilling to listen to people here, and you're unwilling to read Science of Doom, and you're unwilling to look at a textbook or talk to an expert, there's probably nothing I can do that would help. But for others who might be interested, there's a very good explanation of the underlying physics of the greenhouse effect over at Chris Colose's blog. Here's a simple graphic from Chris's post, explaining how raising the height of emission while keeping the lapse rate constant (the slope of the diagonal line in this figure) implies a warming of the surface: The Y axis is altitude, the X axis is temperature. Since the temperature at the new height of emission has to increase, the constant lapse rate means that all temperatures at lower altitudes must increase, too.
Here's Chris's summary:
The Y axis is altitude, the X axis is temperature. Since the temperature at the new height of emission has to increase, the constant lapse rate means that all temperatures at lower altitudes must increase, too.
Here's Chris's summary:
So…review: Because of energy balance, the planet must get rid to space as much energy as it receives from the sun. Averaged over the Earth, taking into account the albedo and geometry, this is about 240 W m-2. In the absence of an atmosphere, this flux of radiation is lost by the surface by \sigma T^{4}_{s}. With an atmosphere, this flux of radiation is allowed to emanate from upper, colder layers of the atmosphere, say on average at some altitude H. Increasing greenhouse gases increases the altitude of H, a height in the atmosphere which depends on wavelength, and characterizes a level of mean emission to space. Because the atmosphere is now emitting from colder levels of the atmosphere, the OLR has decreased, and the result is that the planet must warm to re-establish radiative equilibrium.
I have no expectation that damorbel will learn anything from this, but others might find Chris's discussion useful. I highly recommend his blog, though he only posts very sporadically. -
Ned at 00:14 AM on 16 December 2010Human CO2 is a tiny % of CO2 emissions
hfranzen writes: Furthermore if the time is for one year, how do I reconcile several hundred GT changes in the atmosphere with the ca. 5 GT annual change of the Keeling curve? Re: the ocean/atmosphere CO2 exchange, the sign of this flux is spatially and temporally heterogeneous. In one area and one season, the ocean will be a CO2 sink, while at some other place and time it will be a source. Integrating over the globe and the seasons gives a total upward flux of 332 Gt, and a downward flux of 338 Gt. This doesn't show up as a huge swing in the Keeling curve because the two processes are occurring simultaneously and thus mostly but not entirely cancel each other out. At least that's my understanding. -
damorbel at 00:00 AM on 16 December 2010The 2nd law of thermodynamics and the greenhouse effect
Re #239 you wrote:- "its the altitude at which energy can effectively escape however, that is responsible for the T gradient, which is necessary for the transport of energy to this altitude... " How can this be when the temperature rises steadily in the stratosphere? So the lower atmosphere is already largely opaque to some wavelengths, but the path length shortens with altitude, so by adding more opaque molecules, it raises the height that radiation can effectively escape, so its necessary for this new altitude, to heat enough that it is emitting the incoming, and next layer down must heat enough that it is able to transport this energy up to this height, etc etc.. This would be fine if the temperature in the troposphere was a function of the radiation but it isn't. DT/dz in the troposphere is about the same over the poles as it is over the equator, this temperature gradient is called the lapse rate and it has nothing to do with radiation. -
damorbel at 23:48 PM on 15 December 2010The 2nd law of thermodynamics and the greenhouse effect
Re #245 SteveS you wrote:- "I've seen this statement a number of times and it makes no sense to me. If the GHGs absorb the downward radiation, they would still have to re-emit some of it again, some of which would again be downward. Only if there were a layer of GHGs next to the surface that somehow magically didn't re-emit any radiation downward could this mean that none of the downward radiation reached the surface." The layer just above the surface has about the same temperature as the surface so, with a very small temperture difference there is almost no radiative energy transport. By far the greatest transporter of energy from the surface to the atmosphere is the evaporation/condensation cycle of water (rainfall!) Don't forget that radiative transport is proportional to (T1^4 - T2^4) where T1 is the surface temperature and T2 is the destination temperature; whereas evaporative transport works for the order of a few degrees. BTW, when calculating radiative transport, where is the destination, so that its temperature can be known - the troposphere is very thick and has a very variable temperature?
Prev 2015 2016 2017 2018 2019 2020 2021 2022 2023 2024 2025 2026 2027 2028 2029 2030 Next


