


 Arguments


Recent Comments
Prev 2024 2025 2026 2027 2028 2029 2030 2031 2032 2033 2034 2035 2036 2037 2038 2039 Next
Comments 101551 to 101600:
-
NQuestofApollo at 18:16 PM on 10 December 2010There is no consensus
" "Do you think human activity is a significant contributing factor in changing mean global temperatures?" (Doran 2009). … 97.5% of climatologists who actively publish research on climate change responded yes." That is exactly 75 people. "There are three kinds of lies: lies, damned lies, and statistics" -
rockytom at 17:54 PM on 10 December 2010The Scientific Guide to Global Warming Skepticism
Great job on the "Guide." I hope you can do an expanded version and get it in bookstores so the general public will have access and you can generate some income. -
muoncounter at 16:24 PM on 10 December 2010We're heading into an ice age
#174: "I didn't miss anything," Right. Your 'favorite headline' cherrypick stated this glacier was advancing; you tried to make something of the legitimate statement made by a knowledgeable scientist that he couldn't explain everything. As if that's some kind of weakness in the whole picture. And you missed the whole bit about the glacier being in equilibrium -- or else you wouldn't have used that poor an example to illustrate your 'point'. Here's a glaciar nearby that's not in equilibrium: Upsala Glacier, Argentina, 1928 Same spot, 2004:
 This is not how an ice age is supposed to look. Any questions?
Moderator Response: {Daniel Bailey} Topical of you to bring this glacier up. Check this out:
This is not how an ice age is supposed to look. Any questions?
Moderator Response: {Daniel Bailey} Topical of you to bring this glacier up. Check this out: -
NQuestofApollo at 15:58 PM on 10 December 2010We're heading into an ice age
CBDunkerson (171) - would you be kind enough to send me a couple of links to examples, pre 2005, were the IPCC or friends specifically stated that they expected the sea ice extent to increase, glaciers to increase or record cold temperature to occur post 2005. Not some vague statement that could be interpreted any which way - but, an explicit statement along the lines of: regardless of the current warming trend, we fully expect glaciers to occasionally expand and record cold temperatures to occur. muoncounter (172) - I didn't miss anything, I was pointing out that the AGW team - up until recently, promoted the expectation that the ice sheets and glaciers would continue to recede; as evidenced by the statement: 'We're not sure why this happens'.. On the question of "are we heading into a new ice age?" - that only matters if one presupposes that human activity in some way affects the temperature of the Earth. You, obviously, presuppose that we do. archiesteel (173) - I'm not the one expecting that warming should be linear.Moderator Response: Well, you could start with this post: It’s freaking cold! -
Daniel Bailey at 15:52 PM on 10 December 2010Arctic icemelt is a natural cycle
Re: NQuestofApollo (17) Perhaps if you had read Dr. Rivera's extended comments in the longer version of the article here:"One hypothesis for the 3-mile-wide (5 kilometer-wide) Perito Moreno's advance is the glacier's apparent insensitivity to changes in what glaciologists call the equilibrium line on glaciers, Rivera said. Roughly equivalent to the snow line, the equilibrium line is the elevation above which the glacier is growing, due to snow accumulation, and below which the glacier is melting. When this line moves higher up a hill or a mountain due to rising temperatures, for example, more of the glacier is situated in the melting zone, and the glacier retreats. But because Argentina's Perito Moreno glacier is so steep in the area where the equilibrium line falls, climate shifts don't impact the line's movement much, at least as it relates to the height of the mountain, Rivera noted. As a result, the amount of of ice lost or gained is minimal. It could also be that Perito Moreno simply hasn't got all that much to lose. The lake where Perito Moreno ends—Lago Argentino—is shallower than the bodies of water at the ends of most glaciers. Most glaciers calve, or release ice, in deep water, but not Perito Moreno, where the calving rates are higher than on other Patagonian glaciers. That means less of the glacier is in the melting zone below the equilibrium line. As heavy snowfall above the equilibrium line pushes the glacier downhill, the glacier breaks up when it hits the lake, Rivera explained. Such impacts kept the glacier from growing longer when the climate was cooler, and thus more likely to expand, he said. If Perito Moreno had extended into a deep lake area, it would have become a longer glacier, and Earth's recent warming trend would be causing the glacier to melt and its ice to retreat more easily, Richard Alley, a glaciologist at Pennsylvania State University in University Park, said in an email. "Instead, we have a shorter glacier, with less [of a] zone where the warming can cause melting, but a large high-elevation [snow and ice] accumulation zone," Alley added."
Forming an opinion based on an incomplete news article on one glacier that happens to be advancing at a time when glaciers worldwide are in retreat is cherry-picking. No one said glacial retreat would be linear and uniform. Perito Moreno, for the reasons surmised, is one of the exceptions to the overall trend. Noise in the data. For more on glacial changes, go to Mauri Pelto's blog. The Yooper -
muoncounter at 15:52 PM on 10 December 2010The human fingerprint in the seasons
Here's an alternative to the alternative theory: Shown below is a graph of UAH NH data through 11/2010, with 3 month averages for winter (DJF) and summer (JJA). The linear trend for winter (blue) is 0.23 deg/decade vs. 0.14 deg/decade for summer (red). Not to belabor the obvious, but "if greenhouse gases are causing global warming, we expect to see winters warming faster than summer". Yep, 64% faster.
-
Henry justice at 15:45 PM on 10 December 2010How do we know CO2 is causing warming?
The real way to run a CO2 warming experiment is to use just one bottle or jug, have a little water in it, use air for the first run of temps and then pump in the CO2 to 760 ppm, then run a 2d set of temps, in both instances using the same probe and warming lamp. Hmmm! I think I will try it myself. -
archiesteel at 15:28 PM on 10 December 2010Arctic icemelt is a natural cycle
@Argus: no one said CO2 was the only forcing. To claim otherwise would be a type of strawman fallacy. The point you're apparently missing is that, no, the climate change we are currently experiencing is not like what has happened before. We have a pretty good idea of why climate changed in the past, and none of the various circumstances that provoked past change is at play today What *is* different, of course, is that this time we're pouring gigatons of CO2 in the atmosphere, and that CO2 is causing temperatures to rise. Just to make things clear, though: are you in fact disagree with NQoA? Because the latter seems to think there is no warming, while you claim the warming is natural. Aren't going to argue with NQoA as well? After all, he's also disagreeing with you. I'd love to see some "skeptics" break the unspoken rule once in a while, but I don't think this is going to happen here... -
Composer99 at 15:27 PM on 10 December 2010Arctic icemelt is a natural cycle
NQuest @17: Perhaps without realizing that the discussion was to be moved to this thread, muoncounter provided you an explanation on the 'ice age' thread. Please note that he cites directly from the link you provided. The article's own tone seems to be in opposition to the use to which you wish to put it, a behaviour which seems lamentably common among contrarians who visit this site. The article suggests that this glacier is certainly anomalous, but since the rest of the world's ice (as documented in this very post or handily summarized with this search of SkS) continues to decline, I hardly see how it can present a major challenge to the science supporting AGW. Certainly I would conjecture that one factor in the Perito Monero glacier's stability would be an increase in precipitation (specifically, snowfall at the glacier's source), which follows from an increase in atmospheric water vapour, which follows from (wait for it...) warming temperatures. Sooner or later, though, if temperatures continue to rise, Perito Monero will follow its fellow glaciers into decline. At any rate, it seems to me that bringing up Argentine glaciers is a complete non sequitur - perhaps even a red herring - when it comes to discussions specifically focused on Arctic sea ice decline. -
archiesteel at 15:24 PM on 10 December 2010Arctic icemelt is a natural cycle
@NQoA: because they're not certain about the particular characteristics of that glacier that make it resist the global trend towards glacier retreat. Again, no one said all glaciers would recede at the same time, or at the same rate. Given the number of glaciers on the world, some are bound to react differently. The fact remains, however, that an overwhelming majority of glaciers are retreating. -
NQuestofApollo at 15:00 PM on 10 December 2010Arctic icemelt is a natural cycle
e (16) - Could you please explain to me why is it that the glacialist, when discussing the expansion of the glacier made the statement, "We're not sure why this happens". -
Phila at 14:42 PM on 10 December 2010A Cloudy Outlook for Low Climate Sensitivity
Camburn: As far as staticistical temps.....2010 is not over. I still stand by my statement. Also, 93% does NOT cut it. 2010 will be over in about three weeks. Perhaps you'll concede the point then? I'm sure there are other people here who will remind you, if I forget. -
actually thoughtful at 14:23 PM on 10 December 2010Renewable Baseload Energy
Source for PEW data above: http://www.pewclimate.org/technology/overview/buildings -
actually thoughtful at 14:21 PM on 10 December 2010Renewable Baseload Energy
Quokka - I run a company that specializes in renewable based heating systems. So the we is me. Design temperature is -2F (-19C). Design temperature means the coldest temperature you reliably get every winter. I will publish my results in the next 6 months (in a trade journal - there is no new science here, just intelligently using current technology, with a few of my own innovations). According to the PEW Center - 51% of a buildings energy usage comes from HVAC and water heating. I found multiple sources for buildings using 39% of total US energy use was for buildings. So by cutting 1/2 of 40% by 75% we have as our total pie 15% of total US energy usage! So, following the basic rule of ethics - is it generalizable? Yes! If all buildings followed our recipe, we could cut emissions by 15% - that is basically the entire Obama commitment to climate change (obviously to weak). Now some caveats - our work reduces natural gas, electricity (for water heaters - site specific) and propane - natural gas is called the "cleanest" of fossil fuels, and propane is slightly worse, but not as bad as electricity. Not all buildings are ideal candidates for solar thermal (but there is always geothermal - more than one way to get to zero energy). However, reducing electrical loads is at least as easy. Obviously reducing the need for heating/cooling and electrical use is the easiest path to reducing building loads. But we can retrofit a building with solar space heating at a similar-if-not cheaper cost than replacing all the glass and upgrading all the insulation (both, with a smaller system from us is most preferred). And these improvements pay for themselves over time. A building's mortgage is fixed (does not go up with inflation) but fuel prices are variable (and in fact, for the last 43 years (as far back as the data goes) have increased at roughly double the average inflation rate (fuel rate of inflation is 6.5% per year). I am 100% against greenwash - and this is, indeed planetary scale. As in think globally, act locally. One greenwash myth is that we need utilities and governments to do this *for* us. Not true. Each of us can and should take action (as should utilities and governments). Our lives are improved by this act. There is a HUGE satisfaction to taking control of your own energy destiny in your own home or place of work. Try it before you talk it down. -
Camburn at 13:47 PM on 10 December 2010A Cloudy Outlook for Low Climate Sensitivity
Daniel@ 120: I posted the url so that people could read the paper. The url you posted takes you to the publisher, and is not readable unless you are a member. The paper deals with observed cloud feedback verses modeled cloud feedback. Rather than inflect my opinion, I present the literature for each to interpret. As far as 119: We shall see. -
Daniel Bailey at 13:31 PM on 10 December 2010A Cloudy Outlook for Low Climate Sensitivity
Re: Camburn (118) Generally it is both good form to provide some insights (if you have any) into what readers of a linked source can expect to find therein and to provide a link to the published version of the paper, not a submitted version. The Zhang paper is fairly long in the tooth (submitted in 2007, accepted in 2008, published in 2009) for a cloud paper. Compare and contrast it to this recent paper by Dessler et al (to which Albatross has already linked to previously in 114 and to which dana1981 has then referred to above at 117) which find a net positive contribution from clouds. (119) Enough data has come in on 2010 to make even the portion available for 1995-2010 (inclusive) statistically significant. So you are wrong on that. The Yooper -
Tom Curtis at 13:23 PM on 10 December 2010Stratospheric Cooling and Tropospheric Warming
Joe Blog @196, having now understood what you are saying, I will not procede to criticize it. First, although the mechanism you describe sounds plausible, you fail to account for the characteristic rates characteristic rates of convection and radiant transfer. Specifically, while it only takes a few hours to restore thermodynamic equilibrium in the atmosphere by conduction, it can take as much as 50 days to do the same by radiation. This difference of rates is the primary reason why convection dominates radiation as a means of energy transfer in the atmosphere, and is still relevant at the tropopause. Given the example in 195 of a warm air parcel rising to 8km altitude, this means it would reach an equilibrium temperature by radiation over the period of about a month, or more. But it would still be able to reach an equilibrium temperature with the surrounding air in a few hours by convection, ie, by continuing to rise. Consequently, on these grounds, we would expect convection still to dominate as a heat transfer mechanism within the atmosphere. Second, radiant transfer is related to the fourth power of temperature, while heat conductive heat transfer is related to the difference between the temperature of the heated or cooled air parcel (Tap) and the temperature of the ambient air (Te) by the relation such that, a = g(Tap-Te)/Te , where a is the acceleration on the air parcel, g is the gravitational acceleration, and a is the acceleration of the air parcel. Therefore, given a 1% rise in temperature, we would expect heat transfer by convection to increase by about 1%. Heat transfer by radiation, in contrast, should increas by about 4%. Because radiant transfer becomes more effective with rising temperature, if radiant tranfer dominated, we would expect a rise in temperature to decrease the altitude at which radiant tranfer first started to dominate. Consequently, if the altitude of the tropopause where determined by where radiant energy started to dominate for heat transfer, then incraseing atmospheric temperature should decrease the altitude of the tropopause. Instead, the tropopause is highest in the tropics and lowest at the poles. Indeed, even cold fronts will lower the tropopause. "As can be seen in the figure above, the tropopause altitude steadily drops from about 12.5 km to 11 km as the DC8 flies west from The Azores toward a cold front in the western Atlantic Ocean. At ~10:15 UT there is evidence of stratospheric tracers (O3, NOy up, CO down) from in situ sensors. At the same time, the tropopause altitude drops abruptly more than 1 km and MTP sees a warm finger of air extending through this tropopause drop, apparently because the descending stratospheric air is being adiabatically heated. Later, at 11:17UT the Langley Research Center DIAL lidar saw the beginning of a stratospheric intrusion at the same time that MTP saw a second tropopause altitude drop"
(Caption quoted from source.)
Finally, I think my comments about the mesosphere in 193 above are still relevant.
"As can be seen in the figure above, the tropopause altitude steadily drops from about 12.5 km to 11 km as the DC8 flies west from The Azores toward a cold front in the western Atlantic Ocean. At ~10:15 UT there is evidence of stratospheric tracers (O3, NOy up, CO down) from in situ sensors. At the same time, the tropopause altitude drops abruptly more than 1 km and MTP sees a warm finger of air extending through this tropopause drop, apparently because the descending stratospheric air is being adiabatically heated. Later, at 11:17UT the Langley Research Center DIAL lidar saw the beginning of a stratospheric intrusion at the same time that MTP saw a second tropopause altitude drop"
(Caption quoted from source.)
Finally, I think my comments about the mesosphere in 193 above are still relevant.
-
Camburn at 13:15 PM on 10 December 2010A Cloudy Outlook for Low Climate Sensitivity
Steven: As far as staticistical temps.....2010 is not over. I still stand by my statement. Also, 93% does NOT cut it. -
Camburn at 13:11 PM on 10 December 2010A Cloudy Outlook for Low Climate Sensitivity
This paper addresses cloud feedback: http://www.esrl.noaa.gov/psd/people/dezheng.sun/dspapers/Sun-Yu-Zhang-JC-revised.pdf -
quokka at 12:51 PM on 10 December 2010Renewable Baseload Energy
395 actually thoughtfull Who is this "we" and where does this "we" live? If you want this sort of thing to be taken seriously, provide some data and references. As always, the only thing that actually matters is planetary scale emissions reductions not feel good greenwash. -
Joe Blog at 12:16 PM on 10 December 2010Stratospheric Cooling and Tropospheric Warming
Tom Curtis lol, yup, but i did say transparent. Not non radiating, so this energy could be radiated away by magical atmosphere. But i recall coming to a similar conclusion thinking about a non radiating atmosphere. -
actually thoughtful at 12:06 PM on 10 December 2010Renewable Baseload Energy
I should point out however, that solar water heaters can heat your home. Most people think about heating hot water - we are able to get over 75% of annual space heating and hot water from the sun. Right now, today. With payback less than a decade (and less than 20 years without rebates - meaning it is financially viable/smart now). -
Tom Curtis at 12:02 PM on 10 December 2010Stratospheric Cooling and Tropospheric Warming
Joe Blog @214, heat is also passed from surface to atmosphere by evaporation and transpiration. This, together with conduction would be enough to heat the lowest layer of the atmosphere to surface temperature, even in the absence of radiant heat transfer. And that in turn would be enough to generate convection. Even if only conduction were available, that would still raise the lower atmosphere's temperature to near surface temperatures. Because conduction is a slow method of heat transfer, the lower atmosphere would not have a large day-night cycle in temperature, although land surfaces would have a very large cycle. But even this slow method of heat transfer would heat the entire atmosphere up to at least the mesopause in the absence of any absorption of radiant energy by the atmosphere. -
Tom Curtis at 11:55 AM on 10 December 2010Stratospheric Cooling and Tropospheric Warming
Bob @201, as you surmise, temperature in the stratosphere is partially controlled by the mixing ration of Ozone to CO2, and if the flux of UV was constant with altitude, we would expect the highest temperature in the stratosphere to be where the highest mixing ratio was found. However, UV flux is not constant with altitude. Most UV-a, the most energetic form of UV, is absorbed above the level of maximum O3, apparently by the breakup of O2 (VGT @211).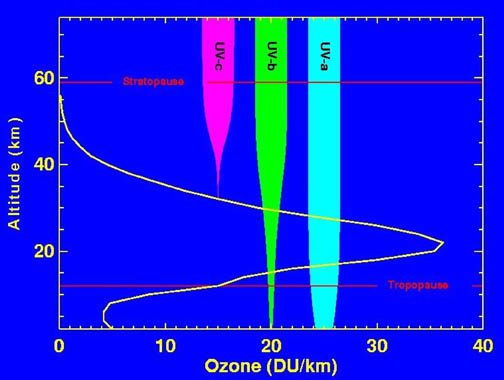 Considering UV-b, the next most energetic form of UV, nearly half is absorbed above 30km. Combined with the energy from UV-a, this should be sufficient to explain the temperature profile in the stratosphere.
 An interesting consequence of reduced O3 is that UV should penetrate further into the stratosphere. This should show up as a cooling at higher altitudes as they absorb less UV, but a warming at lower altitudes as more UV penetrates to the lower levels to be absorbed.
 The result is that in the lowest levels of the stratosphere, CO2 cooling is almost balanced by an ozone based warming, while in the upper levels they reinforce each other.
PS: In preview, my first two images are not showing. I am leaving them in in case this is just a temporary bug, but in the mean time they can be found at the wikipedia article on the ozone layer.
Moderator Response: [Daniel Bailey] Fixed links. TIP: When linking to Wiki graphics, make sure you click on the graphic itself, bringing up the page with just the desired graphic and no text. If you see text still, click on the graphic again to bring up the source storage position for that graphic. That should take care of it.
The result is that in the lowest levels of the stratosphere, CO2 cooling is almost balanced by an ozone based warming, while in the upper levels they reinforce each other.
PS: In preview, my first two images are not showing. I am leaving them in in case this is just a temporary bug, but in the mean time they can be found at the wikipedia article on the ozone layer.
Moderator Response: [Daniel Bailey] Fixed links. TIP: When linking to Wiki graphics, make sure you click on the graphic itself, bringing up the page with just the desired graphic and no text. If you see text still, click on the graphic again to bring up the source storage position for that graphic. That should take care of it. -
quokka at 11:52 AM on 10 December 2010Renewable Baseload Energy
@392 archiesteelRe: RSVP's last bunch of tro...I mean, comments, I'd be curious to hear how quokka would respond to the "argument" put forth.
I'd say RSVP is numerically challenged. Some things don't pass the smell test. But if pressed, I would suggest that the effects of a rise of 2-3 degrees in global temperatures on renewables is most likely unknown. Changes in cloudiness could affect all types of solar but which way?, PV might be slightly less efficient due to temperature, CSP relying on a heat engine may be slightly less efficent, wind - who knows? Regional climate change might be the major factor. Overall effect likely to be small. As for solar hot water systems heating the planet - don't make me laugh. -
mars at 11:37 AM on 10 December 2010Stratospheric Cooling and Tropospheric Warming
Joe Blog at 214 And on refection I also fully with 214 -
Ice data made cooler
JK: the application file is Flash (.swf) which can be run by any browser that supports a flash player plugin. The code is written in Flash's scripting language called ActionScript. Contact me at my blog (http://www.brightstarswildomar.blogspot.com/) and we can figure out how to exchange files. jg -
mars at 10:28 AM on 10 December 2010Stratospheric Cooling and Tropospheric Warming
Joe Blog at 215 I fully agree with that. -
jorgepeine at 10:07 AM on 10 December 2010Ice data made cooler
JG: thanks for the comment. of course now everything is clear. The programme I was requesting is the one which generates the graph ... (is it in Java or Javascript or C++ or fortran?) -
michael sweet at 10:03 AM on 10 December 2010Ice data made cooler
RSVP, Oxygen is not very soluble in water while carbon dioxide is very soluble in sea water. Therefor the ocean can outgas a lot of CO2 but not much O2. In addition, since the amount of CO2 in the atmosphere is small relative to oxygen, releasing the same amount of both gases would substantially raise CO2 while leaving O2 essentially unaffected. A person with your level of understanding of science should refrain from speculating about changes in the climate and atmosphere on a science blog. -
scaddenp at 09:40 AM on 10 December 2010Ice data made cooler
The relative important of various feedbacks the magnify the NH milankovic cycle is still significant area of research as far as I know. The lack of land in SH temperature zone has to involved to explain why there global glacial cycle isnt a seesaw between NH and SH. Beside ocean feedbacks, there is of course albedo (limited in SH because little land available to cover with ice. Australia is too low and too far north) but also note the biogenic methane is clearly a feedback. Swamp methane,(increases with warm, decrease with cold) which then oxidises to CO2. The effect of vegetative change on the CO2 feedback also appears to be significant(see Kohler et al -
scaddenp at 09:38 AM on 10 December 2010Models are unreliable
Chris, first note that models are scenarios based on amount of GHG in the atmosphere. ie if CO2 is 450ppm, then climate looks like x. Now if against all paleo icecore data we have situation whereby warming world REDUCED pulls more CO2 from atmosphere than a cooler one, the result would be that the emissions scenarios need revised. ie for a given rate of fossil fuel consumption, then the rate of accumulation of CO2 in the atmosphere would reduce. However,I am unaware of any modern or paleo data to support the idea that increased temperature would decrease CO2 - in fact all of the evidence I have seen to date shows the opposite. -
dana1981 at 09:29 AM on 10 December 2010A Cloudy Outlook for Low Climate Sensitivity
Damn, I wish Dessler's paper had come out a week earlier! Maybe I'll have to do a new blog post as an addendum to this one... -
Marcus at 09:25 AM on 10 December 2010Ice data made cooler
Hi Tony, thanks for the reply. Yes, having done a fair bit of reading on Milankovitch Cycles, I can honestly agree that it is *extremely* robust-& fits extremely well into the climate cycles of at least the last 1 million years. My question was more seeking clarification of exactly how Milankovitch cycles work. Judging from John's reply, I was close, but not quite on the mark ;). Certainly the uniformity of recent warming events is yet more proof that Milankovitch cycles cannot be blamed this time around ;)! -
Alec Cowan at 09:21 AM on 10 December 2010Ice data made cooler
jp Excellent work! Don't worry about comment #3. I don't have the exact numbers at the moment but the same release from the oceans that makes CO2 raise from 250 to 400 ppmv as a product of the warming process makes oxygen, for instance, to rise from some 209,000 to 209,030 ppmv, so the conclusion is pretty obvious: much below other error margins. About eccentricity, Laskar et al have taken care of it, so the conclusion is: done. There are a few things that ""should"" be considered along the content of comment #3, but I'll better comment in your blog as many "eager skeptics" use to hang raw comments in sites like this just to have them corrected so they can publish them in other sites as arguments (the "throw everything at the wall and see what sticks" strategy described here by dana1981) -
Ice data made cooler
RSVP: Thank you for elaborating. I'm not qualified to give you an answer. I can only make a comparison. Forgive my not looking the name up, but there are a couple lakes in West Africa notorious for their sudden outgassing of CO2 that has sufficated nearby inhabitants. Somehow it was possible for thsese bodies of water to build up CO2 in ratios not typical of the atmosphere and then release it, also in ratios not typical. I have a few articles that describe the role of outgasing and the ocean's biological pump. One mentioned that a mechanism building up CO2 could be the reduction of ocean's biologoical pump. As I understand the biological pump, it's the growth of phytoplankton that take up CO2 die and sink to the bottom. A lot of recycling of nutrients happens in the 100 meters before the dead plankton sink, but the net sum of what gets through and buried can change, and this process is selective. In fact the scientific literature is full of processes that selectively operate on different chemicals and elements. Thank you for encouraging me to ponder this. jg -
Steven Sullivan at 08:34 AM on 10 December 2010A Cloudy Outlook for Low Climate Sensitivity
Camburn @64:"1. Statistically, and this is important unless you want to throw statistical analysis out with the wash, we have not warmed for the past 15 years." Leaving aside the disingenuousness of totally ignoring a *93%* level of significance for said warming: Start from when Phil Jones made that comment, and go back to 1995 -- *16* years instead of 15. Voila: warming, at or better than the 95% significance level. Or: Start from when Phil Jones made that comment. Go back to 1995 (15 years) Add the rest of 2010 since he made that comment. Voila: warming at or better than 95% significance level. Still feeling lucky, Camburn? Btw, I can see that at this point, having lost on the substance of Dana post, you're just robotically going down the same old well-worn list of 'skeptic' talking points. The Jones quote; the Trenberth quote; can 'hide the decline' be far behind? -
archiesteel at 08:32 AM on 10 December 2010Ice data made cooler
@RSVP: you seem to be ignoring the gigatons of anthropogenic CO2 being released in the atmosphere each year... -
archiesteel at 08:31 AM on 10 December 2010We're heading into an ice age
@NQoA: "That's pretty much what the "Climate Change Deniers" have been saying all along." Actually, that isn't true. There are still many deniers/politically-motivated skeptics who still dispute we are in a warming trend. Indeed, many of those who have been trying to prop up the failed manufactured Climategate scandal (which has now been thoroughly eclipsed by Cablegate) are saying just that. The fact that you seem to believe warming should be linear is also a sign you are gravely mistaken: complex systems do not react in linear fashion. Look at the Stock Market if you don't believe me... -
RSVP at 08:28 AM on 10 December 2010Ice data made cooler
jg #8 "The release of oxygen tempering the effect of CO2 releases is new to me." To me too, since I made it up on the fly. I am referring to the fact that all components of the atmosphere dissolve in water, so when CO2 is released as a function of warming so is everything else, thereby increasing partial pressures of all gases. If all partial pressures increase in unision, its not clear why the ppm of any one component should go up. In fact, you would expect the partial pressure of the more abundant gas to go up higher in proportion to its overall percentage, so that in fact ppm of CO2 being so small should go down. But I am no expert, so this is pure conjecture bases solely on skeptical logic. -
Ice data made cooler
Anyone wanting to exchange files can contact me at my blog. Go to http://www.brightstarswildomar.blogspot.com/. -
Ice data made cooler
paulm, Good suggestion. I'll add that feature to the list. There some enjoyable irony in that I built this program so that I wouldn't accidently mix up time periods. JK: The insolation values are for June (northern hemisphere) and December(southern hemisphere). So though both plots are of the same latitude, one is what you would measure at one point in Earth's orbit, and the other, six months later. So as long as there is some eccentricity, these values would be different, that is, except for times when the equinoxes are at right angles to the semi-major axis, e.g., at 135kyr (second diagram). When I first collected the data, I included plots that could compare +65 June to -65 June, and quickly decided this wasn't as valuble of a comparison as N. Summer (Jun) to S. Summer (Dec); However, I may add these graphs. Your request for a copy of the program--that was for Mike's global warming game, correct? jg -
jorgepeine at 07:50 AM on 10 December 2010Ice data made cooler
Hi Mike, this is a very interesting and fascinating program. Thank you. Can I get a copy of it? Just for teaching astronomy and climate physics. However I do not understand the following: When you - only - click insolation on 0º NH and simultaneously on 0º SH - I would expect equal plots. However they have a "phase shift" of - say it simple - 180º .. Could you explain that please? kind regards JK PS: I made a screenshot of this phenomenon - how could I provide that to you? -
cjshaker at 07:41 AM on 10 December 2010Models are unreliable
It appears that not quite half of the photosynthesis occurring on the earth is in the oceans. Search for 'Global' http://en.wikipedia.org/wiki/Primary_production "Using satellite-derived estimates of the Normalized Difference Vegetation Index (NDVI) for terrestrial habitats and sea-surface chlorophyll for the oceans, it is estimated that the total (photoautotrophic) primary production for the Earth was 104.9 Gt C yr−1.[12] Of this, 56.4 Gt C yr−1 (53.8%), was the product of terrestrial organisms, while the remaining 48.5 Gt C yr−1, was accounted for by oceanic production." So, I hope to read that these negative CO2 feedback effects are also being modeled for algae as well. Chris Shaker -
Joe Blog at 07:27 AM on 10 December 2010Stratospheric Cooling and Tropospheric Warming
Bob Guercio at 04:25 AM The ozone's thinning can and has been quantified, variable UV through the solar cycle, also effects stratospheric T's, UV is the most variable wave length through the cycle. But smarter people than me, have done studies on these things... there is that paper that by Johanna Haige, that a thread was done on here that may impact these. But the reason why raising co2, should cause the stratosphere to cool, is because it causes more energy to be lost from the stratosphere through radiation. VeryTallGuy - 212 Yes (-: -
cjshaker at 07:27 AM on 10 December 2010Models are unreliable
Older research on the topic, and it appears, more controversy http://www.sciencedaily.com/releases/2007/12/071211233441.htm "Interestingly, warming temperatures in response to rising carbon dioxide levels could make more nitrogen available, said Xiaojuan Yang, a doctoral student in Jain’s lab. This factor must also be weighed in any calculation of net carbon dioxide load, she said. “Previous modeling studies show that due to warming, the soil releases more carbon dioxide through increased decomposition,” she said. “But they are not considering the nitrogen effect. When the soil is releasing more CO2, at the same time more nitrogen is mineralized. This means that more nitrogen becomes available for plants to use.”" Chris Shaker -
cjshaker at 07:21 AM on 10 December 2010Models are unreliable
Found several articles lately about plant growth providing negative feedback against CO2 increases, including this recent NASA model update. I've also read a paper saying that rising temperatures will also make more nitrogen available for plant growth. These new models seem to make increased temperatures from a doubling of CO2 much more modest than previously claimed. Do these new models also include the negative feedback from the ocean equivalents of green plants, ie - photosynthetic creatures like algae, diatoms, coral, etc? The huge biomass in the oceans would seem to be more important than terrestrial plants? The Science Daily report on the NASA study http://www.sciencedaily.com/releases/2010/12/1012080 Here is the abstract from the paper http://europa.agu.org/?view=article&uri=/journals/gl/gl1023/2010GL045338/2010GL045338.xml&t=gl,bounoua "Several climate models indicate that in a 2 × CO2 environment, temperature and precipitation would increase and runoff would increase faster than precipitation. These models, however, did not allow the vegetation to increase its leaf density as a response to the physiological effects of increased CO2 and consequent changes in climate. Other assessments included these interactions but did not account for the vegetation down‐regulation to reduce plant's photosynthetic activity and as such resulted in a weak vegetation negative response. When we combine these interactions in climate simulations with 2 × CO2, the associated increase in precipitation contributes primarily to increase evapotranspiration rather than surface runoff, consistent with observations, and results in an additional cooling effect not fully accounted for in previous simulations with elevated CO2. By accelerating the water cycle, this feedback slows but does not alleviate the projected warming, reducing the land surface warming by 0.6°C. Compared to previous studies, these results imply that long term negative feedback from CO2‐induced increases in vegetation density could reduce temperature following a stabilization of CO2 concentration." Chris Shaker -
Joe Blog at 07:19 AM on 10 December 2010Stratospheric Cooling and Tropospheric Warming
mars at 19:39 PM on 9 December, 2010 says "The atmosphere at low levels is transparent to nearly all of the incoming radiation." I took that as a given, i was talking about LW. Mars says "The atmosphere is heated by contact with the surface. As a result a parcel of air close to the ground forms which is warmer than the surrounding air." The air is heated, by conduction and radiation, and as a result of the air being opaque to LW radiation in the lower troposphere, this energy is trapped, if it was transparent, it would simply pass through at the speed of light. There is nothing wrong with your description of convection, but the properties of the lower atmosphere are taken as a given, radiation is not considered, because the lower troposphere is opaque to the passing of LW, but at 6000m, radiation is the dominate means of energy transport(this is the average altitude of equilibrium with incoming and out going energy), not the sole, but dominate. As you rise further, the atmosphere becomes more and more transparent, and convection less and less important. -
syphax at 07:14 AM on 10 December 2010A Cloudy Outlook for Low Climate Sensitivity
Ha! And here's some additional commentary from Dessler, addressing Spencer directly. My cup runneth over. Especially this part:And as far as my interest in influencing the policy debate goes, I’ll just say that I’m in College Station this week, while Dr. Spencer is in Cancun. In fact, Dr. Spencer had a press conference in Cancun — about my paper. I didn’t have a press conference about my paper. Draw your own conclusion.
-
Eric (skeptic) at 06:54 AM on 10 December 2010It's cosmic rays
muoncounter, the low frequency is a good point. I don't what the frequency history is, but likely it varies between zero and small. But it is not random since the galactic structure was not random over time and our transit through the galaxy does not take us into random amounts of leftover particles. It is quite unpredictable, although not completely unpredictable. They are modulated by solar activity and of course solar activity itself has other effects, so it is worth studying and using GCR as a proxy. But this thread is about cosmic rays and (my addition) the effect they could have on sensitivity. The fact of CO2 warming is not in question here (or at all), just sensitivity and I would greatly appreciate your opinion on my final sentence in #29.
Prev 2024 2025 2026 2027 2028 2029 2030 2031 2032 2033 2034 2035 2036 2037 2038 2039 Next


