


 Arguments


Recent Comments
Prev 2144 2145 2146 2147 2148 2149 2150 2151 2152 2153 2154 2155 2156 2157 2158 2159 Next
Comments 107551 to 107600:
-
Doug Bostrom at 15:36 PM on 6 October 2010Uncertain Times at the Royal Society?
Although he's much-decorated I don't see anything about a Richard Lindzen Nobel prize in his bio: Richard Lindzen He does seem to have that reputation in some circles. Perhaps this was the shared award for IPCC work? Pretty ironic if so. I notice that the sites referring to him primarily as a Nobel laureate don't mention why he received his award. In any case, other than He Who Shall Not Be Named, no individuals were apparently included in the 2007 Nobel accorded to the IPCC: The Nobel Peace Prize 2007 was awarded jointly to Intergovernmental Panel on Climate Change (IPCC) and Albert Arnold (Al) Gore Jr. "for their efforts to build up and disseminate greater knowledge about man-made climate change, and to lay the foundations for the measures that are needed to counteract such change" -
archiesteel at 15:33 PM on 6 October 2010The value of coherence in science
@TIS: "The natural increase was a 9% increase. Since then there has been a 39% increase in CO2. That is a multiple of 4.3 not 3 orders of magnitude. 280ppm to 390 ppm is in no way an increase of 1000x." A 9 percent increase over millenia, which amounts to a rate of increase of 0.27ppm per century (the figure from the graph on your blog) , vs. a rate of increase of 2ppm per year, which is likely to increase to 3 and more if the current trend in emmissions continues. As I said, about three orders of magnitude. "I was not insulting although the article was to those that disagree. I don't mind being insulted" Uh...who said anything about insults? I didn't insult you, nor did I insinuated you insulted others. I simply asked you to stop spamming your blog. "but please look at the Taylor Dome temperature of the past 1,000 years before saying that the current warming is very unlikely to be natural. The Taylor Dome shows 4 warming periods comparable to the current." It's hard to say because your graph does not show how it compares to the instrumental record. Without providing the context of temperatures for the last hundred years, your claim is meaningless. In other words, your graph does not allow to make the claim that similar average temperature increases have occured in the last 1,000 years, nor that average temperatures have been higher than the current ones during the past millenium. You should learn more about the science before adding one more outlet to an already crowded contrarian blogosphere... -
macoles at 15:29 PM on 6 October 2010The value of coherence in science
TIS at 1, Why are you using the extreme ends of the Earth - Arctic on your website, and Antarctic in your link - to make an argument about average global temperatures? Surely a dataset with a decent spread of locations across the globe would be far more suitable? -
Daniel Bailey at 15:23 PM on 6 October 2010New observations find underwater Arctic Shelf is perforated and venting methane
Some interesting recent developments on the methane clathrate/PETM front. 1. From GEOLOGY (Abstract only available):"Changes in ocean circulation have been proposed as a trigger mechanism for the large coupled climate and carbon cycle perturbations at the Paleocene-Eocene Thermal Maximum (PETM, ca. 55 Ma). An abrupt warming of oceanic intermediate waters could have initiated the thermal destabilization of sediment-hosted methane gas hydrates and potentially triggered sediment slumps and slides. In an ensemble of fully coupled atmosphere-ocean general circulation model (AOGCM) simulations of the late Paleocene and early Eocene, we identify such a circulation-driven enhanced intermediate-water warming. Critically, we find an approximate twofold amplification of Atlantic intermediate-water warming when CO2 levels are doubled from 2× to 4× preindustrial CO2 compared to when they are doubled from 1× to 2×. This warming is largely focused on the equatorial and South Atlantic and is driven by a significant reduction in deep-water formation from the Southern Ocean. This scenario is consistent with altered PETM circulation patterns inferred from benthic carbon isotope data and the intensity of deep-sea carbonate dissolution in the South Atlantic. The linkage between intermediate-water warming and gas hydrate destabilization could provide an important feedback in the establishment of peak PETM warmth."
Source: CO2-driven ocean circulation changes as an amplifier of Paleocene-Eocene thermal maximum hydrate destabilization 2. From Philosophical Transactions Of The Royal Society A (Abstract only available):"The plausible range of carbon mass input, approximately 4000–7000 PgC, strongly suggests a major alternative source of carbon in addition to any contribution from methane hydrates. We find that the potential range of PETM atmospheric pCO2 increase, combined with proxy estimates of the PETM temperature anomaly, does not necessarily imply climate sensitivities beyond the range of state-of-the-art climate models."
Source: A Palaeogene perspective on climate sensitivity and methane hydrate instability 3. From a poster presentation at the EGU, 2010"Hyperthermal climate events are geologically brief (~10-100kyrs) transient periods of marked global warming associated with prominent negative carbon isotope excursions and deep-sea carbonate dissolution. They are most likely the result of massive injections of isotopically light carbon into the ocean-atmosphere system. One plausible source of isotopically light carbon is a widespread dissociation of continental slope, sediment-hosted methane gas hydrates. Proposed triggers for the dissociation of such deep-water hydrates include a pronounced (~4ºC) warming of intermediate to deep waters driven by changes in global overturning circulation (Dickens et al., 1995). The most prominent hyperthermal event of the Ceonzoic is the Paleocene Eocene thermal maximum (~55Ma; PETM)." "CONCLUSIONS We show modelling results which support the hypothesis that Eocene hyperthermals could be paced by orbital variations. The mechanism for this forcing is orbitally induced switches in ocean circulation, which lead to non-linear intermediate ocean warming, with the possibility of resulting destabilization of methane gas hydrates. The switches in circulation are associated with high eccentricity and obliquity and maximum seasonality in the Northern Hemisphere."
Poster Source: Is There An Orbital Control On Eocene Hyperthermals? Apologies for no links to the full articles (both paywalled). I've requested the articles through my employer library; will offer up a deeper dish when I get them. The Yooper -
The Inconvenient Skeptic at 15:18 PM on 6 October 2010The value of coherence in science
The natural increase was a 9% increase. Since then there has been a 39% increase in CO2. That is a multiple of 4.3 not 3 orders of magnitude. 280ppm to 390 ppm is in no way an increase of 1000x. I was not insulting although the article was to those that disagree. I don't mind being insulted, but please look at the Taylor Dome temperature of the past 1,000 years before saying that the current warming is very unlikely to be natural. The Taylor Dome shows 4 warming periods comparable to the current. -
scaddenp at 15:10 PM on 6 October 2010Climate Change: Past, Present, and Future
GC - it takes time for air in accumulating snow to become isolated from atmosphere which is why ice core is no help to you for past 100 years. Dont splice the instrument record on (though this shows you are misinformed about Mann) - just put current central greenland average temperature onto the graph - see that graphic - higher than any time is last 3000 years. -
archiesteel at 15:08 PM on 6 October 2010The value of coherence in science
@TIS: There's nothing incoherent with CO2 rising by a relatively small amount and temperatures in slow decline. The reason is that CO2 is one of the main forcings but not the only one. What this means is that, since the Holocene Climate Optimum, the slow rise in CO2 has not been enough to counter the other long-term forcings (Milankovitch cycles in this case, IIRC). What you don't seem to understand is that the CO2 increase you refer to is *three* orders of magnitude smaller (i.e. about 1000x less) than the current increase. As for the temperature drop, it is also dwarfed by the current increase, representing only 2.5% of it in absolute terms. The Earth does go through cycles, short and long, but what you have to realize is that it's highly unlikely the current warming is due to a natural cycle. In fact, considering what the science tells us, it's nearly impossible. Oh, one more thing: you should really quit spamming links to your blog. It's not a very classy move. -
scaddenp at 15:03 PM on 6 October 2010Uncertain Times at the Royal Society?
Lindzen got a Nobel? News to me though he most certainly has produced outstanding work. Lindzen and Choi not being one them however. It has been specifically rebutted in the published literature and so far as I am aware, Lindzen has not responded. Furthermore, observational data would appear to directly refute it. -
gallopingcamel at 14:53 PM on 6 October 2010Climate Change: Past, Present, and Future
scaddenp, (#80), Alley's interest was the Younger Dryas. I am hoping someone at NCDC has looked carefully at the last 2,000 years and how to fill in the interval since 1905. Is there an instrumental record that can be "spliced on"? That is one of the things that got Michael Mann into trouble! The snow accumulation issue is a tough one, especially if the flow rates are as strongly affected by thickness as Alley claims (8th power?). -
The Inconvenient Skeptic at 14:51 PM on 6 October 2010The value of coherence in science
You are correct that coherence is important. It is not incoherent to say that the Earth goes through short cycle and long cycle changes. The Earth is experiencing a short cycle of warming during a long cycle of cooling. The data supports that statement. You argue about not knowing the price of sheep, but wanting to buy while they are cheap. I pointed out that the Taylor Dome shows the past 6,000 years cooling while having 10,000 of increasing CO2 levels. I am told that CO2 is the main forcing factor in climate, but not to concern myself with the data. That is incoherent. There are many incoherent people that are skeptics. There are many incoherent people that believe in AGW. I will be called incoherent for not believing in AGW, but in the end CO2 has been rising for the past 10,000 years and the Earth has been in a long term cooling trend for the past 6,000 years. The Earth is not a linear system and as such there are many peaks and valleys along the way. The current period is a peak, I hope it lasts a long time because the valleys are unpleasant. The Earth is always changing. It has never and will never stay the same. Our current technology is allowing to see and measure that change. John Kehr The Inconvenient Skeptic -
gallopingcamel at 14:38 PM on 6 October 2010Uncertain Times at the Royal Society?
scaddenp (#117)' I will probably be told to take this issue to another thread but you did ask a fair question. Lindzen & Choi 2009 is a paper on the feedback question written by a Nobel laureate. The Lindzen paper is controversial but so are the dozen models cited by the IPCC. -
Doug Bostrom at 14:38 PM on 6 October 2010Extreme weather isn't caused by global warming
Scaddenp, bearing in mind that I'm assuredly -not- being smart-aleck, in some ways this site is "open source" in the sense that people drag in all sorts of literature and deposit it for everybody's enjoyment. "Enjoyment" often takes the form of attacking offerings and dragging them back and forth like meat thrown to a pack of feral dogs, but that's just one possible outcome. If you should have a few minutes to spend beavering away at Google Scholar, looking for likely candidates, you can bet that what you find will be most appreciated. -
Glenn Tamblyn at 13:56 PM on 6 October 2010What constitutes 'safe' global warming?
Matthew @43. Agnostic @42 referred to CO2e, not CO2. Currently CO2e is at around 430-440 ppm. And you are right, CO2 is growing at about 2 ppm/yr at present. During the 2000's, CO2 emissions were growing at about 3%/year. That is a doubling time of 25 years. So if sustained, by 2035 we would be growing at 4ppm per year and 8 ppm per year by 2070. That growth rate however is made up of different contributions from different parts of the world. And the biggest growth rate is China. During the 2000's their coal consumption grew by around 7%/year, which is a doubling period of around 10 years. And as they continue to grow, their increasing size means their growth rate will come to have a bigger impact on the global growth rate figure. How long before we see 4 or 5% global growth rates. 5% growth is a doubling of around 15 years so by 2025, that would be increases of 4ppm/year and 8 ppm/year by 2040. So if China (and other nations like India following them) are able to sustain their economic growth rates for several decades to come and can't bring renewables / nuclear onstream at major scales incredibly fast, we could blow through the doubling level of 560ppm before mid century. Bringing renewables to mainstream generation levels that fast is a herculean task. And if we allow that much fossil fuel capacity to be built, decommissioning it before the end of its working life will involve capital right-offs that will make the WFC look like chickenfeed. And if the growth stalls in those countries, then the political, social and military implications of that are terrifying. We are in deep sh!t, right here, right now, today. Humanity may pay a terrible price for the fact that deep down, we just don't 'get' the Compound Interest Law! -
scaddenp at 13:50 PM on 6 October 2010Uncertain Times at the Royal Society?
GC - a published paper demonstrating net negative feedback would be more convincing. Any of these nobel laureates got one out? Net negative feedback would mean sensitivity of less that about 1.9. By contrast, we have all these papers measuring or modelling sensitivity by various means which show it higher. And for a longer view, Wally estimated the temperature for 2010 with surprising accuracy (all right he was lucky), in 1975 with an estimate of 2.8 (thats strongly positive feedback) though he also overestimated our emissions by a bit. -
scaddenp at 13:41 PM on 6 October 2010Extreme weather isn't caused by global warming
This rebuttal lack links to actual studies which is unusual and I think should be fixed. -
gallopingcamel at 13:28 PM on 6 October 2010Uncertain Times at the Royal Society?
Baz(#111), If it turns out that rising CO2 is a major contributor to the recent upturn in temperatures we should be able to get a good estimate of "feedbacks". Are they negative or positive? There are plenty of people on this site who are convinced that the feedbacks are strongly positive but many well respected scientists (some of them with Nobel prizes) disagree. Sadly the question is well above my pay grade so I waiting to see what happens next. -
Glenn Tamblyn at 13:27 PM on 6 October 2010What constitutes 'safe' global warming?
HumanityRules @39 "No disrespect but I do find it funny the casual way you drop in the " 0.6°C warming in the pipeline" as if it's a concrete fact." The actual figure of 0.6 is an estimate. That there must be an outstanding warming of some level that is still 'in the pipeline' is basic thermodynamics. The oceans have warmed less than th air since they have massively greater thermal mass. It takes time for them to warm to a comparable level. So as they warm more slowly, the growing temperature differential between them and the atmosphere starts to limit the temperature growth of the atmosphere. Personally I am surprised that the figure estimated for the 'in the pipeline' rise is only 0.6, I would have thoght higher. But that is only gut feel, not calculation. "If we were all honest about this we'd admit that at this stage that is little more than an idea which is around simply to fill an embarassing hole in an equation. " As I said, Its thermodynamics, not just an idea. And what is this hole you are referring to anyway? "There are other explanations which could replace "warming in the pipeline" which seem to me no more or no less plausable." Such as? -
Matthew at 13:20 PM on 6 October 2010What constitutes 'safe' global warming?
Agnostic, at 2+ ppm of co2 being added per year it will take 30 years to make it to 450 ppm at the current rate. We will see if that will speed up or slow down, but that is the current rate. At this rate by 210 we will near near 570 ppm. We would of doubled. -
Riduna at 13:12 PM on 6 October 2010What constitutes 'safe' global warming?
Daniel (38) Thanks. The URL is http://pubs.giss.nasa.gov/docs/2008/2008_Hansen_1.pdf Hansen argues, with some conviction, that CO2-e concentration of 450 ppm is too high to limit temperature increase to 2C by 2100. I think he is right and that we probably approach a dangerous tipping point when concentrations exceed 400 ppm. CO2-e concentration is already 388 ppm and rising at an accelerating rate because of our reliance on and increasing use of fossil fuels to meet our energy needs. Don’t you think it rather disconcerting that the IMF should be lending billions for the building of coal fired power stations (http://www.smh.com.au/world/world-bank-spends-billions-on-coal-power-20100916-15emx.html) at a time when the world should be contracting rather than expanding the use of coal. -
muoncounter at 12:43 PM on 6 October 2010Extreme weather isn't caused by global warming
Here is a statement of what should be the new paradigm: Weather in a given region occurs in such a complex and unstable environment, driven by such a multitude of factors, that no single weather event can be pinned solely on climate change. In that sense, it's correct to say that the Moscow heat wave was not caused by climate change. However, if one frames the question slightly differently: "Would an event like the Moscow heat wave have occurred if carbon dioxide levels had remained at pre-industrial levels," the answer, Hansen asserts, is clear: "Almost certainly not." The frequency of extreme warm anomalies increases disproportionately as global temperature rises. "Were global temperature not increasing, the chance of an extreme heat wave such as the one Moscow experienced, though not impossible, would be small," Hansen says. The map on that page makes it clear exactly what is meant by extreme variability: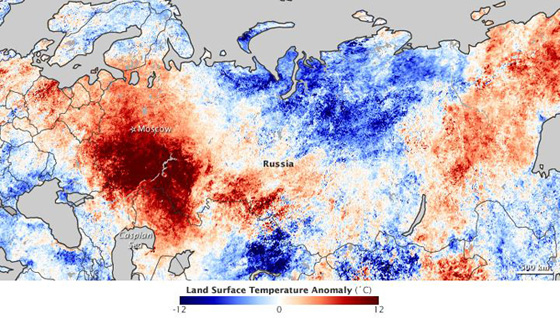
-
OregonStream at 12:30 PM on 6 October 2010Royal Society embraces skepticism
Dr Romm had an interesting discussion on this here: http://climateprogress.org/2010/09/30/royal-society-climate-science-summary-guide/ -
adelady at 11:48 AM on 6 October 2010What constitutes 'safe' global warming?
HR@39 If you see the head of a lion or a snake coming through the window, you really, really do not want to wait until the whole body is inside the room before you shout a warning. Once you recognise the shape, and you see/hear/smell that it isn't just a silly kid with a mask, you act. Promptly. -
scaddenp at 11:24 AM on 6 October 2010What constitutes 'safe' global warming?
HR - so what are contrary papers to this estimate then? Seems to fit well with other estimates Hare and Meinshausen, Wigley and Matthews & Weavers. -
HumanityRules at 11:05 AM on 6 October 2010What constitutes 'safe' global warming?
No disrespect but I do find it funny the casual way you drop in the " 0.6°C warming in the pipeline" as if it's a concrete fact. If we were all honest about this we'd admit that at this stage that is little more than an idea which is around simply to fill an embarassing hole in an equation. There are other explanations which could replace "warming in the pipeline" which seem to me no more or no less plausable. The certainty with which you can drop such statements is worrying.Response: Warming in the pipeline isn't a case of trying to account for less than expected warming. On the contrary, it's the inevitable consequence of a physical system with thermal inertia. If you're heating a pot of water, it doesn't instantly become hot. Similarly, if you're adding longwave radiation to the world's oceans, they don't reach equilibrium temperature instantly but take time to approach equilibrium.
The climate time lag is an often misunderstood phenomena. I once tried explaining it but looking back at that post, I did a terrible job (for some mad reason, I thought using mathematical equations made it easier to understand - a sign of how much I had to learn about communicating science at the time). I'm planning to have another crack at it soon - using funky diagrams rather than equations. -
Daniel Bailey at 11:02 AM on 6 October 2010Climate Cherry Pickers: Falling sea levels in 2010
Staggering, The Ville, staggering."All told, 18 percent more water fed into the world's oceans from rivers and melting polar ice sheets in 2006 than in 1994, with an average annual rise of 1.5 percent."
I would venture to use the term 'everlasting gobstoppery', for the first time. (shakes head, wanders away) The Yooper -
chris1204 at 10:57 AM on 6 October 2010Carbon Dioxide - Everyone's Favorite Pollutant
JMurphy @ 88 If you like direct marketing, to each his own. However, producing and distributing the stuff inevitably carries a significant carbon footprint - fuel to power the machinery to chop down the trees, to generate electricity to power the mill, the printing presses, to transport the paper, etc. Of course, most Western democracies enshrine the right to propagate direct marketing under the right of freedom of speech. I guess you're right - it does generate income though I question whether it's value for money. By contrast, those who market tobacco claim that they do so only to promote brand discrimination, not to generate sales, whilst seeking refuge under freedom of speech. So I give you credit for consistency and for backing up your argument. -
kdkd at 09:29 AM on 6 October 2010It's the sun
KR #625 I quite like to recommend this book to people who want to get started with statistics. Although a lot of applied statistics is a bit of a black art that comes from experience of analysing your own data. I'm open to the idea of writing a piece on statistical basics when time permits, but what would be nice would be a statistical naïve to collaborate with :) -
It's the sun
John Cook - Perhaps a statistical analysis thread would be helpful? I'm afraid I'm not the person to write it, unfortunately... -
It's the sun
kdkd - I've found your posts on statistical analysis fascinating, and I did see your earlier exchange regarding solar forcings. Do you have any suggestions for someone (like me) who isn't as familiar with the statistical analysis? Somewhere to get a decent overview on how to look at things like internal variability, sample time required to attain 95% confidence based on variation, or perhaps some of the other topics discussed here with respect to justifying conclusions? I know it's a big topic (eek!), but any pointers would be helpful. -
kdkd at 08:28 AM on 6 October 2010It's the sun
KR #623 I also went through this solar versus CO2 versus other stuff with Ken a while ago using regression modeling. I clearly demonstrated that during the early 20th century, solar forcing was dominant, while during the end of the 20th century CO2 forcing was dominant. The other variables plugged into the equation were not of terrible practical significance. Anyway, in his wisdom, Ken decided to reject the results of this analysis for reasons that he could not explain coherently. -
johnd at 08:27 AM on 6 October 2010An underwater hockey stick
JMurphy at 07:35 AM, I asked that your post be deleted only if my reply was not allowed to stand. If I wasn't to be allowed the right of reply, then it was wrong that your post should stand unchallenged. Initially all moderation was without any comments at all until I began protesting strongly. With regards to the previous original reference to the JAMSTEC discussion, I provided the full link so that anyone interested could have full access to the entire discussion, as you so obviously had done, I therefore could not have been accused of being selective or cherry picking parts of the discussion to suit. If anyone interpreted what was being discussed in the linked page differently to how I interpreted it, that is a different matter, but I openly presented it for all to access, so how could there have been any intent to be selective? In this latest case, I had been very specific in that I was referring to the IOD in relation to BOM modeling, and the email I referenced was the foundation for my assertions and provided 100% support for what I had stated about BOM not incorporating it into their modeling. I think that confusion arose because again what was interpreted from what I had posted was different what I had been specifically referring to. I also stand by what I had posted, hoping that it is instead read in the context meant and not read in the context the reader wants it put into.Moderator Response: And that draws a line under it.
One more reminder: Please move any further discussion on the IOD, Australia's climate, model goodness or badness to appropriate threads. For the IOD probably the best fit is What causes short term changes in ocean heat?. -
kdkd at 08:25 AM on 6 October 2010New temperature reconstruction vindicates ...
KL #149 Well that's a rule of thumb. In reality we use significance tables (at p = 0.05, two tailed):
Anyway if you're going to try to make strong claims about correlations over short periods, you need to do it quantitatively, not qualitatively, and as you can see above, it's a pretty blunt instrument.No paired observations Minimum value of R required for significance Min val of R2 14 0.497 0.247 10 0.576 0.332 8 0.632 0.399 5 0.707 0.499 2 .950 .903 -
muoncounter at 08:25 AM on 6 October 2010It's freaking cold!
#9: "It would be nice to find a more official or peer-reviewed analysis of this." An interesting review and prediction here, with these words for context: Extreme events, by definition, are on the tail of the probability distribution. Events in the tail of the distribution are the ones that change most in frequency of occurrence as the distribution shifts due to global warming. For example, the "hundred year flood" was once something that you had better be aware of, but it was not very likely soon and you could get reasonably priced insurance. But the probability distribution function does not need to shift very far for the 100-year event to be occurring several times a century, along with a good chance of at least one 500-year event. And a link to Dr. James Hansen - How Warm Was This Summer? -
Paul D at 08:18 AM on 6 October 2010Climate Cherry Pickers: Falling sea levels in 2010
Alarming increase in flow of water into seas: http://www.sciencedaily.com/releases/2010/10/101004151700.htm "What we're seeing is exactly what the Intergovernmental Panel on Climate Change predicted -- that precipitation is increasing in the tropics and the Arctic Circle with heavier, more punishing storms." -
johnd at 07:58 AM on 6 October 2010Uncertain Times at the Royal Society?
scaddenp at 07:08 AM, you may be confusing me saying earlier that wind was a factor, a major factor. The 3 major factors directly driving evaporation are:- a) net radiation impinging on the water (heat input), b) vapour pressure (vpd) of the air passing over the pan . c) windspeed (ventilation). which are discussed in the paper titled:- Proceedings of a workshop held at the Shine Dome, Australian Academy of Science, Canberra 22-23 November 2004 Pan evaporation: An example of the detection and attribution of trends in climate variables -
michael sweet at 07:48 AM on 6 October 2010Carbon Dioxide - Everyone's Favorite Pollutant
An additional comparison between ozone and CO2 is that the deniers of the ozone problem said it would be impossible/very costly to replace freon. We would have no refrigeration, air conditioning etc. Of course they were wrong. Now the same crew says it is to expensive to fix CO2 pollution. Both problems require global action to resolve. The actions taken to fix ozone give me hope that we can deal with CO2. -
hadfield at 07:36 AM on 6 October 2010Positive feedback means runaway warming
OK, I'm happy to leave it there. -
JMurphy at 07:35 AM on 6 October 2010An underwater hockey stick
johnd, I intend to reply this once only (if I'm allowed), because we are now way, way off topic. If you found my comment offensive then I'm sorry, because that is not how it was intended or, indeed, how I still read it. Perhaps I should use more emoticons, but, nevertheless, I am very surprised about your reaction and think it an over-reaction. However, that is just my opinion and you obviously disagree. Others will make their own minds up but I stand by my general assertion that the way you provide backing for your comments is overly (and frustratingly) selective and, again in my opinion, an unnecessary distraction away from open, honest and credible debate within these threads. Finally, despite what I think of some of your comments, I still would never ask for them to be censored or deleted. -
scaddenp at 07:21 AM on 6 October 2010Climate Change: Past, Present, and Future
GC - the data from Alley wont have changed. Ice core data is no use for modern time because upper parts of snow pack still exchange data with the air. The graphic I pointed to has modern temperature - definitely NOT the same as 1905 - the latest point in the ice core record. Make your "zero" point 1905 and add met data. Also for your points - ice sheet volume is function of accumulation minus ablation. In warmer times, there is more precipitation (as snow) affecting high, cold central parts (same is true of east Antarctica, and in NZ western glaciers) However, ablation at edges will overwhelm it - as shown by the various ice sheet mapping techniques. And is it only you that doesnt understand what is happening with stations? But I guess they will be happy to tell you.Moderator Response: Please take the dropped stations discussion to the relevant page. Thanks. -
scaddenp at 07:08 AM on 6 October 2010Uncertain Times at the Royal Society?
Johnd - I think (and I may be wrong) that you are trying to imply that wind changes affecting evaporation is a climate FORCING. I am pointing out that wind change cannot be a forcing - wind changes can only be a response to temperature difference which in turn have other causes. It is my belief that you are confusing the causes of internal variability ("weather") with causes of climate trends. -
scaddenp at 06:56 AM on 6 October 2010Uncertain Times at the Royal Society?
Baz - just because sharp changes in the past were natural does not imply that sharp changes now are. You have to look at the causes. Are those causes from operating now. Nope. -
Chris G at 06:05 AM on 6 October 2010Carbon Dioxide - Everyone's Favorite Pollutant
Doug, I agree on all points. I was already working on finding a couple of reference links in addition to Dana's; so, for anyone interested, here here is a primer, and here is a more comprehensive (and technical) review article. The review article and Dana's links will have a lot of overlap, but I thought the 8-point summary in it would be a nice-to-have. -
johnd at 05:53 AM on 6 October 2010An underwater hockey stick
Reposted due to deletion. Moderator, you asked me to restate my case, which I have repeatedly done, only to have them deleted.Moderator Response: You have repeatedly asked that we repost the same long complaint originally deleted. In your most recent demand that your post be reinstated, you indicated you'd written that first complaint with the intent of being offensive. Enough. Drop it. -
Doug Bostrom at 05:44 AM on 6 October 2010Carbon Dioxide - Everyone's Favorite Pollutant
Yeah, ChrisG, I suppose it's not really possible to establish a p-chem border between the outside of the smaller marine critters and plants and their insides. I'm actually a little behind the curve on integrating the dismal story of the ocean food farm/mine into my picture. As you suggest the direct pressure of takings is already a bad scene. If we're not only attacking the upper part of the foodchain but also the bottom, it's hard to see a good end. Still, I think that struggling to model toxicity against C02 for us air-breathers is a hard row to hoe. Knock-on effects of accepted physics seem to be the main issue up here in our part of the terrarium. -
Ned at 05:26 AM on 6 October 2010Carbon Dioxide - Everyone's Favorite Pollutant
Another analogy to CO2 as a pollutant is excessive phosphorus loading from fertilizer applications in agricultural landscapes. Phosphorus (and nitrogen, and other nutrients) are necessary for plant growth. But excess nutrients in the soil will be mobilized and find their way into rivers and lakes, leading to harmful algae blooms and long-term declines in water quality. Many agricultural soils in the US Midwest have a century or more's worth of excess phosphorus, thanks to years of over-application. -
Carbon Dioxide - Everyone's Favorite Pollutant
I think the best comparison would be to ozone. It's life-supporting as the ozone layer; screening out UV. But high levels of ozone at low altitude are part of smog, and are pollution. So both level and location of ozone make the difference between life-supporting loveliness and nasty pollutant - for the same gas. -
PeteM at 05:15 AM on 6 October 2010Carbon Dioxide - Everyone's Favorite Pollutant
Chris G (at 03:03 AM on 6 October, 2010) Would a suitable comparison be the use of lead in plumbing. The human body can tolerate some very low of lead but will suffer increasingly bad symptoms if continually exposed to lead levels . The use of lead in plumbing bought many benefits for many centuries but in the long run we've come to realise it was a bad idea to release large quantities into our atmosphere and water supply. -
Chris G at 05:15 AM on 6 October 2010Carbon Dioxide - Everyone's Favorite Pollutant
Thanks Doug, that's just about exactly where I was going, only with more detail than I could summon out of my brain. Except, as I understand it, the metabolic processes of forams are pretty much physical chemistry. Ocean acidification is in the process of severely stressing ecosystems that are already under extreme duress through over-fishing, destruction of habitat, and other pollutants. The decline in every major fishery in the world is already a problem. As the oceans turn from an environment well suited for forams to one perhaps more suited to jellyfish, it's not clear what the hundreds of millions of people, who are currently dependent on the ocean as their major food source, will be eating. -
Ned at 05:01 AM on 6 October 2010It's freaking cold!
It's unfortunate that the graphs in this post are for the US only. In an attempt to find similar data for the world as a whole, I ran across the website of Maximiliano Herrera, who has compiled data on weather stations that set new high or low records every year since 2002. So far, in 2010 there have been 337 warm records versus 13 cool records. In 2009, the ratio was 80 (warm) to 15 (cool). In 2008, it was 40 (warm) to 18 (cool). In 2007, it was 133 (warm) to 9 (cool). And so on... It would be nice to find a more official or peer-reviewed analysis of this. ------------------------ (Moved from the other thread about impending ice ages, per the moderator's request) -
We're heading into an ice age
Redirecting extrema discussions to "It's freaking cold"... please see for comment.Moderator Response: Thank you!
Prev 2144 2145 2146 2147 2148 2149 2150 2151 2152 2153 2154 2155 2156 2157 2158 2159 Next


