


 Arguments


Recent Comments
Prev 2170 2171 2172 2173 2174 2175 2176 2177 2178 2179 2180 2181 2182 2183 2184 2185 Next
Comments 108851 to 108900:
-
Tom Dayton at 15:01 PM on 26 September 2010The Big Picture (2010 version)
cruzn246, you are incorrect in stating that "correlation does not mean causation." Correlation is necessary but not sufficient as evidence of causation. There are empirically-backed theoretical reasons for our prediction that CO2 levels will correlate with temperature. Those predictions were made long before it was even possible to adequately measure the global levels of either of those variables for sufficiently long to confidently detect that correlation. The correlation later was discovered to exist, thereby supporting the other empirical evidence and theory -
cruzn246 at 14:57 PM on 26 September 2010The Big Picture (2010 version)
"A strong, credible body of scientific evidence shows that climate change is occurring, is caused largely by human activities, and poses significant risks for a broad range of human and natural systems…. Some scientific conclusions or theories have been so thoroughly examined and tested, and supported by so many independent observations and results, that their likelihood of subsequently being found to be wrong is vanishingly small. Such conclusions and theories are then regarded as settled facts. This is the case for the conclusions that the Earth system is warming and that much of this warming is very likely due to human activities." I like how they covered their you know what here. "This is the case for the conclusions that the Earth system is warming and that much of this warming is very likely due to human activities." Very likely, but they are not certain. No doubt. -
Doug Mackie at 14:50 PM on 26 September 2010Does breathing contribute to CO2 buildup in the atmosphere?
I published this in Eos, the newspaper of the American Geophysical Union, in 2006. I was searching for a way to tell merkins that they emit too much. The article is severely constrained by space but the really essential point is that there are many nations that ‘emit’ more CO2 from their population breathing than they do from burning fossil fuels. The rationale for the article was a ‘helpful’ suggestion of a method for the US to further destabilise Kyoto (this was in 2006) by insisting that human respiration be included on the flimsy pretext that enteric methane is included. The idea (from the US pov) would be that China especially would have to pay a greater proportion of its GDP to buy credits than the US. Please, note the ‘department’ of Eos that this was published in before telling me that breathing does not release fossil CO2. -
cruzn246 at 14:49 PM on 26 September 2010The Big Picture (2010 version)
How about a quick synopsis of GHG, CO2 and AGW: 1. Increasing the level of a greenhouse gas in a planet’s atmosphere, all else being equal, will raise that planet’s surface temperature. Yep. 2. CO2 is a greenhouse gas. Yep 3. CO2 is rising. Yep 4. Therefore (given 1-3 above) the Earth should be warming. How much is a guess at best. 5. From multiple converging lines of evidence, we know the Earth is warming. No doubt 6. The warming is moving in close correlation with the carbon dioxide. Correlation does not mean causation. Science 101. 7. The new CO2 (as shown by its isotopic signature) is mainly from burning fossil fuels. Check 8. Therefore the global warming currently occurring is anthropogenic (caused by mankind). How much is still a guess. There is no good reason we should not be warming now. We are still interglacial and still recovering from a relative low point, the "Little Ice age", in an interglacial cycle. These are the warmest temperatures lately, but not the warmest of the Holocene. We got warmer than this during the last interglacial also. muoncounter I checked the Quaternary map. It is better than the one I had. It still works for a reshaped FL that could screw up the Gulf Stream and trigger rapid cooling. If not the gulf stream than I suspect some other ocean current gets rearranged. I think that this is the trigger for ice ages. There is no way the Milankovich cycles could have that sudden an impact as what we get when we go icy.Moderator Response: See the post (and comment further there, not here) We’re coming out of the Little Ice Age. -
muoncounter at 14:22 PM on 26 September 2010The Big Picture (2010 version)
#95: "If you understood the connection to sea levels and ice ages" Again, what is the significance of this remark? Ice ages cause sea level to drop. But this is not about ice ages; its about causes of climate change. In today's world. BTW, your map in #97 appears to be one of the 125ka highstand. It's lovely, but no geologist on earth would put the land area in blue. Please cite your source. And check Quaternary sea-level history of the United States; it'll help you get the chronology correct. -
dana1981 at 14:10 PM on 26 September 2010Breathing contributes to CO2 buildup
Bit of an odd looking cow! -
Daniel Bailey at 13:50 PM on 26 September 2010The Big Picture (2010 version)
Re: cruzn246 (94)"I'm almost from Missouri. show where you get this from."
Ok, where shall we start? How about a quick synopsis of GHG, CO2 and AGW:1. Increasing the level of a greenhouse gas in a planet’s atmosphere, all else being equal, will raise that planet’s surface temperature. 2. CO2 is a greenhouse gas. 3. CO2 is rising. 4. Therefore (given 1-3 above) the Earth should be warming. 5. From multiple converging lines of evidence, we know the Earth is warming. 6. The warming is moving in close correlation with the carbon dioxide. 7. The new CO2 (as shown by its isotopic signature) is mainly from burning fossil fuels. 8. Therefore the global warming currently occurring is anthropogenic (caused by mankind).
How about a complete guide to modern day climate change? Or an illustrated guide to the latest climate science? How about every scientific body in the world endorsing the science of global warming/climate disruption (use the term of your choice), as summarized by the National Academy of Science in May of this year:"A strong, credible body of scientific evidence shows that climate change is occurring, is caused largely by human activities, and poses significant risks for a broad range of human and natural systems…. Some scientific conclusions or theories have been so thoroughly examined and tested, and supported by so many independent observations and results, that their likelihood of subsequently being found to be wrong is vanishingly small. Such conclusions and theories are then regarded as settled facts. This is the case for the conclusions that the Earth system is warming and that much of this warming is very likely due to human activities."
Have you seen enough? Re: cruzn246 (97) And by presenting no mechanism to support your opinion, you amply demonstrate that you simply have no idea about what you are talking about. You are merely "hypothesizing" (the supposition that this is similar to pulling small primates out of dark places is completely unrelated). The Yooper -
Doug Bostrom at 13:44 PM on 26 September 2010A visual deconstruction of a skeptic argument
PerkyIsPsychic, using your wood example, here we're doing the equivalent of digging up a prodigious amount of wood stored away over eons, swiftly burning it in the space of a few decades. The comparatively tiny amount of wood cycling its carbon on the surface today does not really count for much in the face of the fossil hydrocarbon extraction and combustion scene. (Is that "Reverend Perkyl" by any chance? I had a college roommate who enjoyed playing old records of Reverend Perkyl's sermons at top volume. A mind-bending experience.) -
cruzn246 at 13:43 PM on 26 September 2010The Big Picture (2010 version)
Re: cruzn246 (95) "If you understood the connection to sea levels and ice ages you would get it." "Insofar as you have presented no evidence to support your opinion, and stand in direct juxtaposition to more than a century of scientific research, it can be safely concluded that it is YOU who do not get it." Oh cripes. It is a well known fact that sea levels were much higher at the end of the last interglacial and temperatures were higher also. The sea level connection to ice ages is simply this. If you bring sea levels up to the level that they reached at the end of the last interglacial you could effectively shut down the Gulf Stream. That would be what you all call a tipping point. This is how high the water was in FL at the end of the last interglacial. the blue area is what was not under water.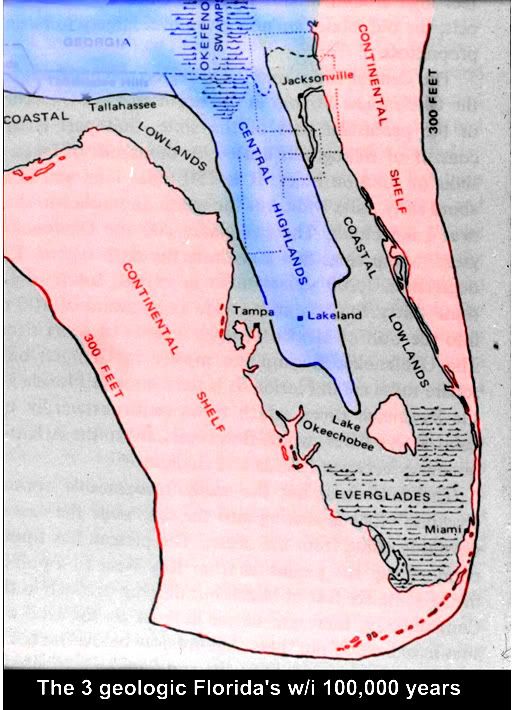 Moderator Response: Try the What does past climate change tell us about global warming? thread, or The significance of past climate change, or Working out future sea level rise from the past.
 -
muoncounter at 13:39 PM on 26 September 2010It's the sun
619: "lower magnetic field, less shielding from galactic cosmic rays, more low-level clouds, lower average cloud altitude, warmer average cloud temperature," The supposed link between galactic cosmic rays is discussed here.Moderator Response: cruzn246, that is one of those cues to continue discussion of that topic on that other thread. Further comments on this thread will be deleted without warning. -
PerkyIsPsychic at 13:29 PM on 26 September 2010A visual deconstruction of a skeptic argument
a la: John Russell's logic Melting an ice cube makes water but it doesn't place more water on Earth than was here before the water froze. Burning a stick of wood makes co2 but it doesn't place more co2 on Earth than was here before the co2 became a stick of wood. -
Daniel Bailey at 13:13 PM on 26 September 2010The Big Picture (2010 version)
Re: cruzn246 (95)"If you understood the connection to sea levels and ice ages you would get it."
Insofar as you have presented no evidence to support your opinion, and stand in direct juxtaposition to more than a century of scientific research, it can be safely concluded that it is YOU who do not get it. Capiche? The Yooper -
cruzn246 at 12:43 PM on 26 September 2010The Big Picture (2010 version)
"That is why we are still in a warm period and not cooling off yet." ??? We are still(?) in a warm period because sea levels were higher at the end of the last interglacial? Does that make any sense to anyone? If you understood the connection to sea levels and ice ages you would get it. -
Roger A. Wehage at 11:38 AM on 26 September 2010Climate Change: The 40 Year Delay Between Cause and Effect
Can we put this theory to test? See Introduction into energy sources for a graph of energy consumption. And see Global Warming Facts, Data & Statistics for a graph of global temperature departures.
 Energy consumption was erratic between 1910-1950, with a gradual upward trend. Temperature swings between 1950-1990 were also erratic with a general upward trend. From 1950 on, energy consumption has been increasing at a nearly uniform rate until 1990. The rate of increase started declining after 1990. From 1990 on, global temperatures have been increasing at a nearly uniform rate.
Only time will tell what happens in the next 40 years, considering that energy consumption is still increasing. And we must not forget that the methane gas factor may enter the picture after global temperatures have risen above a certain level. When or if CH4 reaches 6 ppm, with its additional CO2 byproduct, global temperatures could rise even faster than predicted by energy consumption alone.
Energy consumption was erratic between 1910-1950, with a gradual upward trend. Temperature swings between 1950-1990 were also erratic with a general upward trend. From 1950 on, energy consumption has been increasing at a nearly uniform rate until 1990. The rate of increase started declining after 1990. From 1990 on, global temperatures have been increasing at a nearly uniform rate.
Only time will tell what happens in the next 40 years, considering that energy consumption is still increasing. And we must not forget that the methane gas factor may enter the picture after global temperatures have risen above a certain level. When or if CH4 reaches 6 ppm, with its additional CO2 byproduct, global temperatures could rise even faster than predicted by energy consumption alone.
-
Dan Pangburn at 11:35 AM on 26 September 2010It's the sun
Climate Scientists who limit their consideration of the influence of the sun on earth’s climate to TSI overlook a far more significant factor which is the influence of solar magnetic fields, as indicated by the proxy of sunspot number time-integral. Fewer sunspots means lower magnetic field, less shielding from galactic cosmic rays, more low-level clouds, lower average cloud altitude, warmer average cloud temperature, more radiation from the planet and thus a cooling planet. An equation based on the first law of thermodynamics that includes the sunspot time-integral, effective sea surface temperature (ESST) and atmospheric carbon dioxide level accurately calculates all average global temperatures since 1895 with a coefficient of determination of 0.88. -
MattJ at 11:05 AM on 26 September 2010Climate Change: The 40 Year Delay Between Cause and Effect
The article provides good coverage of how CO2 causes heating, but unfortunately, it does nto actually address the fallacies 'skeptics' usually rely on for disbelieving that there is a greenhouse effect. Less time on unconstested physics and more rebuttal of the current memes would be a good idea. -
archiesteel at 10:43 AM on 26 September 2010Water vapor is the most powerful greenhouse gas
@cruzn246: " The PDO and NAO basically put a stop on a warming trend from about the late 40s through the late 70s." No, it didn't. The cooling mid-century was due mostly to aerosols. Why did climate cool in the mid-20th Century? Of course, now that you've been shown wrong on WV, you're going to try to change the subject yet again. That's a textbook denier tactic, and I'm not falling for it. "You can quit insulting me any time you like." Stop making false statements and I'll stop calling you on them. Start listening and learning and I'll be there to help you. "I have an IQ in about the 135 range and have been around for a few more years than you, I'm sure." Not that IQ really measures anything else but the ability to answer IQ tests, but my own scores vary between 146 and 154 ("ordinary" IQ tests aren't too precise in that range). I'm also 40 years old, but that's completely irrelevant to the fact that you haven't been able to present a compelling argument to make your case. I'll also note that English is not my first language, and yet I seem to make much less typos and grammatical errors. Perhaps you should be less emotional about this and take it as an opportunity to learn. "I know what i am talking about but you see things in only your frame of refernece. I can't help you there." I disagree. I think it's clear from your various errors and misuse of graphs that you have *no* idea what you're talking about, and we won't be able to help you with that until you first admit it.Moderator Response: Comments by anyone, about PDO, will be deleted from this thread. -
Doug Bostrom at 10:35 AM on 26 September 2010Water vapor is the most powerful greenhouse gas
What "wins" in the long run, an oscillation or a secular trend?Moderator Response: For discussion relating climate change to the PDO, please use the It's Pacific Decadal Oscillation thread. -
cruzn246 at 10:29 AM on 26 September 2010The Big Picture (2010 version)
"Actually, no, they haven't. Temperature now are way above the holocene mean, and higher than any average temperatures since the last glaciation." I'm almost from Missouri. show where you get this from. -
archiesteel at 10:00 AM on 26 September 2010The Big Picture (2010 version)
@muoncounter: "Does that make any sense to anyone?" No, it doesn't, and it seems the further we go the more shrill cruzn246 is becoming. I think he's starting to realize he's really in over his head with his limited scientific knowledge. He's beginning to break down, making less and less sense as counter-arguments pile up against his house of cards. The next logical step for would likely be to start making strawman aguments and ad hominem attacks. -
muoncounter at 09:58 AM on 26 September 2010CO2 measurements are suspect
#43: The 2003 Schmidt paper was about 30 years of CO2 data at Schauinsland. Graph from WDCGG (not from the paper) shown below:It appears that the seasonal amplitude has indeed decreased since the late 70s. I don't see any decadal cycles, unless you mean the 4 decades of continuous increase in the annual average.
-
archiesteel at 09:56 AM on 26 September 2010Water vapor is the most powerful greenhouse gas
@cruzn246: wow, you're really goign through the gamut of debunked arguments, aren't you. What's next, it's because of Solar Irradiance? The PDO is currently *negative*, why would it warm us? It's also a cyclical phenomenon that doesn't show a long-term trend, which we are experiencing. "Good enough?" Not by a long shot. It's Pacific Decadal Oscillation Instead of randomly posting graphs you clearly don't understand, I suggest you actually start learning some science. Again, it's clear you have no idea what you're talking about, and are simply trolling on this site. -
muoncounter at 09:51 AM on 26 September 2010The Big Picture (2010 version)
#86: "we are at the highest CO2 rates in the last 50.000 years. Not even close to the highest temperatures. So what am I supposed to think?" Think: Temperatures will go higher. See, not that hard. "Sea levels were a heck of a lot higher than they are now. There was also a lot less ice. " References for that? "That is why we are still in a warm period and not cooling off yet." ??? We are still(?) in a warm period because sea levels were higher at the end of the last interglacial? Does that make any sense to anyone? -
archiesteel at 09:51 AM on 26 September 2010The Big Picture (2010 version)
@cruzn246: I don't know why I'm wasting my time debating with a fanatic, but here goes: "They are at the high end? They are near a middle value for the period of the Holocene. They have been nearly 2C warmer than this in the Holocene." Actually, no, they haven't. Temperature now are way above the holocene mean, and higher than any average temperatures since the last glaciation. "Funny how it takes so long to get feedback from CO2. with water vapor the feedback is nearly immediate." Please learn what "feedback" means. -
cruzn246 at 09:42 AM on 26 September 2010Water vapor is the most powerful greenhouse gas
"Please provide evidence of such an unknown climate shift. Put up or shut up." The shift of the PDO and NAO at about the same time in the late mid 70s put us into this warm spell.
 Good enough?
There are signs they both may go negative again at the same time and that could put us right back into the type of weather we had in the middle of the century.
Good enough?
There are signs they both may go negative again at the same time and that could put us right back into the type of weather we had in the middle of the century.
-
cruzn246 at 09:25 AM on 26 September 2010The Big Picture (2010 version)
"@cruzn246: temperatures are at the high end of the last 450,000 years, as well, though it will take a couple of decades until we get the full effect of anthropogenic CO2. So, the reality is that temperatures are at the highest and ice cover is at the lowest since the last glacial period, even though the climate optimum was a couple of thousand years ago. In other words, you have *no* idea what you're talking about. I suggest you refrain from making any more fallacious comment and thus avoid embarrassing yourself any further." They are at the high end? They are near a middle value for the period of the Holocene. They have been nearly 2C warmer than this in the Holocene. Temperatures during the Holocene have been above this level numerous times and dropped back again. The temperature has been bouncing around in a roughly 4C range for the last 10,000 years. The previous 4 interglacial periods all ended with temps at least 2C warmer than we are now. Ice volumes are not as low as they were prior to the last glaciation. Funny how it takes so long to get feedback from CO2. with water vapor the feedback is nearly immediate. Sure you can say high end but they are not at their warmest by any means. -
archiesteel at 09:06 AM on 26 September 2010Water vapor is the most powerful greenhouse gas
In a different thread, cruzn246 made this claim relating to Water Vapor concentration (after I stated it represented about 0.4% of the atmosphere): "Actually this is wrong. It ranges from 1 to 4% with the average being between 2 and 3%" Those figure are for surface value. In the entire atmosphere it's 0.4%. "but no one is really sure what that average is on any given day." True, but irrelevant. The water is already part of the weather system, contrary to fossil fuel CO2 which is being added to the atmosphere. "According to NASA, they say the increase in water vapor is probably playing a bigger part in warming now than CO2, but they will not put numbers on either as far as the amount each is contributing." Water Vapor acts as a positive feedback to CO2-caused warming. It has a bigger impact on GW than CO2, but we are not adding new water to the system. We are adding more CO2, which increases the heat, which causes more water to evaporate, which further raises temperature. We all know this. Why do you come here on your high horse and tell us things that we already know as if you had the "killer argument" against AGW? All you're doing is highlighting your own ignorance for all to see. "The difference in an atmosphere with a strong water vapor feedback and one with a weak feedback is enormous," Dessler said." Note the use of the word "feedback." Basically, this articles agrees with the science presented here, and disagrees with you. I know it's common for less experienced deniers to mistakenly provide evidence that goes against their position, but this one's pretty obvious... "I think all you need is a simple climate shift that has nothing to do with CO2 to put more water vapor in the air." Please provide evidence of such an unknown climate shift. Put up or shut up. -
John Hartz at 09:06 AM on 26 September 2010Billions of Blow Dryers: Some Missing Heat Returns to Haunt Us
@Daniel Bailey & muoncounter: n. (Abbr. J or j) 1.The International System unit of electrical, mechanical, and thermal energy. 2.a. A unit of electrical energy equal to the work done when a current of one ampere is passed through a resistance of one ohm for one second. 2.b. A unit of energy equal to the work done when a force of one newton acts through a distance of one meter. [After James Prescott JOULE.] Per Answer.com -
archiesteel at 08:59 AM on 26 September 2010The Big Picture (2010 version)
I'm responding to your erroneous Water Vapour claims on the correct thread. -
John Hartz at 08:58 AM on 26 September 2010Billions of Blow Dryers: Some Missing Heat Returns to Haunt Us
@ Daniel Bailey & muoncounter: Thanks for chiming in. I knew the basics. I still do not understand why this article uses Watts/m-2 and the Pielke article uses Joules. Perhaps I am missing something, but it seems to me that any measure of the heat content of the ocean must be done by volume. Watts/m-2 seems related to area only. -
cruzn246 at 08:56 AM on 26 September 2010The Big Picture (2010 version)
"Actually, water vapor represents about 0.4% of the atmosphere." Actually this is wrong. It ranges from 1 to 4% with the average being between 2 and 3%, but no one is really sure what that average is on any given day. According to NASA, they say the increase in water vapor is probably playing a bigger part in warming now than CO2, but they will not put numbers on either as far as the amount each is contributing. Water Vapor Confirmed as Major Player in Climate Change http://www.nasa.gov/topics/earth/features/vapor_warming.html Here is a quote from their article. "The difference in an atmosphere with a strong water vapor feedback and one with a weak feedback is enormous," Dessler said. They are just starting to get a handle on water vapor feedback. My prediction is that in ten years they will see it as an even more important player in warming. I think all you need is a simple climate shift that has nothing to do with CO2 to put more water vapor in the air. You melt more ice, that means more water, that means less reflection , albedo, and you have a warmer more humid earth without adding any CO2. Does CO2 add to this? Sure, but I really think it's piece is grossly overestimated. -
archiesteel at 08:54 AM on 26 September 2010The Big Picture (2010 version)
@cruzn246: temperatures are at the high end of the last 450,000 years, as well, though it will take a couple of decades until we get the full effect of anthropogenic CO2. So, the reality is that temperatures are at the highest and ice cover is at the lowest since the last glacial period, even though the climate optimum was a couple of thousand years ago. In other words, you have *no* idea what you're talking about. I suggest you refrain from making any more fallacious comment and thus avoid embarrassing yourself any further. -
cruzn246 at 08:25 AM on 26 September 2010The Big Picture (2010 version)
"Answer: Now we're at 390ppm, which would put the green line off the top of the chart. That didn't happen before on this time scale (you asked for glacial/interglacials only). Still believe its all happened before? And exactly when is this ice age of yours going to happen?" Great, we are at the highest CO2 rates in the last 450.000 years. Not even close to the highest temperatures. So what am I supposed to think? I know one thing about the end of the last interglacial. Sea levels were a heck of a lot higher than they are now. There was also a lot less ice. That is why we are still in a warm period and not cooling off yet. -
johnd at 08:03 AM on 26 September 2010CO2 measurements are suspect
muoncounter at 04:49 AM, the annual variations depend on the degree of difference between the seasons when plant growth slows or becomes dormant and the season when it is most vigorous. In the case of the Schmidt report which I have only read the abstract of, and hence do not know what the actual seasonal conditions were, were they a period of predominately drought or wet years, nor the actual ppm readings, it is impossible to say whether that the natural processes respond more the higher the CO2 concentration, or were responding to changing seasonal conditions due to decadal long natural cycles. -
muoncounter at 07:53 AM on 26 September 2010Billions of Blow Dryers: Some Missing Heat Returns to Haunt Us
Yooper, Joules is a measure of energy in the SI system. Watts are Joules per second, the measure of power consumption (think 100 watt light bulb). Watt/m^2 is a measure of energy per unit time spread out over an area. In this context, that is often called flux. Thus 100 Watts/m^2 represents the power consumption of a 100 watt bulb spread out on a surface area of one square meter. -
Daniel Bailey at 07:32 AM on 26 September 2010Billions of Blow Dryers: Some Missing Heat Returns to Haunt Us
Re: Badgersouth (28) My understanding is that Joules is a measure of power per unit time, while W m-2 is used to describe units of solar irradiance (the energy falling on a unit area over a unit time). Not quite the same thing. Try here. Looks like it might be what you want. But then, maybe nobody knows... The Yooper -
John Hartz at 06:58 AM on 26 September 2010Billions of Blow Dryers: Some Missing Heat Returns to Haunt Us
HELP! In this posting and commnet thread, ocean heat content is expressed in W m–2. In the posting and comment thread re Dr. Roger Pielke and the "missing heat", ocean heat content is expressed in Joules. Why the use of two different measures? What's the crosswalk between "W m-2" and "Joules." -
muoncounter at 06:26 AM on 26 September 2010The Big Picture (2010 version)
#77:"Of course I believe it's warming. ... I think our break from that kind of weather is about to end." So you do believe in warming, but you also believe its all natural? Happened before, will happen again, nbd. At the risk of repeating an oft-seen graphic: Let's see if we can spot the difference between today and previous episodes.
Hint: CO2 is the middle graph, note vertical scale on the right. Left-most point on that graph (the most recent) just peaks over 280ppm, which looks like the prior warm episodes.
Answer: Now we're at 390ppm, which would put the green line off the top of the chart. That didn't happen before on this time scale (you asked for glacial/interglacials only).
Still believe its all happened before? And exactly when is this ice age of yours going to happen?
Let's see if we can spot the difference between today and previous episodes.
Hint: CO2 is the middle graph, note vertical scale on the right. Left-most point on that graph (the most recent) just peaks over 280ppm, which looks like the prior warm episodes.
Answer: Now we're at 390ppm, which would put the green line off the top of the chart. That didn't happen before on this time scale (you asked for glacial/interglacials only).
Still believe its all happened before? And exactly when is this ice age of yours going to happen?
-
Daniel Bailey at 06:25 AM on 26 September 2010The Big Picture (2010 version)
Re: cruzn246 (84) Magic 8-ball says 12,900 cubic kilometers in the air; or a bit more than the volume of Lake Superior (12,000 cubic kilometers). For extra credit, the 4% increase in atmospheric water vapor since 1970 due to the higher temperatures is about equal to the volume of Lake Erie. In case you had an enquiring mind. The (Il mio nome è Nessuno) YooperModerator Response: Further discussion of water vapor needs to be on the thread Water vapor is the most powerful greenhouse gas. -
archiesteel at 06:19 AM on 26 September 2010The Big Picture (2010 version)
@cruzn246: "Well debunkerson, tell me what the total world concentration of water vapor is today. Oh, you don't know? No, nobody can answer that question" Actually, water vapor represents about 0.4% of the atmosphere. Again, don't gauge what science knows based on your own ignorance.Moderator Response: Further discussion of water vapor needs to be on the thread Water vapor is the most powerful greenhouse gas. -
archiesteel at 06:13 AM on 26 September 2010The Big Picture (2010 version)
@cruzn246: "Well cripes man, it's amazing you have any doubters here with the way some of you treat someone who says no." You don't just come here to say no, you come here repeat debunk denier arguments and refuse to respond to actual counter-arguments with scientific evidence. What's more, you use a very aggressive tone and denigrate the fine scientists who have produced a mountain of research supporting AGW. You are not interested in learning the truth, but only want to be comforted in your non-scientific opinion. "We just had a record summer for highest average low temperatures in my area." What's a "high average low temperature"? I guess you're trying to say you've had "record low temperatures" in your area, is that it? Well, the fact it was cold in your area doesn't mean anything, especially when you agree that we are warming. "You know, that greenhouse gas no one mentions" If you're talking about Water Vapor, it is mentioned all the time. In fact, it was mentioned quite a few times in this thread alone, proving your wrong. You seem to have a problem formulating a logically sound argument. Perhaps you should learn a bit more about the science before trying to argue with people who understanding better than you do? -
cruzn246 at 06:09 AM on 26 September 2010The Big Picture (2010 version)
"I'd explain why this is nonsense, but it obviously wouldn't make any difference. Enjoy your fantasy world where long term increased atmospheric water vapor is both the cause AND effect of temperature increases." Well debunkerson, tell me what the total world concentration of water vapor is today. Oh, you don't know? No, nobody can answer that question, but you all think we know exactly how this whole atmosphere works. How the heck can we know when we can't put a reliable figure on such a crucial component? You can't.Moderator Response: Further discussion of water vapor needs to be on the thread Water vapor is the most powerful greenhouse gas. -
CBDunkerson at 05:50 AM on 26 September 2010The Big Picture (2010 version)
cruzn246, so your statement that CO2 rises never proceed temperature rises was... false, but we should ignore that and concentrate ONLY on a relatively recent period of glacial cycles during which there have been no sudden profound increases in CO2... except for the current human driven one. Which we should also ignore. Yes, once we blinder ourselves to all evidence to the contrary your position only looks slightly ridiculous. Unfortunately you then go and ruin it with; "There was also a huge spike in water vapor being outgassed in those eras. That is why they called those hot periods back then warm and humid. It's not like CO2 was the only thing going way up." I'd explain why this is nonsense, but it obviously wouldn't make any difference. Enjoy your fantasy world where long term increased atmospheric water vapor is both the cause AND effect of temperature increases. -
cruzn246 at 05:49 AM on 26 September 2010The Big Picture (2010 version)
We just had a record summer for highest average low temperatures in my area. Guess why. Yep, we had the highest average dewpoints for the summer also. You know, that greenhouse gas no one mentions. -
cruzn246 at 05:38 AM on 26 September 2010The Big Picture (2010 version)
"There ARE cases where temperature peaked after CO2 did. For instance... now, various flood basalt incidents, the snowball Earth scenario ~650 million years ago, et cetera." There was also a huge spike in water vapor being outgassed in those eras. That is why they called those hot periods back then warm and humid. It's not like CO2 was the only thing going way up.
-
cruzn246 at 05:29 AM on 26 September 2010The Big Picture (2010 version)
"-2C in a century is free-fall and the current global +0.13C per decade (that's 1.3C per century) -- and more for the NH isn't a warmup you can believe in? " That's 1.3 per Century if it lasts a century. Don't confuse rate with actual amount. It's gone up about 1C in the last 100 years. That kind of change has happened before. Of course I believe it's warming. I am alive. I was also alive in the 70s. Thank God it's mot like that anymore, although I think our break from that kind of weather is about to end. -
cruzn246 at 05:11 AM on 26 September 2010The Big Picture (2010 version)
"There ARE cases where temperature peaked after CO2 did. For instance... now, various flood basalt incidents, the snowball Earth scenario ~650 million years ago, et cetera." These temps are not in any kind of peak now. They are just warm for the last 500 years. If they keep rising nonstop the next couple hundred years maybe. The flood basalt incidents were in a completely different type of earth climate. Snowball earth, another different climate. Things were so different 500,000,000 years ago, including continental placement, that comparing to those times is like comparing to another world. Our whole atmosphere was different. Let's try to keep this in the interglacial periods please. -
muoncounter at 04:55 AM on 26 September 2010The Big Picture (2010 version)
#72: "They will almost be in a free-fall. I would bet changes on the order of 2C in a century over the N hemisphere would happen easily." -2C in a century is free-fall and the current global +0.13C per decade (that's 1.3C per century) -- and more for the NH isn't a warmup you can believe in? -
ProfMandia at 04:50 AM on 26 September 2010The Phony War: Lies, Damn Lies and the IPCC
Despite strong political reasons for them not to endorse, the following countries endorsed the IPCC 2007 reports because the science was undeniable: United States of America - Fossil fuel-based economy, strong lobby efforts opposed to regulating fossil fuel emissions Saudi Arabia - World's largest producer/exporter of oil China - Rapidly industrializing using coal-fired power plants India - Rapidly industrializing using coal-fired power plants The IPCC WGI Report (2007) concluded: “Most of the observed increase in globally averaged temperatures since the mid-20th century is very likely due to the observed increase in anthropogenic greenhouse gas concentrations.” 130 countries endorsed the reports, and since 2007, no scientific body of national or international standing has maintained a dissenting opinion. Politics? Hardly. -
muoncounter at 04:49 AM on 26 September 2010CO2 measurements are suspect
Following Tom D.'s use of the thread-shifting rule, this is a reply to johnd's comment on The Big Picture thread: "Interestingly even when the stations are located in heavily industrialised regions the same seasonal variation still occurs" The magnitude of seasonal variation is hardly the same at all locations. Equatorial and southern hemisphere locations have much smaller seasonal swings. High northern latitude locations have much larger seasonal differences. Heavily industrial areas (like those downwind of power plants) have the largest annual amplitudes -- and tend to have higher annual average concentrations as well. The only thing that is more or less consistent is the rate of increase from year to year, which has crept up from 1 to >2 ppm/year over the 50 years of modern records. Oddly enough, in areas with stringent pollution controls, the annual amplitude may decrease, as reported by Schmidt et al. 2003 in a study of 30 years of CO2 records in Germany: The average seasonal cycle (peak to peak) amplitude has decreased slightly from 13.8 ± 0.6 ppm in the first decade (1972–1981) to 12.8 ± 0.7 ppm in the last two decades (1982–2001). Not too much of a decrease. But it is becoming clear that not only do we add CO2 to the atmosphere by burning fossil fuels, we can modify the annual variation in its concentration. Aren't those what we call anthropogenic effect?
Prev 2170 2171 2172 2173 2174 2175 2176 2177 2178 2179 2180 2181 2182 2183 2184 2185 Next


