


 Arguments


Recent Comments
Prev 2178 2179 2180 2181 2182 2183 2184 2185 2186 2187 2188 2189 2190 2191 2192 2193 Next
Comments 109251 to 109300:
-
CoalGeologist at 07:53 AM on 22 September 2010The contradictory nature of global warming skepticism
It's likely we've taken this subject as far as we can, but it's worth noting that Mr. Baz's intractable position on climate change, impervious to evidence and reasoning, and by his own admission built upon a foundation of mistrust for the scientific establishment, is very suggestive of what I was alluding to back in Post #54. I must respectfully disagree with Ned. I feel it's quite relevant and significant that Mr. Baz's views are representative of a very large number of our fellow Americans, who feel that common "street learnin' " trumps a Ph.D. degree any day of the week. (It's all the more painful to me when my own colleagues feel this way!) This has much more serious implications than just a bar room argument over whether you'd rather be able to fly or breathe under water. Mr. Baz and his friends vote; so it's not as if their opinions don't affect the lives of people throughout the world. I do, however, appreciate his candor, which as he justly claims is quite uncommon. -
Rob Honeycutt at 07:47 AM on 22 September 2010Climate scientists respond to Monckton's misinformation
Actually, The Ville, I don't think Monckton takes well to criticism. Do you remember the outrageous responses he made to Dr Abraham's presentation? The least of which was calling him a "boiled prawn." That was one professor from a small college. This is 21 climate scientists with considerable reputations to back up their assertions. Monckton will surely take this as a frontal attack on his reputation. Expect a number of Fox News interviews to follow shortly. Who's making the popcorn? -
Paul D at 07:31 AM on 22 September 2010Climate scientists respond to Monckton's misinformation
Alexandre@8: "I hope this is the first of a long row of public statements from climate scientists." Oh I hope not. They waste enough time already rebutting Monckton. That's just what he wants. Lets move on and improve the real science. -
Rob Honeycutt at 07:17 AM on 22 September 2010Climate scientists respond to Monckton's misinformation
This is fantastic. It's great these scientists have taken time from their busy lives to do this. It's so incredibly important. I watched a video clip the other day of Monckton debating a climate scientist in AU on some news program (not sure which one now). It was fascinating. Once the climate scientist started to point out his inaccuracies Monckton reverted to talking over everything that anyone said including the interviewer. Almost meaningless and rambling stuff barely related to the issue. He really seems to be genuinely driven by paranoia of a global neo-nazi conspiracy where science is somehow at the center of it all. I'm sure that's now he will receive this report. -
Albatross at 06:45 AM on 22 September 2010A detailed look at Hansen's 1988 projections
Archiesteel @55, You just stated what I was thinking of saying, but more eloquently and succinctly than I am capable of. Earlier I suggested including the rate of warming for the 1984-2009 window for Scenario C, but in retrospect it is pointless comparing observations with Scenario C much beyond 2000 b/c the emissions (i.e., GHG forcing) for Scenario C after 2000 are not realistic. I suspect that is the reason why Schmidt and Dana did not include it in their analyses which extend almost a decade beyond 2000. Hansen et al. included Scenario C in their validation up until 2005, and that, IMHO, was probably pushing it. Anyhow, FWIW, you are getting it right :) -
SouthWing at 06:44 AM on 22 September 2010Climate scientists respond to Monckton's misinformation
@1 Anne-Marie Blackburn I will never understand why Monckton was allowed to testify to the US Congress since it's been clear for some time that he doesn't know what he's talking about.
Then, alas, you will never understand the sheer venality of American politics. It matters not a bit to his Republican denier sponsors that Monckton is a mendacious blowhard; he says the things they want to hear, so he is given a pulpit. -
archiesteel at 06:36 AM on 22 September 2010A detailed look at Hansen's 1988 projections
@Angusmap: "It is evident from Figure 1 that the best fit for actual temperature measurements is currently the emissions-held-at-year-2000-level Scenario C. Therefore it is incorrect for Dana1981 to contend that temperaturea are currently following a trajectory slightly below Scenarion B." As I understand it, the question is not whether the actual record is closer to B or C, because we know real-world emissions are closer to emmission scenario B. Thus accuracy of the model has to be gauged in relation to scenario B. Had emmissions been closer to C, then we'd be comparing the record with C, and would find Hansen 1998 had been amazingly accurate! :-) Am I getting this right? -
archiesteel at 06:29 AM on 22 September 2010A detailed look at Hansen's 1988 projections
@NETDR: "The Pat Michaels analysis is a straw-man defense." I'm not sure you know what a strawman argument is. What Albatross (not CBD) said certainly wasn't a strawman; for that, he would have had to ascribe to you an opinion that wasn't yours. "Dr Hansen's model was seriously wrong but not as seriously as Pat said. So what?" There is such a thing as "a little wrong", "seriously wrong" and "completely wrong" in science. You seem to believe that it's a binary condition, i.e. one is either wrong or right. Unfortunately, reality doesn't like such absolutes. "For this we are seriously discussing tens of trillions of dollars of taxes and cap and trade ?" Careful, your bias is showing. An important fact for you to consider: if you agree with the analysis that shows Hansen was off on climate sensitivity by 0.8C for his choice of a 4.2C value, this means you *do* agree with a figure of about 3.4C for climate sensitivity. Let me put it another way: either you agree that climate sensitivity is about 3.4C, or you don't believe this critique of Hansen 1988 is accurate, and thus can't use it this particular evidence to support your affirmation that Hansen got it wrong. So, before we go any further, do you agree with the 3.4 figure for climate sensitivity? "So this article has proven he was wrong [in 88] and claimed it was a rebuttal to those that claim he was wrong. [in 88] Am I missing something ???" Yes, you are, but your use of multiple interrogation point and apparent obsession for boolean certainty in science make me wary of continuing this dialogue. @Joe Blog: "But the Q is, did Hansen 88 accurately model climate since its hindcast... the answer is no." Another, equally valid answer, would be that he answered it more accurately than others at the time. It's important to note that Hansen later acknowledged the differences, as this article does. The topic here is how contrarians have used the inaccuracy as an excuse to grossly underestimate climate sensitivity. That's the whole point of the article, unless I'm mistaken. -
Climate scientists respond to Monckton's misinformation
Note the last sentence on the cover page: "We encourage the U.S. Congress to give careful consideration to the implications this document has for the care that should be exercised in choosing expert witnesses to inform the legislative process". The US scientists present at the hearing must have profoundly embarrassed that their Congress had invited what amounts to a "climate quack" to give testimony. It would be like inviting a homeopathic practitioner to testify at a hearing on healthcare. -
tobyjoyce at 05:05 AM on 22 September 2010Climate scientists respond to Monckton's misinformation
I note a careful "dissing" of the egregious Lord. He is generally referred to as "Monckton" without the title. I hope the US politicians get the subtle message that they should be talking about science to scientists, not publicists. -
BillWalker at 05:03 AM on 22 September 2010Climate scientists respond to Monckton's misinformation
I hope they're sending a copy of this to every member of Congress. -
Albatross at 04:45 AM on 22 September 2010A detailed look at Hansen's 1988 projections
Angusmac, Nice graph. You use your Fig. 1 (which is what I assume to be an accurate replication of Fig. 2 in Hansen et al. (2006)) to make the assetion that: "It is evident from Figure 1 [after Hansen. 2006] that the best fit for actual temperature measurements is currently the emissions-held-at-year-2000-level Scenario C". Let us have a look at Hansen et al. (2006). They state that: "Modeled 1988–2005 temperature changes are 0.59, 0.33, and 0.40°C, respectively, for scenarios A, B, and C. Observed temperature change is 0.32°C and 0.36°C for the land–ocean index and meteorological station analyses, respectively. Warming rates in the model are 0.35, 0.19, and 0.24°C per decade for scenarios A, B. and C, and 0.19 and 0.21°C per decade for the observational analyses." Now either Hansen et al. made a mistake and inadvertently swapped the warming rates for scenario B and C, or your claim (cited above) which is based on your Figure 1 is false. Because the warming rate for scenario B of +0.19 C is the same as the observed rate of warming in the LOTI data. You state that Now there is an important caveat here of course, the data in Hansen et al. (2006) are for a different time window considered by Schmidt (2009). I do agree that it would be helpful if the predicted rate of warming for 1984-2009 for Scenario C could be included in Fig. 3 in the post. It is evident that the time windows chosen to validate the projections yield different answers. But, even so, the claims made by Crichton and others are incorrect and misleading. Hansen et al. (2006) also conclude that: "Nevertheless, it is apparent that the first transient climate simulations (12) proved to be quite accurate, certainly not ‘‘wrong by 300%’’ (14)" -
angusmac at 04:18 AM on 22 September 2010A detailed look at Hansen's 1988 projections
#43 Albatross, you are correct that Pat Michaels misled Senate but so has Dana1981 in this post. The NASA GISS data up to August 2010 are shown in Figure 1. They are compared with Scenarios A, B and C in Hansen (2006). The blue line denotes the Land-Ocean Temperature Index (LOTI).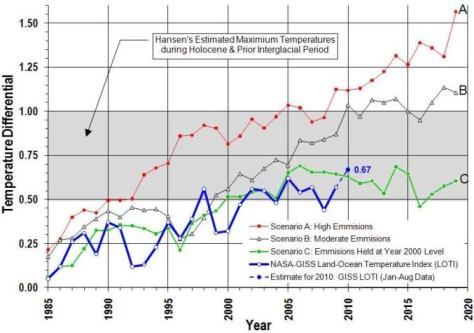 Figure 1: Scenarios A, B and C Compared with Measured NASA GISS LOTI (after Hansen, 2006)
I have used the LOTI data in Figure 1 because the GISS website states that this provides the most relaistic representation of global meam trends.
It is evident from Figure 1 that the best fit for actual temperature measurements is currently the emissions-held-at-year-2000-level Scenario C. Therefore it is incorrect for Dana1981 to contend that temperaturea are currently following a trajectory slightly below Scenarion B.
Nevertheless, I do agree #23 CBDunkerson that the time period is still relatively short for comparing the scenarios. Consequently I agree with Hansen (2006) that we should wait until 2015 for distinction between the scenarios and useful comparison with the real world.
Figure 1: Scenarios A, B and C Compared with Measured NASA GISS LOTI (after Hansen, 2006)
I have used the LOTI data in Figure 1 because the GISS website states that this provides the most relaistic representation of global meam trends.
It is evident from Figure 1 that the best fit for actual temperature measurements is currently the emissions-held-at-year-2000-level Scenario C. Therefore it is incorrect for Dana1981 to contend that temperaturea are currently following a trajectory slightly below Scenarion B.
Nevertheless, I do agree #23 CBDunkerson that the time period is still relatively short for comparing the scenarios. Consequently I agree with Hansen (2006) that we should wait until 2015 for distinction between the scenarios and useful comparison with the real world.
-
Albatross at 04:14 AM on 22 September 2010A detailed look at Hansen's 1988 projections
Joe, "I would consider 23% more sensitive substantial" Dana is addressing misleading statement made by Michaels and Christy-- I have also addressed that in my post @46. Regardless, what you might consider or think is "substantial" is not necessarily indicative of what the reality is. The range given by IPCC for CS is 1.5 through 4.5 C. Hansen's original model had a CS was clearly on the high end of that range, I for one am not trying to ignore that. What I take issue is with certain people spinning that. Can I assume that you agree with what Michaels and Christy have said on this? Science advances, Hansen had the intellect, know how and guts to make a bold prediction, that all things considered, was in good agreement with what actually transpired (predicted warming of 0.26 C per decade versus observed warming almost 0.20 C per decade). I doubt that you, or I, or Michaels would venture to make such a prediction and get it even remotely correct. Anyhow, that is the nature of science. You give it you best shot, using the best tools and information at your disposal now, and then someone else comes along and improves upon your technique, or down the road you improve upon your initial work. Hansen's seminal work has served as a building block for others. -
Alexandre at 04:05 AM on 22 September 2010Climate scientists respond to Monckton's misinformation
I kinda share John's criticism, but let's not be grumpy. I hope this is the first of a long row of public statements from climate scientists. Misinformation has been spread long enough without proper response. -
Paul Magnus at 03:58 AM on 22 September 2010Climate scientists respond to Monckton's misinformation
Climate scientists respond to WHO? Will it be sent to the committee? Will they revise their conclusions? Why is this hind sight? -
Joe Blog at 03:55 AM on 22 September 2010A detailed look at Hansen's 1988 projections
Albatross at 03:30 I would consider 23% more sensitive substantial, i suppose it comes down to how exactly you want to measure it... if we go to absolute temperatures, we can claim basically absolute accuracy. But the Q is, did Hansen 88 accurately model climate since its hindcast... the answer is no. There are actually other possibilities why the discrepancies, he may have climate sensitivity right, but other unrelated factors have thrown it off, say decreased UV effecting ozone, effecting stratospheric temps, effecting tropospheric pressure systems (or co2 doing the same) etc... Or did he assume a solar constant, and the reduced TSI is effecting it? the list goes on. There is a bit o seeing what yah want to see going on here... Why i dont know, i agree with Dana that this has nothing to do with proving AGW wrong. Its just showing how the quantification's can become more confined with a greater data record. No surprises there. But how exactly this classes as an exoneration is quite frankly escaping me. -
Albatross at 03:50 AM on 22 September 2010A detailed look at Hansen's 1988 projections
NETDR @48, You ask "Am I missing something ???" Yes you are, very much so. But I am afraid that I do not have the patience right now. Maybe someone else feels more inclined. -
mehus at 03:48 AM on 22 September 2010Climate scientists respond to Monckton's misinformation
This is a fantastic rebuttal using a who's who of climate change science. I can only imagine the response from Monckton. His head might just explode. If he issued over 400 question to Dr Santer from his presentations I can only imagine how long and delusional his rebuttal to this will be. That task may keep Monckton busy for another year or two... -
NETDR at 03:43 AM on 22 September 2010A detailed look at Hansen's 1988 projections
CB Dunkerson The Pat Michaels analysis is a straw-man defense. Dr Hansen's model was seriously wrong but not as seriously as Pat said. So what? Who said anything about being able to predict the future or past down to the month ? He ran the models and back-cast to obtain the best possible fit. . Of course each squiggle of the temperature chart is not matched exactly. That is way beyond our capability at this time. His prediction Despite your quibbles he was seriously wrong ! The chart predicts .9 ° C - .25 ° C = .6° C 5 Reality is .54 - .25 = .29 ° C This is using a 5 year average not a month by month value. His model points straight up for 2010 so the model will look worse next year. There was 44 % as much warming as predicted. [+, - quibbles] So if the .29 ° C rate for 30 years is continued for 100 years you get about 1 ° C warming which is the value for CO2 alone with no feedback. For this we are seriously discussing tens of trillions of dollars of taxes and cap and trade ? Joe said it right : “This isn’t a rebuttal it is a postmortem” I wasn’t particularly interested in the excuses why Dr Hansen was wrong. When you know all of the answers and the “debate is over” you have to be right ! No excuses allowed. Any gambler can tell you why he was wrong ! So this article has proven he was wrong [in 88] and claimed it was a rebuttal to those that claim he was wrong. [in 88] Am I missing something ??? -
John Hartz at 03:39 AM on 22 September 2010A detailed look at Hansen's 1988 projections
As best I can tell from reading the literature, climate models have very short shelf lives. How many models have Dr. Hansen and his team developed since 1998? I presume that each succeeding model was an improvement over its predecessor. I suggest that everyone's time and energy would better be spent on focusing on the validity of the forecasts being made today by current crop of climate models than constantly revisiting no longer relevant forecasts made in 1998 by a single model that is no longer in use. -
Albatross at 03:30 AM on 22 September 2010A detailed look at Hansen's 1988 projections
Christy said: "The result suggests the old NASA GCM was considerably more sensitive to GHGs than is the real atmosphere." Schmidt and Dana showed this to be a gross exaggeration. Climate Sensitivity (CS) in Hansen's early model was too high (4.2 C versus 3.4 C), but not "considerably" too high, especially in the context of the range of uncertainty in CS of +1.5 to +4.5 C presented in the IPCC's AR4. Michaels said: "Ground-based temperatures from the IPCC show a rise of 0.11°C, or more than four times less than Hansen predicted....The forecast made in 1988 was an astounding failure." Schmidt has shown that statement to be patently false. Observed rate of warming between 1984 (year simulation started) and 2009 = +0.19 C per decade. Predicted rate of warming over same period (with GHG emissions being too high and with too high a climate sensitivity in the model) = +0.26 C. And is that is not good enough, the error bars of the observations and predictions data overlap by quite a bit. Also, I agree with CBDunkerson's assessment @43. What I also found odd is that, to my knowledge, neither Michaels nor Christy have made the effort to make their own predictions concerning the expected rate of warming 20-30 years form now. -
beam me up scotty at 03:16 AM on 22 September 2010Climate scientists respond to Monckton's misinformation
Here's a nice presentation http://www.stthomas.edu/engineering/jpabraham/ -
John Hartz at 03:13 AM on 22 September 2010A detailed look at Hansen's 1988 projections
@Dana1981 & John Cook: Because it is a poor B&W copy of a color graphic, Figure 2 is virtually worthless to anyone not already familiar with its contents. Suggest that someone track down a color version of this graphic and replace the B&W with it. Although Figure 3 is a color graphic, the colors chosen are pretty much shades of the same basic color. Is it possible to use a different set of colors in this graphic? -
dana1981 at 03:07 AM on 22 September 2010Climate scientists respond to Monckton's misinformation
That list of 21 climate scientists has some very impressive names. It's just too bad they have to waste their time debunking Monckton's nonsense. -
Daniel Bailey at 02:58 AM on 22 September 2010Climate scientists respond to Monckton's misinformation
Long overdue. Thanks! The Yooper -
Joe Blog at 02:55 AM on 22 September 2010A detailed look at Hansen's 1988 projections
dana1981 at 02:02 AM No dana, saying if we change his models assumptions to thus, does not actually make it right, or more accurate... this isnt a rebuttal, but a postmortem. Saying why something is dead dosnt change the fact it is dead. C is the closest scenario to observations in temp, B is the closest in relation to emissions. Now obviously, some of the criticisms cited are pushing the envelope, in how they have chosen to interpret the predictions vrs temp... but so is this one. So what percentage of the temperature anomaly is B from observations? This is relevant. Im not drawing any other conclusion from this, other than Hansen had it wrong in 88. Because he did, you have demonstrated it, it is obvious from a glance at the predictions vrs observations. This dosnt change anything. I still think we are effecting climate through co2 emissions... But Hansen had assumed a higher climate sensitivity than observations. And you have demonstrated this, But then you are claiming it as a rebuttal to criticisms, that have made the exact same observation???? (John Christy) -
Albatross at 02:37 AM on 22 September 2010Climate scientists respond to Monckton's misinformation
This is fantastic news! In fact, it made my day. -
CBDunkerson at 02:36 AM on 22 September 2010A detailed look at Hansen's 1988 projections
dana1981 #41: Are you assuming they actually READ the whole article? It seems pretty clear to me that several of those posting objections have not. Baz #37: I'm not sure which graph you are referring to, but I'd guess the problem is different baseline periods. If the anomaly numbers you are looking at were computed against a different baseline then the graph then you're going to get different values. The relative values should be the same, but the absolute numbers would be shifted by whatever the difference between the baselines is. -
Anne-Marie Blackburn at 02:33 AM on 22 September 2010Climate scientists respond to Monckton's misinformation
I will never understand why Monckton was allowed to testify to the US Congress since it's been clear for some time that he doesn't know what he's talking about. Look forward to reading to the report. -
The contradictory nature of global warming skepticism
Baz writes: I'm not a scientist or in any science field. I'm what Americans call a regular Joe - I'm indicative of the vast majority of people out there (I know because in my job I get to talk to lots of people). Everyone speaks only for her/himself here. You're writing solely on behalf of Baz; you don't speak for "the vast majority" of Americans, let alone for "the vast majority of people." FYI, though, when evaluating how representative your opinion is, you might consider that a large majority of Americans says that the federal government should regulate the release of greenhouse gases from sources like power plants, cars and factories in an effort to reduce global warming. -
A detailed look at Hansen's 1988 projections
Thanks Daniel, but after the Email Episode he stopped replying to my emails! 37. Seriously, anyone? Please excuse my ignorance. -
The contradictory nature of global warming skepticism
Trying again - my last posting was apparently harsher in tone than I had intended. Baz - If you wish to argue from admitted confirmation bias and statistically unsupportable timeframes, just keep in mind that reality is a harsh critic. Hence the focus here on peer reviewed papers, evidence, statistical significance, etc. It's very important to keep in mind the "Average Joe" when discussing topics like climate change - that's one of the reasons for this site. Everyone in the field should be aware of the need to present science clearly and often, so that when policy decisions are made, they can be made in an informed manner. -
dana1981 at 02:02 AM on 22 September 2010A detailed look at Hansen's 1988 projections
I have to say, it's a little irritating how many people can't get past the "it looks like Scenario C" perception. Is the entire rebuttal over their heads? Are they just incapable of seeing anything other than what they want to see? -
CBDunkerson at 01:29 AM on 22 September 2010A detailed look at Hansen's 1988 projections
NETDR #36 writes; "They can’t possibly exactly predict the past exactly without cheating." Yet your prior post objected to their 'failure' to exactly predict the future... down to the month. "The 5 year average for 2009 was .54° C" Actually, 0.55 C based on the URL you provided. Apparently you rounded down. "The 5 year average for Hansen’s prediction is hard to get precisely but it seems to be .9 ° C" Yes, since all of the values from 2005 through 2009 on scenario B are clearly less than 0.9 C (the only one which comes close is 2009) it definitely IS hard to get how you come up with that average. The 'UHI skews temperature records' and 'satellite temperatures are different' bits have been debunked on this site so many times that I can't be bothered. -
Riccardo at 01:20 AM on 22 September 2010Risky Business: Gambling on Climate Sensitivity
adelady, maybe i looked pessimistic while i'm not. What I've tryed to say is that it's a broader cultural problem and consequently broader changes in our societies are required. In this, science alone is not enough. -
Doug Bostrom at 00:58 AM on 22 September 2010A detailed look at Hansen's 1988 projections
...like the horse player who bets on the wrong horse but shows how he could have picked the right one if only. Or one can take the approach of imagining much of the field had never raced, thus concluding one's own pick won. Alternatively, how about ignoring most available data in order to gin up a comfy conclusion? -
Daniel Bailey at 00:42 AM on 22 September 2010A detailed look at Hansen's 1988 projections
Re: Baz (37)"Can someone please explain why the graph shows HadCRUt3 (in pink) dipping well into the 0.5s when the data says it hasn't."
You can try asking Phil Jones. :) The Yooper -
A detailed look at Hansen's 1988 projections
Can someone help me out here? I can't see (by eyeballing) that the actual temps match any of them, even C. However, that's not important to me. Can someone please explain why the graph shows HadCRUt3 (in pink) dipping well into the 0.5s when the data says it hasn't. http://www.cru.uea.ac.uk/cru/data/temperature/hadcrut3gl.txt I know there is obviously a simple explanation! Thanks. -
NETDR at 00:15 AM on 22 September 2010A detailed look at Hansen's 1988 projections
CB Dunkerson [35] If you notice all scenarios start approximately together in 1988. They can’t possibly exactly predict the past exactly without cheating. They were adjusted to converge on the right answer in 1988. [No problem, I would do it that way too.] You complained that the time period I chose for my end point was too short. Let’s go back to 2009 and use a 5 year average. The 5 year average for 1988 was .25 ° C [Anomaly] The 5 year average for 2009 was .54° C The 5 year average for Hansen’s prediction is hard to get precisely but it seems to be .9 ° C http://data.giss.nasa.gov/gistemp/graphs/Fig.A2.txt Let’s do the math. The chart predicts .9 ° C - .25 ° C = .65 Reality is .54 - .25 = .29 Even with uncorrected UHI and other surface station issues. If I had used Satellite data his predictions look worse, because there are no perking lots in space. In my book that is pretty poor performance. His excuses ring hollow to me, it is like the horse player who bets on the wrong horse but shows how he could have picked the right one if only. Everyone “could have” and “should have “. Putting those guesses to work on predicting the future will verify or refute them. Anyone can predict the past. -
muoncounter at 22:43 PM on 21 September 2010Global warming and the unstoppable 1500 year cycle
Just noticed a small typo in the 3rd paragraph: 'rising over 390 ppm' should be 'rising to 390 ppm'. -
Berényi Péter at 22:01 PM on 21 September 2010The significance of past climate change
#86 Berényi Péter at 08:36 AM on 21 September, 2010 If surface temperature is increased by 1%, surface temperature goes up by 0.5°C. That's plain silly. Of course it should read "If surface pressure is increased by 1%, surface temperature goes up by 0.5°C." It is calculated this way: Density of air at ambient pressure is about 1.3 kg/m3. As mass of air above an 1 m2 surface is about 104 kg, a 1% increase implies an additional 100 kg/m2. To get to this value, the air column should be 77 m deeper. With a 6.5°C/km environmental lapse rate it makes the surface 0.5°C warmer. Now, here is this paper. Nature Geoscience 2, 891 - 896 (2009) Published online: 15 November 2009 doi:10.1038/ngeo692 Nitrogen-enhanced greenhouse warming on early Earth Colin Goldblatt, Mark W. Claire, Timothy M. Lenton, Adrian J. Matthews, Andrew J. Watson & Kevin J. Zahnle They hypothesize nitrogen partial pressure during the Archaean was twice as high as it is today and they say there would be 3-5°C warming for N2 doubling. It is much lower than the result given by the first-order approximation above and I just can't see where the huge difference comes from. -
CBDunkerson at 21:52 PM on 21 September 2010A detailed look at Hansen's 1988 projections
NETDR, there are a couple of glaring flaws in your analysis; "From 1988 to present [Aug 2010] the warming has been .53 ° C - .31 ° C = .22 ° C" 0.53 C is the anomaly for JUST August 2010 while 0.31 C is the anomaly for the entire year 1988. Monthly variations are, of course, greater than annual variations. This method is also subject to huge variations depending on the precise timing. If we pick different months, say March 2010 with 0.84 C anomaly minus November 1988 with -0.03 C anomaly we get a +0.87 C increase... MORE than the model predicted. Also, LOOK at the Hansen graph in the URL you posted. The temperature values BEFORE 1988 diverge significantly from the actual temperature record in individual years. For instance, for 1981 scenario B 'predicted' (7 years after the fact) that the anomaly had been roughly double what the actual record showed. From this we can conclude either that Hansen's model was wrong before it was even released... OR we could be remotely logical and realize that these models were never intended to precisely match each and every year... which is the test you are applying. A model is 'accurate' if it matches the long term trend. Picking out individual years (or months) and saying 'the model is off by X% at this moment in time' is meaningless. Through 2005 the model trend lined up with scenarios B & C. Since 2005 it has lined up with scenario C while emissions have actually been just a bit below those assumed for scenario B. Thus, it could be said that the trend isn't matching the model's prediction for our approximate emissions over the past five years... except that is a ridiculously short period of time on which to base a trend. -
NETDR at 20:44 PM on 21 September 2010A detailed look at Hansen's 1988 projections
I think the article is far too forgiving with Dr Hansen. He got it significantly wrong. From 1988 to 2010 his graph shows his predicted warming to be. 1.0 ° C - .31 ° C = 69 ° C From 1988 to present [Aug 2010] the warming has been .53 ° C - .31 ° C = .22 ° C http://cstpr.colorado.edu/prometheus/archives/hansenscenarios.png Giving Hanson the benefit of the doubt and using GISS’s own numbers: http://data.giss.nasa.gov/gistemp/tabledata/GLB.Ts+dSST.txt The earth only warmed 31 % as much as predicted. This is less than scenario “C” which is what was predicted for what would happen with stringent carbon cuts. When the “debate is over” you have all of the answers and are expected to be correct. If he got climate sensitivity wrong that is just an excuse, this means his predictions of 2020 and beyond will be way off track and getting worse each decade. -
Michael Le Page at 20:16 PM on 21 September 2010Risky Business: Gambling on Climate Sensitivity
A few little things that struck me: It seems a little odd to include Royer 2007 in the climate model category, it's a bit of a hybrid but based on past changes in CO2. Also, where does that the top limit for Royer come from? The paper states "GEOCARBSULF simulations cannot exclude the possibility of a high climate sensitivity"? Finally, why not include Lunt 2010 and Pagani 2010? -
adelady at 18:21 PM on 21 September 2010Risky Business: Gambling on Climate Sensitivity
Riccardo "My impression is that our time horizon is pretty near, we're not able (or not willing) to consider long term plans." I really think it's a failure of the imagination. I can speculate about my grandchildren's grandchildren. When people talk about this they don't really visualise it, they just hope that they'll be decent people who'll enjoy life in much the same way we do. In this I'm more with Hansen. I see good possibilities if this generation and the next does the right thing. I see nasty stuff if we and they don't. Of course for them, it'll be just the way the world is. But my generation is not too thrilled about the way our predecessors mucked up our forests and agricultural lands and introduced pests of every kind. I'd hope that our descendants will see that we did our best even though it was too little too late for some things they'll never get to see. -
Glenn Tamblyn at 18:15 PM on 21 September 2010Climate sensitivity is low
A common misconception that people have about Climate Sensitivity is that it is a fixed value over a wide range of climatic conditions. This leads to some quite bizarre 'analyses' in the denialosphere, attempting to show that CS couldn't be that high because that implies that CO2 contributes far too much of the 33 DegC of extra warmth attributed to the Greenhouse Effect. The fallacy they make is projecting the same CS value back through lower and lower CO2 levels and temperature regimes. Climate sensitivity is an idea used to encapsulate how the planet IN A PARTICULAR CONFIGURATION - temperature, distribution of land masses, ocean currents, air movements, ice cover, vegetation patterns etc - will respond to a change in radiative forcing from whatever source - GH Gases, Solar changes, Aerosols. So Climate sensitivity will certainly be different at different times. In fact sensitivity to a warming pressure would likely be different to the sensitivity to a cooling pressure in the same climate. So sensitivity to a warming pressure at the bottom of an ice age would be higher than at the top of the ice age; with ice down to lower latitudes, any retreat of that ice due to temp rise exposes a larger area of land and sea and thus has a bigger effect on albedo than the same distance of retreat when the ice is only at higher latitudes. However given the thickness of the ice sheets, the time lags in responding to the warming will be large as it takes time for the ice to melt away. Conversely sensitivity to a cooling pressure coming out of an inter-glacial is likely to be high since even modest cooling can quickly increase the area and duration of snow fall; 1 metre of snow has much the same albedo as ice sheets kilometers thick. The time lag responding to any such cooling is thus also likely to be quicker. In an Ice free world, CS to a warming pressure might be much lower since Ice based albedo change doesn't occur. Similarly in a world with very low CO2, a Snowball Earth, CS might also be low. If the world is literally covered in ice, modest warming may not be enough to cause any ice melt - going from -18 DegC to - 15 DegC for example may not cause any ice cover reduction. It would only be when enough warming pressure has occurred that ice cover retreat begins that change might be rapid. In effect, CS would change when the climatic conditions change enough. This is also important when considering the oft cited figure of 33 DegC of warming due to the GH effect. The calculation that arrives at this number is based on the Earths current Albedo; that around 30% of sunlight is reflected away and isn't part of the energy balance. However in a world that is -18 DegC ON AVERAGE, Ice Cover would be much greater, more even than an Ice AGe which still has a positive average temp. At minus 18 DegC, ice cover sufficient to cause 50% of sunlight to be reflected is quite conceivable. The calculation for this albedo gives 53 Deg extra warmth: -38 DegC -
The contradictory nature of global warming skepticism
archiesteel. I'm honest! It's a rarity these days. That's why it actually really annoys when someone says I'm a liar or dishonest. No, I'm completely open about my scepticism, my confirmation bias, my 'illogical' choice of 10 years of data. As I tried to point out (and I'm sure I don't need to!) I'm not a scientist or in any science field. I'm what Americans call a regular Joe - I'm indicative of the vast majority of people out there (I know because in my job I get to talk to lots of people). We don't see what you see. Maybe seeing it scientifically is wrong. Sometimes it takes an outsider to see something an expert has been staring at for some time. You might see noise and incomplete data, I might see something entirely different. Give it just a passing thought, at least. If I get time later I'm going to pop back and show you what my experience was like on here. But if I don't get time then, have fun - and stay healthy Archie! -
Riccardo at 17:46 PM on 21 September 2010Risky Business: Gambling on Climate Sensitivity
Apart from the die-hard skeptics, I think that for the general public is not even a gambling. My impression is that our time horizon is pretty near, we're not able (or not willing) to consider long term plans. In this sense we are culturally limited to the financial-style next quarter results. These considerations does not apply just to climate or global resources limitation but even to our everyday life. And it's the prologue for the disaster. -
Bern at 17:14 PM on 21 September 2010Risky Business: Gambling on Climate Sensitivity
I thought the entire article was well written, Graham, thanks. Regarding the above comments on gambling, and stressing the potential disastrous outcomes - I guess it's a fine line to be walked, between over-caution on the one hand, which may lead to complacency, and alarmism on the other, which will of course lead to dismissal by the denialosphere. (Mind you, the skeptic tendency to leave zero space between 'alarmism' and 'nothing to worry about' makes that a particularly difficult task...) If the more pessimistic results from the climate models are at all correct, it's not just gambling - it's more like playing russian roulette, but with nuclear weapons... if you're wrong, it doesn't just affect you, it affects everyone else as well. Sure, it may just be a sub-kiloton tactical nuke, that 'only' takes out your neighbourhood. Then again, it might be the launch code for the world's entire arsenal. The sad bit is that some people look at that problem, and see that it might not be their neighbourhood, but, say, a neighbourhood in Bangladesh, or a low-lying island nation, and they think "Meh, it doesn't affect me" and push the button anyway...
Prev 2178 2179 2180 2181 2182 2183 2184 2185 2186 2187 2188 2189 2190 2191 2192 2193 Next


