


 Arguments


Recent Comments
Prev 2222 2223 2224 2225 2226 2227 2228 2229 2230 2231 2232 2233 2234 2235 2236 2237 Next
Comments 111451 to 111500:
-
thingadonta at 17:24 PM on 28 August 2010Ocean acidification threatens entire marine food chains
#Dappeldwater: Volcanic events can be rapid, medium term or long term. C02 has been released faster than humans are currently adding c02 to the atmosphere, and yet oceans didnt acidify. As usual coral researchers take no account of the geological record. Obvious really. -
Rob Painting at 15:44 PM on 28 August 2010Ocean acidification threatens entire marine food chains
Thingadonta @ 8 "Past geological events indicate that it takes a long time for oceans to acidify" Yes, exactly, past geological events (volcanic activity) released CO2 much more slowly than the rate at which humans are currently adding it to the atmosphere. That's why the current acidification is progressing much faster. Obvious really. -
Doug Bostrom at 15:39 PM on 28 August 2010Hansen etal hit a Climate Home Run -- in 1981
With enough circumstantial evidence we may safely conclude we've accurately described a real circumstance. :-) -
Rob Painting at 15:38 PM on 28 August 2010Ocean acidification threatens entire marine food chains
Dsleaton @ 6 - yup, a real double whammy for phytoplankton, which are the basis for the ocean food web & recycle much of the Earth's oxygen. The warming oceans are becoming more stratified, thereby reducing nutrient upwelling and therefore leading to declines in phytoplankton abundance. Press release here: Marine Phytoplankton Declining: Striking Global Changes at the Base of the Marine Food Web Linked to Rising Ocean Temperatures Then there this bad news: Acidifying Oceans Spell Bleak Marine Biological Future 'by End of Century', Mediterranean Research Finds , -
thingadonta at 15:35 PM on 28 August 2010Ocean acidification threatens entire marine food chains
"The acidity of global surface waters has increased by 30% in just the last 200 years. " As I understand, 200 year old data on ocean pH is modelled, not measured, so we don't know for certain how much ocean pH has changed in the last 200 years. "These changes in ocean chemistry are irreversible for many thousands of years," This also is uncertain. From Wiki: "Leaving aside direct biological effects, it is expected that ocean acidification in the future will lead to a significant decrease in the burial of carbonate sediments for several centuries, and even the dissolution of existing carbonate sediments.[50] This will cause an elevation of ocean alkalinity, leading to the enhancement of the ocean as a reservoir for CO2 with moderate (and potentially beneficial) implications for climate change as more CO2 leaves the atmosphere for the ocean.[51]" The ocean subsurface is by far greater in area than all the worlds coral reefs. Sedimentation/dissolution processes could create a strong buffer to changes in ocean pH. This has never been factored into any IPCC or other models of ocean pH projections. We dont know what kind/magnitude of negative feedbacks occur in the ocean subsurface, and therfore there is no way we can make any meanigful statment regarding ocean pH projections. Past geological events indicate that it takes a long time for oceans to acidify (of the order of thousands of years++); this implies that negative feedbacks to changes in C02 in the atmosphere are likely to be strong, and current prjections far too simplistic and overstated. -
nigelj at 15:21 PM on 28 August 2010Climate Models: Learning From History Rather Than Repeating It
Argus #26. We do actually have one long term climate model of future temperatures. Arrhenius in 1896 predicted a one degree rise for the 20th century from fossill fuel burning, not a bad estimate. Thats very sobering. Never loose siight of that in the detail and exact effects of relatively minor gases like nitrous oxide. Never loose -
Yvan Dutil at 12:09 PM on 28 August 2010Ocean acidification threatens entire marine food chains
@dsleaton Looks like heat. This hypothessis has been supported by correlation between local temperature and phytoplancton abundance. -
dsleaton at 11:41 AM on 28 August 2010Ocean acidification threatens entire marine food chains
Not certain if it's heat or acidification, but we recently had the news about phytoplankton: http://www.nature.com/nature/journal/v466/n7306/full/nature09268.html -
HumanityRules at 11:38 AM on 28 August 2010Can humans affect global climate?
19.Dappledwater I guess I posted this record to try to extend the record further back from the post-WWII increases in CO2. I think we might be able to consider 1800-1900 as a period of very low CO2 emission but there's always a danger in assuming things. -
Colorado Bob at 11:38 AM on 28 August 2010Ocean acidification threatens entire marine food chains
Bacteria that eat hydrocarbons. -
Colorado Bob at 11:37 AM on 28 August 2010Ocean acidification threatens entire marine food chains
Jellyfish -
Colorado Bob at 11:36 AM on 28 August 2010Ocean acidification threatens entire marine food chains
As this deary nightmare has unfolded , some winners have begun to show themselves. Just off the top of my head I can think of the following : Kudzu Poison Ivy Pine Bark Beetles Spruce Bud Worms No doubt the oceans will turn up winners in a more acidic world. I got 5 bucks sez , they aren't things we'll enjoy. -
Colorado Bob at 11:27 AM on 28 August 2010Ocean acidification threatens entire marine food chains
Michael - One of the great metaphors for how small changes do great things is the alligator. At one temperature range, all the offspring become females, but just a few degrees away they all become male. " The gender of alligators is determined by the temperature of the eggs. Temperatures between 90 and 93 degrees Fahrenheit will produce males. Temperatures between 82 and 86 degrees Fahrenheit will produce females. " http://www.ehow.com/facts_5972765_difference-between-male-female-alligator.html -
David Horton at 11:24 AM on 28 August 2010Ocean acidification threatens entire marine food chains
Might be worth adding that there are not simply species "at risk" but there are already changes occurring which have been observed. I have forgotten the details, but it is among the planktonic species of the Antarctic. -
Andy Skuce at 11:09 AM on 28 August 2010Comparing volcanic CO2 to human CO2
thpritch: Thanks, I have fixed the link. Andy -
Ned at 10:16 AM on 28 August 2010Assessing global surface temperature reconstructions
Hi, Zeke. Thanks for stopping by, for the kind words, and for the correction to figure 5. The two time-series are already quite similar, so if this brings them even closer together the results must be virtually indistinguishable! In any case, I'll update the post to reflect this (though it may be a couple of days before I'm able to do so). I'm sure you're a busy guy, and rankexploits.com seems to be a good venue for your writings. But if and when you have the time, we'd all very much appreciate any thoughts you'd care to share over here. -
johnd at 10:04 AM on 28 August 2010Can humans affect global climate?
Those who have lived in cities that have been hit by hurricanes/cyclones will be hoping that the comment about humans not being able to affect single weather events is true, or perhaps not. There is a train of thought developing that hurricanes/cyclones may be drawn towards large population areas because of the changes such infrastructure has on the local climate. If true not only does it affect the area hit, but those areas missed that may have otherwise received at least the moisture such events bring in the course of such natural events. -
MattJ at 09:04 AM on 28 August 2010Can humans affect global climate?
Yvan Dutil #20- The only 'incompetency' Spencer proved is his own. The whole article is pseudo-science. You should have been able to guess this by his frequent reference to 'trending' and its removal, with no discussion of what algorithms he used to do this. But without that discussion, we have no idea if he did it right, or if he did it to get the results he wanted. Then there is also his red herring about the ratio changing due to rise in C12 instead of fall of C13. -
johnd at 08:56 AM on 28 August 2010Climate Models: Learning From History Rather Than Repeating It
CBDunkerson at 22:03 PM, the broad strokes of the hydrological cycle are indeed broad if the mathematics which drives the climate change theories is exchanged for the application as it applies in practice. Clouds coverage of the earths surface is about 2/3 so it is a major factor of not only how much solar radiation intersects the earths surface but where. Whilst debate rages over small changes in solar output, by comparison little is devoted to how small changes in solar output compares to small changes in cloud coverage and distribution in terms of nett effect, simply because clouds are dismissed because no-one is sure of the nett effect. YET the whole effect that the climate has on the planet is dependent on how much and the distribution of the solar radiation falling on the surface. It is unequal heating and cooling that firstly sets in motion the processes that try to find thermal equilibrium, but also where the unequal warming and cooling occurs that results in thermal energy being absorbed or liberated from the soils and waters which in turn affects whether CO2 is also being absorbed or liberated. In addition the circulation that develops as thermal equilibrium is sought also transports the CO2 either depriving or making it available to and from the various sources and sinks in varying combinations with moisture and warmth that combined determine whether a location becomes a nett source or sink for not only the thermal energy and moisture, but the CO2 as well. Even if all that does have a negligible effect as you claim, which I disagree with, if it is what determines whether the nett effect is positive or negative, small or large, then obviously understanding, and being able to measure it becomes very important. It is all very well to look at the nett effect today and correlate one piece of data with another, but if the processes which are not fully understood are input in to create models that successfully recreate the past climate in order to make predictions leading forward, one can never be sure whether the assumptions being made are correct or merely the result of a number of wrong assumptions canceling each other out. -
thpritch at 03:44 AM on 28 August 2010Comparing volcanic CO2 to human CO2
In regards to the link {Moerner and Etiope (2002)}, it does not exist nor was I able to find a joint paper by these authors via Scifinder. However, there is a 2002 article by Etiope on "Geologic emissions of methane to the atmosphere" in Chemosphere Volume 49, Issue 8, December 2002, Pages 777-789 -
Zeke Hausfather at 03:09 AM on 28 August 2010Assessing global surface temperature reconstructions
Ned, I'm a bit late to stumble upon this, but great summary of the work to date. One quick clarification: figure 5 is based on an incorrect interpretation of the v2.mean_adj dataset. Namely, it is a change-log rather than an independent dataset in its own right, and should be combined with all v2.mean months not present in v2.mean_adj. When that is done, the differences become much smaller. See the update on the bottom of http://rankexploits.com/musings/2010/the-ghcn-adustment-puzzle/ The net adjustments can be seen here: http://i81.photobucket.com/albums/j237/hausfath/Picture478.png -
Ned at 02:05 AM on 28 August 2010Arctic sea ice... take 2
Oops, Michael Sweet beat me to it... -
Ned at 02:04 AM on 28 August 2010Arctic sea ice... take 2
CBW writes: The only reason it is used is because it has value for navigation, and hence a longer historical record. Yes, for most physical processes ice area is probably more relevant than ice extent. But estimates of ice extent tend to be more reliable than ice area, at least in the non-winter months. For those of us who are just casual observers and aren't using sea ice data in actual quantitative models, the main thing is just to be consistent. The folks over at WUWT have shown a tendency to shift back and forth among different data sets (extent, area, NSIDC, JAXA, CT, PIPS, etc.) depending on which one is more exciting to them at any given time. That's a recipe for self-deception, IMHO. Pick one metric that you like to track, and stick with it. -
michael sweet at 01:59 AM on 28 August 2010Arctic sea ice... take 2
CBW, I think that NSIDC and other scientists prefer to use ice extent because the errors in measuring it are lower. The sensors have difficulty telling apart melt ponds on top of ice and open ocean so that adds to the error of area measurements. They prefer to use extent data dealing with the public because they are more sure of those numbers. see this link: http://nsidc.org/arcticseaicenews/faq.html#area_extent In any case, all of the measures of ice are going down. It is just a question of how fast they are going down. Once the new ice volume satellite comes on line that data will be much more useful. That should be sometime this fall. -
CBW at 01:36 AM on 28 August 2010Arctic sea ice... take 2
I realize that this is a basic post, but it makes no mention of ice area. Ice extent is a fundamentally flawed measure of ice because loose ice is subject to being moved around by wind and currents, and shows suppressed variability because thicker ice spreads out as the ice that restrains it disappears. The only reason it is used is because it has value for navigation, and hence a longer historical record. Ice area, on the other hand, tells you how much of the ocean surface is actually covered with ice, and so is a much better measure of the albedo and the potential feedback effects it implies. Extent tells you where there are chunks of ice floating around. Volume and area tell you how much ice there is and how much of the planet's surface it covers. -
Ned at 01:15 AM on 28 August 2010Can humans affect global climate?
Arkadiusz Semczyszak, both E.G. Beck and Jaworowski are very poor sources. Citing them tends to weaken rather than strengthen your case. -
Ned at 01:12 AM on 28 August 2010Comparing volcanic CO2 to human CO2
Berényi Péter writes: At the same time there is about 40,000 Gt carbon dissolved in the oceans in the form of various carbon compounds. That's equivalent to 145,000 Gt of CO2. We also have several tens of million Gt carbon buried in carbonate rocks. Yes ... so? What's the point, BP? CO2 has been remarkably stable over the past 800,000 years, ranging from ~180 ppmv at glacial maxima to ~280 ppmv during interglacials. But since 1850 we have raised the atmospheric CO2 concentration by 112 ppmv, roughly equivalent to the maximum fluctuation in the entire ice-core record ... but starting at what was already a high point. Over the course of this century we will almost certainly be adding another 150 to 300 ppmv on top of today's level. Nothing like this has happened any time in the past 800,000 years.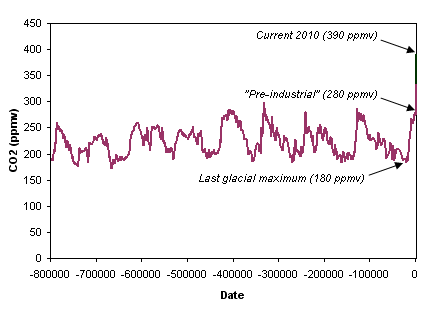 Figure 1: CO2 concentration over the past 800,000 years from ice cores at Dome C, Vostok, Taylor Dome, and Law Dome.
-
Yvan Dutil at 00:55 AM on 28 August 2010Comparing volcanic CO2 to human CO2
Speaking of C12/C13 ratio. This is an analysis of Spencer that clearly shows its imcompetency. http://wattsupwiththat.com/2008/01/28/spencer-pt2-more-co2-peculiarities-the-c13c12-isotope-ratio/ Check the comments, there are as coherent ;) -
rcglinsk at 00:53 AM on 28 August 2010Hansen etal hit a Climate Home Run -- in 1981
Shouldn't Hansen's prediction be compared to some naive/null prediction? -
Arkadiusz Semczyszak at 00:53 AM on 28 August 2010Can humans affect global climate?
CO2 and oceans. Natural forcing of climate during the last millennium: fingerprint of solar variability, Swingedouw et al., 2010: “We argue that this lag is due, in the model, to a northward shift of the tropical atmospheric convection in the Pacific Ocean, which is maximum more than four decades after the solar forcing increase. This shift then forces a positive NAO through an atmospheric wave connection related to the jet-stream wave guide. The shift of the tropical convection is due to the persistence of anomalous warm SST forcing the anomalous precipitation, associated with the advection of warm SST by the North Pacific subtropical gyre in a few decades. Finally, we analyse the response of the Atlantic meridional overturning circulation to solar forcing and find that the former [AMOC] is WEAKENED when the latter increases. Changes in wind stress, notably due to the NAO, modify the barotropic streamfunction in the Atlantic 50 years after solar variations. This implies a wind-driven modification of the oceanic circulation in the Atlantic sector in response to changes in solar forcing, in addition to the variations of the thermohaline circulation.” Dr Fraser (Southern ocean carbon sink weakened, 2007) says: “The increase in wind strength is due to a combination of higher levels of greenhouse gases in the atmosphere and long-term ozone depletion in the stratosphere, which previous CSIRO research has shown intensifies storms over the Southern Ocean.” „The increased winds influence the processes of mixing and upwelling in the ocean, which in turn cause an increased release of carbon dioxide into the atmosphere, reducing the net absorption of carbon dioxide into the ocean.” “A new hydrographic section across 25° N was taken in 2004, and comparison with measurements from 1957, 1981, 1992 and 1998 reveals a slowing [AMOC] of almost a third between 1957 and 2004.” (Atlantic Ocean trends, Nature Journal, 2005.) ... Solar activity increased, AMOC weaken - CO 2 increased - it’s "pure" The Nature ... Extreme deepening of the Atlantic overturning circulation during deglaciation, Barker et al., 2010.: “We conclude that the rise in atmospheric CO 2 concentrations and resultant warming associated with an especially weak overturning circulation are sufficient to trigger a switch to a vigorous circulation, but a full transition to interglacial conditions requires additional forcing at an orbital scale.” “... i.e., the AMOC is stronger when the north is cooler ...” (Toggweiler, 2010) D’Orgeville & Peltier (2009), CCSM3 T31x3 pre-industrial control, 60 yr: Similar in-phase T and S contributions to density, less role for NAO, but suggest gyre – bathymetry interaction. Results: min. AMOC - reduced sea ice, increased upwelling ... -
Arkadiusz Semczyszak at 00:44 AM on 28 August 2010Can humans affect global climate?
“a significant decrease in water vapour in the atmosphere” I recall, the reasons may be different. “We have measurements, that in 1970-90s water vapour was on the rise in the stratosphere. As soon as SOLAR ACTIVITY STARTED TO DROP in 1990s, WATER VAPOUR ALSO STARTED TO DROP. In 2000-2009 water vapour content in the troposphere dropped by 10%. [...]” (Contributions of Stratospheric Water Vapor to Decadal Changes in the Rate of Global Warming,Solomon,2010.). With this, beautifully, correlates decline of NPP: Drought-Induced Reduction in Global Terrestrial Net Primary Production from 2000 Through 2009 – Zhao & Running (2010): “The past decade (2000 to 2009) has been the warmest since instrumental measurements began, which could imply continued increases in NPP; however, our estimates suggest a reduction in the global NPP of 0.55 petagrams of carbon. Large-scale droughts have reduced regional NPP ...” “A continued decline in NPP would not only weaken the terrestrial carbon sink, but it would also intensify future competition between food demand and proposed biofuel production.” "This is a pretty serious warning that warmer temperatures are not going to endlessly improve plant growth, [...???]" Running said. “... that the additional CO2 can only be the result of human activity.” “Burning fossil fuels produces carbon dioxide enriched with carbon isotope C12 and reduced C13 and essentially no C14, and it decreases atmospheric oxygen, exactly as observed.” First, for the record once again remind you: of course CO2 from respiration is the same as the ratio of ratio13C/12C from fossil fuels. And 14C? If we base on it (tree ring, np. Eddy, 1976), then we would have to conclude that, for example in the MWP - it was similar or even more CO2 in the air than now ... 14C ... ... formed in the upper atmosphere of Earth as a result of the impact of cosmic rays with nitrogen (14N). Particle flux of radiation is greatest during periods of minimum solar activity - the weakening of its magnetic field, which shields the Earth and is a barrier to cosmic radiation. Arises more isotope 14C, which, diffuses into the lower areas of the atmosphere, among other things aside in annual increments of trees. So the greater the activity of the Sun, the less 14C falls on Earth ... “Nonetheless, it is confirmed with the new palaeomagnetic series that the Sun spends only 2–3% [!] of the time in a state of high activity, similar to the modern episode. This strengthens the conclusion that the modern high activity level is very unusual during the last 7000 years [...].” (Usoskin, IG , SK Solanki, and M. Korte (Geophys. Res. Lett., 2006 ), Solar activity reconstructed over the last 7000 years: The influence of geomagnetic field changes.) Now, in recent decades have seen increased by 15% increase in soil respiration (especially the Arctic) than predicted were the best models, also decreased to CO2 absorption by the oceans ..., ... and as we add to this the current decline in NPP ... Jaworowski Z. (2007) Carbon Cycle. Working materials for Seminar of Nongovernmental International Panel on Climate Change, Vienna 14 April, 2007. NIPCC Seminar, p. 1-21. annual fluxes of CO2 into the atmosphere: all natural ~ 170 Gt C Human total 7.97 Gt C = 4.7% of the natural stream, 0.16% of "greenhouse effect" I also recommend the latest work Beck for discussion; and the web article and his best criticism. -
Berényi Péter at 00:23 AM on 28 August 2010Can humans affect global climate?
#18 Dappledwater at 22:16 PM on 27 August, 2010 what's the 30 year trend at Armagh? For the last 30 years it's +0.21°C/decade. However, for the last 20 years it is only 0.06°C/decade and for the last 80 it's 0.046. Should measurements be finished at the end of 2002, facts would not get in the way and the accelerating trend stands out clear. 20 years: 0.48°C/decade 30 years: 0.35°C/decade 80 years: 0.06°C/decade -
DarkSkywise at 00:13 AM on 28 August 2010Humans are too insignificant to affect global climate
You're welcome. :) Of course there's never much 13C to begin with (only 1.1% of Earth's carbon is 13C), but the preference plants have for 12C makes their 13C/12C ratio about 2% lower, causing (by burning fuel) the atmospheric 13C/12C ratio to drop 0.15% since 1850. Now this may not look like much, until you realize this 0.15% drop comes from just a 2% lower ratio of just a 1.1% isotope, and then it's suddenly quite a lot. Still, I think it's quite amazing someone actually thought of it. :D -
Ned at 23:04 PM on 27 August 2010Comparing volcanic CO2 to human CO2
BP writes: No. 337 Gt carbon is equivalent to 1236 Gt of CO2. You are of course right -- I reversed the conversion. Sorry about that. However, it doesn't affect the rest of the calculations in my comment. 337 GT carbon is approximately equivalent to 158 ppmv in the atmosphere. Comparing this to the observed 112 ppmv increase in the atmosphere shows that, in answer to RSVP's question, there's nothing really large that needs to be explained -- most of the CO2 increase from fossil fuels is still in the atmosphere, but a fraction of it has gone into the oceans. Anyway, thanks for the correction, Berényi Péter. It's been a long week. -
wgray at 22:34 PM on 27 August 2010Humans are too insignificant to affect global climate
So, by burning fuel/plants, we add more 12C to the atmosphere. Aha! Thank you! -
Yvan Dutil at 22:33 PM on 27 August 2010Can humans affect global climate?
Speaking of C12/C13 ratio. This is an analysis of Spencer that clearly shows its imcompetency. http://wattsupwiththat.com/2008/01/28/spencer-pt2-more-co2-peculiarities-the-c13c12-isotope-ratio/ Check the comments, there are as coherent ;) -
Berényi Péter at 22:33 PM on 27 August 2010Comparing volcanic CO2 to human CO2
#5 Ned at 21:23 PM on 27 August, 2010 Total emissions since 1750 from fossil fuels and cement production are 337 GT carbon (from ORNL-DAAC). Note that this is equivalent to 92 GT of CO2. No. 337 Gt carbon is equivalent to 1236 Gt of CO2. Currently we have about 3000 Gt of the stuff in the atmosphere. That's equivalent to 823 Gt carbon. At the same time there is about 40,000 Gt carbon dissolved in the oceans in the form of various carbon compounds. That's equivalent to 145,000 Gt of CO2. We also have several tens of million Gt carbon buried in carbonate rocks. -
Rob Painting at 22:22 PM on 27 August 2010Can humans affect global climate?
HR @ 12 - wouldn't we really need to plot temperature data prior to the Industrial Revolution, to really understand "natural" natural variability?. Once humans start to pump larges amounts of greenhouse gases into the atmosphere, how natural is that?. -
CBDunkerson at 22:21 PM on 27 August 2010Arctic sea ice... take 2
HR, ummm... yes, and I quoted the part of that 'scientists in planes' paper where they said the volume of older ice may have decreased. You're trying to use a small area study to advance a conclusion that the study itself contradicts based on insufficient data. -
HumanityRules at 22:18 PM on 27 August 2010Climate Models: Learning From History Rather Than Repeating It
9.Dappledwater There is a new paper in JGL-Oceans (presently it's flagged as the most popular download) which uses a new method for calculating 20th SLR. JOURNAL OF GEOPHYSICAL RESEARCH, VOL. 115, C08013, 15 PP., 2010 doi:10.1029/2009JC005630 Reconstruction of regional mean sea level anomalies from tide gauges using neural networks Manfred Wenzel and Jens Schröter While they find similar 20th C SLR to other papers, such as Church & White 2006 they do not see any late 20th C acceleration. They explain this as follows "This is obviously due to the missing depression in sea level prior to 1950 that is the main difference of our result to CW06" I can't comment on the neural network method used in their calculations but it does suggest there is still more to learn about this particular metric. -
Rob Painting at 22:16 PM on 27 August 2010Can humans affect global climate?
BP, what's the 30 year trend at Armagh?. -
Rob Painting at 22:11 PM on 27 August 2010Arctic sea ice... take 2
HR @18 - that's not what those passages suggest, however who knows?, it's not discussed in the paper. Pete Hogarth - the multi year ice ain't what it's cracked up to be either -
CBDunkerson at 22:10 PM on 27 August 2010Comparing volcanic CO2 to human CO2
RSVP, also 250 ppm was indeed the 'pre-Industrial Revolution' CO2 level... if you are talking about ~13,000 years before the Industrial Revolution. Immediately before industrialization began it was around 280 ppm. -
CBDunkerson at 22:03 PM on 27 August 2010Climate Models: Learning From History Rather Than Repeating It
johnd #26: Yes, I mentioned that I was skipping over the details of feedback effects entirely since 'at' was asking about the '3 C per doubling of CO2' estimate specifically. However, the broad strokes of the hydrological cycle aren't really as much of a mystery as you seem to suggest. Where and when a particular precipitation incident will occur, aka 'weather', is much more difficult to predict than average precipitation, aka 'climate'. The increased water vapor content of the atmosphere is the single largest positive feedback included in that '3 C per doubling' estimate. Rain, snow, clouds, and other incidental effects of that increased atmospheric water vapor have been studied and found to have fairly negligible effects... to the point where it isn't clear whether they are a net positive or negative feedback, but IS clear that they are a tiny fraction of the positive feedback effect of the water vapor itself. -
Berényi Péter at 21:44 PM on 27 August 2010Can humans affect global climate?
#14 John Chapman at 15:03 PM on 27 August, 2010 Why doesn't the Armagh Observatory have records since 2002?? They have them, it's just data beyond 2002 are not processed like this. In fact daily data in the archive are in a reasonable format only since July 2000, prior to that date they only have the scanned images of handwritten forms. Anyway, it is imperative not to go beyond 2002, because monthly temperature anomalies (relative to 1930-1989 means) recovered from the archive look like this between July 2000 and 2010: As you can see, after 2002 Armagh Observatory is cooling at an alarming rate of 13.2°C/century.
-
Peter Hogarth at 21:38 PM on 27 August 2010Arctic sea ice... take 2
HumanityRules at 09:43 AM on 27 August, 2010 There is also an update (to April 2010) of the Maslanik and Fowler 2007 "age of ice" animation which these guys kindly did for me in the second article on Arctic sea ice. As older ice is generally thicker, this is pertinent. -
Ned at 21:23 PM on 27 August 2010Comparing volcanic CO2 to human CO2
RSVP: Total emissions since 1750 from fossil fuels and cement production are 337 GT carbon (from ORNL-DAAC). Note that this is equivalent to 92 GT of CO2. If all of this accumulated in the atmosphere, it would represent an increase of 158 ppmv CO2 (2.13 GT carbon per 1 ppmv CO2). However, quite a bit goes into the ocean, so the actual rise has only been about 112 ppmv so far. It's still quite an increase over the pre-industrial conditions: Figure 1: CO2 levels (parts per million) over the past 10,000 years. Blue line from Taylor Dome ice cores (NOAA). Green line from Law Dome ice core (CDIAC). Red line from direct measurements at Mauna Loa, Hawaii (NOAA).
-
Peter Hogarth at 21:21 PM on 27 August 2010Arctic sea ice... take 2
HumanityRules at 09:43 AM on 27 August, 2010 There are some more post 2007 articles in Arctic ice, a reality check. I have a small amount of even more recent information, but will try to collate this. There are however multiple smaller scale studies for ice thickness, using all sorts of methods, but difficult to draw arctic wide conclusions as thickness and melt rate are not uniform over the sea ice area. -
RSVP at 20:33 PM on 27 August 2010Comparing volcanic CO2 to human CO2
The presentation is straighforward and informative, yet something seems to be missing.. (i.e., another cloud graphic that represents some other major, yet natural source(s) of CO2). Supposedly, pre-Industrial Revolution CO2 levels were around 250 ppm, whereas now they are around 380 ppm, an increment ratio of 1.5:1. On the otherhand, according to the above, man-made fossil fuel emission is around 100 times that of volcanos. If one assumes nature is only equipped to absorb the CO2 emitted by volcanos, one would expect current CO2 ppm to be much higher. What exactly is not being explained here? -
Ned at 19:45 PM on 27 August 2010Increasing CO2 has little to no effect
Stylo, "more longwave radiation returning back to Earth" means "more than previously." The atmosphere still radiates in all directions, and John actually is referring to absorption/emission rather than reflection. Imagine an Earth with no greenhouse gases in its atmosphere. 100% of the thermal radiation leaving the surface and passing through the atmosphere goes upward and out into space. Now add a small concentration of greenhouse gases. A small part of that longwave radiation will be absorbed by GHG molecules, which will then emit energy in all directions, including downward. So now somewhat less than 100% of the thermal radiation within the atmosphere is moving in an upwards direction. And as you increase the concentration of GHGs, the downward component becomes correspondingly larger. The downward thermal IR flux is indeed caused by emittance, not reflectance.
Prev 2222 2223 2224 2225 2226 2227 2228 2229 2230 2231 2232 2233 2234 2235 2236 2237 Next


