


 Arguments


Recent Comments
Prev 2249 2250 2251 2252 2253 2254 2255 2256 2257 2258 2259 2260 2261 2262 2263 2264 Next
Comments 112801 to 112850:
-
johnd at 01:29 AM on 13 August 2010More evidence than you can shake a hockey stick at
doug_bostrom at 08:32 AM, regarding "Not only is global humidity rising with the warming trend as expected, even its year-to-year fluctuations match well with those of global temperature." The question I think it raises is "Is specific humidity tracking temperature, or is it instead temperature that is tracking specific humidity?" If the heat resident within the water vapour as a result of it's change of state on the earth's surface was to be removed from the equation, how much heat would be be left in the other components that comprise the atmosphere and how well would temperature track it? -
muoncounter at 00:55 AM on 13 August 2010Why I care about climate change
GC, #128: "The quality of science text books is critical when so few teachers have an adequate background in the subject." Oh, textbooks are important even when teachers have the requisite background; if only as an anchor against the fluctuating 'truthiness' one finds on wikipedia etal. That said, I live in one of the states that sets the textbook standards for the rest of the US; you have my profound apologies. "I hope you will want to support John Hubisz in his efforts to improve science text books:" I certainly enjoyed his comments on lab notebooks. #130: "Scientific consensus is worthless, especially when it is authoritarian and lacking in accountability or transparency." I'm not at all sure what you mean. Would you prefer that we act on ideas that are not supported by a consensus? If so, the folks at conservapedia have a bridge they'd like to sell. But authoritarian? Have you ever tried forcing an unsupported point through a room full of scientists? Good luck with that. An unmistakable sign of authoritarianism is the presence of an unthinking mob, ever-ready to take up 'four legs good, two legs bad,' rather than listen to something they don't want to hear. That kind of behavior is hardly ever seen here; but you do find it quite frequently among the Watts Up Doc crowd. So which side is authoritarian? -
Ken Lambert at 00:07 AM on 13 August 2010On Statistical Significance and Confidence
ABG #18 Your plots of random data points are very useful illustrations of what is and is not significant in curve fitting. The issue might be that we don't have 1000 sets of independent land and ocean temperature data to do the experiment. In fact the surface temperature data is obtained from basically only one raw data source (GCHN) with several software processors giving results and the RSS and UAH satellite data. Chris G #26 Useful points Chris. Indeed the temperature slopes in the past 60-100 years have been higher (through the 1920-1940 period perhaps?)and lower (1950-1980?). The issue remains that CO2GHG warming forcing is rising logarithmically with CO2 concentration; aerosols and cloud cooling has no representative Equation which I have seen (aerosol forcing strangely flatlines on the IPCC graphs); WV warming feedback is highly contentious with no agreed relationship I know of; radiative cooling is exponential with T^4; and the sun has many overlapping cycles, the shortest being the 11 year sinusoidal cycle which equates to about 25% of the claimed warming imbalance. My point is that the sum of all these warming and cooling forcings is highly likely to be non-linear - so the polynomial curve fit seems to make good sense of a complex relationship between energy imbalance and measured global temperatures. Now this might not suit the tidy linear world of the statistician - but it sure fits the highly non-linear real world. The polynomial fit from "Has Global Warming Stopped" looks like a flattening to me. Could I dare suggest that it looks cyclical - if not a bit sinusoidal?? As for the argument that models predict a noisy period where temperatures don't increase - well that defies the first law which dictates that the energy gained by the earth system from a warming imbalance must show up as a temperature increase somewhere in the system - and we have fought out long and hard elsewhere on this blog ("Robust warming of the Upper Oceans etc") - to show that it is not being measured in the oceans; and the overall energy budget is not anywhere near balanced for the claimed AGW imbalances. Obviously the place to look is at each warming and cooling forcing and see how 'robust' they really are. -
The Skeptical Chymist at 23:23 PM on 12 August 2010On Statistical Significance and Confidence
Barry @16 Although I'm no expert with stats I'll try to help a little. Q1 & 2 - Yes, sounds like you have got the gist of it. As for ANOVA, multiple regression etc I would suggest trying to get your head around these tests, what they do and what you tell you before being let loose with them. Not necessarily mathematically but certainly conceptually. Can anyone recommend some introductory material accessible via the web? -
Dikran Marsupial at 21:43 PM on 12 August 2010Why I care about climate change
Joining this thread a bit late, but here goes: I am also a practicing Christian ([Groucho] and believe me I need the practice! [/Groucho]), however religious people don't have a monopoly on wanting to "love thy neighbour" (and before anyone says "fnarr fnarr", this isn't "Carry on Climate Change", that's not what I meant! ;o). It is basically the golden rule, which is common to many ethical systems, both religious and secular. There is indeed no need to invoke motivators other than professional concern for humanities future, however that does not imply other well-meaning forms of motivation are a bad thing if they do actually motivate the correct action. My own motivation although I am a Christian is based on a golden rule style argument, and is not conciously of religious origin. Even if the effects of anthropogenic GHG emissions result in only a modest increase in temperatures, that may be enough to have serious consequences in places like Bangladesh, which are economically and agnriculturally already quite marginal. Unlike most of us in in places that are climatically stable (such as the UK) they are easily affected by climate change, and unlike most of us in the first world they do not necessarily have the resources to adapt. We in the first world have a responsibility for out past, present and future actions if they have a negative effect on others. We shouldn't need religious teachings to know that, it is merely justice. However that doesn't mean the religious teachings are not spot on in this case. -
michael sweet at 21:36 PM on 12 August 2010Three new studies illustrate significant risks and complications with geoengineering climate
This is the link to the scientific american blog: http://www.scientificamerican.com/blog/post.cfm?id=what-happens-when-coal-is-gone-2010-06-29 Here they say coal will last 200 years. -
michael sweet at 21:31 PM on 12 August 2010Three new studies illustrate significant risks and complications with geoengineering climate
Doug, Indeed, the authors conclusion is that the IPCC is being alarmist in their projections of CO2 release. "The real problem 40 years from 2009 will be an insufficient supply of fossil energy, not its overabundance, as the IPCC economists would have it." They do not discuss the need to access alternate energy supplies, which is required if fossil fuels run out. The primary author also told Bloomburg that the gulf oil gusher was probably only 20,000 barrels per day so no worries. That is now known to be 60,000 bpd. My impression is this is a new angle for skeptics: the coal is running out anyway so we might as well continue BAU. I have seen estimates all over the map on when peak coal will happen. scientific american blog on coal for example. The skeptics realize they are losing the "climate is not changing" argument with the temperatures this year and are looking for a new argument to support BAU. -
Dikran Marsupial at 18:53 PM on 12 August 2010On Statistical Significance and Confidence
kdkd@29 Indeed, Ken should read the paper by Easterling and Wehner (< \ href="http://dx.doi.org/10.1029/2009GL037810">here) which explains why we should expect to find occasional decadal periods with non-significant positive (or even negative) trends, even if there is a genuine consistent warming of the Earth. This is because things like ENSO shift heat between the oceans and atmosphere, creating year to year variability that masks the underlying trend and the trend is small in comparison to the magnitude of the variation. The shorter the period, the more likely you are to see a cooling trend. These are observed in the data, and they are reproduced in the models (although the models can't predict when they will happen, they do predict that they will happen every now and then). -
macoles at 18:18 PM on 12 August 2010Why I care about climate change
gallopingcamel @130 There will always be Doomsayers and Naysayers, the truth usually lies somewhere in the middle. Given the projections range from bad (warming continues at its current directly measurable rate) to extremely bad (warming accelerates as other positive feedbacks kick in), then the prudent thing is to work harder on improving the scientific knowledge - while at the same time pushing for action on reducing CO2. This is what the climate science "establishment" are trying to do. There is no need to invoke motivators other than professional concern for humanity's future. -
kdkd at 18:00 PM on 12 August 2010On Statistical Significance and Confidence
ChrisG #26 "Ken is applying a linear test for a positive slope over the most recent 10-12 year period, and, yes, it is failing." It's only failing if you take that data out of context and pretend that the most recent 10-12 period is independent of the most recent 13-50 year period. If you look at the trend of the last decade in context, it's no different to what we observe over the last 50-odd years. I've asked Ken elsewhere quite a few times what's so special about the last decade or so to make him reach his conclusion, but he can't or won't answer the question. -
Dikran Marsupial at 17:58 PM on 12 August 2010On Statistical Significance and Confidence
apeescape@25 I'm sure that Bayes factors are appropriate, I think the problem is in your calculation of the marginal likelihood for the H1 model (the prior doesn't exclude negative values for the slope AFAICS). If this is correct, you have basically performed a test that shows that the need for a slope is "conclusive" (on the usual interpretation scale), but that may be because negative slopes have a non-negligible likelihood (which is quite possible as the data are noisy). Chris G@26 - don't use the F-word when there are statisticians about!!! the data are "noisy" not "f****y". ;o) -
kdkd at 17:53 PM on 12 August 2010Why I care about climate change
scaddenp #133 I'm not sure I fully understand your comment. Although I'd take it on a case by case basis, I would tend to argue that consilience should cause us to relax our criterion for statistical significance, but I'd consider that on a case by case basis, given the hypothesised mechanism under investigation. -
John Brookes at 16:53 PM on 12 August 2010On Statistical Significance and Confidence
BTW, you can see more of Alden's excellent exposition on http://www.fool-me-once.com/. I enjoyed it a lot. -
Chris G at 15:45 PM on 12 August 2010On Statistical Significance and Confidence
OK, but because climate data is fuzzy, it is all statistics whether you phrase it in mathematical terms or terms less mathematical. It's all means, standard deviations, variances, variance of the variances, etc. I could just as easily have said that Ken is applying a linear test for a positive slope over the most recent 10-12 year period, and, yes, it is failing. If that were the only period where that test failed, his inferences from the statistics would have more merit. However, that same test would also have failed for multiple periods in the past. Despite these deviations from the longer term slope, the longer term trend has continued. The current deviation of the slope from the 60- or 100-year mean slope is within the range of deviations we have seen over that same time period. So, there is little chance that the deviation of the slope in the last 10-12 years from the mean of the slope over the last 60 years represents something we haven't seen before, rather than a deviation induced by other factors, which we have seen before, and in the past have been short term effects. Ken is saying, 'See this difference in the characteristics of the data; it means something important has changed.' I'm saying, 'The difference you are pointing out is less than or equal to differences that have been observed in the past; there's no reason to believe anything important has changed.' To me, it all means the same thing. -
apeescape at 15:08 PM on 12 August 2010On Statistical Significance and Confidence
Alden, it looks like Bayes Factors are not applicable in this case, so never mind about my previous comment. FWIW, I got a 95.5% probability that the slope > 0 using Bayesian methods with non-informative priors. The following are the frequentist, Bayesian and HPD 95% intervals respectively (w/ 91.3, 91.0, 94.1 highest two-sided interval that doesn't include 0): ## 2.5 % 97.5 % ## [1,] -0.001850243 0.02358596 ## [2,] -0.002304537 0.02224490 ## [3,] -0.001311965 0.02317616 -
scaddenp at 14:54 PM on 12 August 2010Why I care about climate change
"Having said that, demanding p <= 0.001 might result in throwing out a lot of otherwise convergent evidence due to excessive zeal." And ignoring the wee issue about convergent evidence which would be that 'what is probability that null hypothesis is true, GIVEN all the lines of prediction that fall within say 2 sigma?'. The consilience question. I would have to say though that determining the full size of the uncertainties remains an issue. -
kdkd at 14:37 PM on 12 August 2010Why I care about climate change
I assume that the 3 sigma level means more conventionally that the null hypothesis should be rejected if p > 0.001 or thereabouts. This is not the generally recognised convention - depending on the domain p <= 0.01, 0.05 or in the really messy sciences 0.1 is closer to the mark. Outside of of laboratory physics demanding p values of 0.001 or lower is far too stringent. Don't believe me? Ask any statistician. Having said that, demanding p <= 0.001 might result in throwing out a lot of otherwise convergent evidence due to excessive zeal. -
scaddenp at 14:08 PM on 12 August 2010Why I care about climate change
GC - If there is one thing that climate science is not afraid of is making predictions. Temperature trends, patterns of warming, changes in humidity, changes in DLR and OLR, etc etc. And you look at the data and the predictions match. ANY scientific hypothesis, Einstein included, aims to make a both a prediction and make a statement about the expected range that uncertainties imply. Every measurement has an error associated with it so you compare on that basis. Climate prediction does fine on that basis. What the hell is 3 sigma precision? I assume you mean that null hypothesis can be rejected at 3 sigma level? Where is your problem then? The biggest beef really is that climate models don't do sub-decadal predictions and that you have wait 30 years for checking of SOME elements. The predictions for pattern, LR etc are spot on - what prediction isnt? Oh wait, the strawman non-predictions on various misinformation sites? This at very least has to tell you that there are significant risks that AGW is correct. Now "catastropophic AGW" is erecting another straw man. What is your scientific definition of catastrophic? The theory tells you that for given forcing, you will get given climate. If the rate of climatic change for your estimate of likely forcings seems uncomfortable to you then that is a judgement for you to make. I think your point about past climate is also misplaced. Climate theory is about predicting climate from known forcings. The difficulty with the past is determining the forcings not the climate systems response to forcings. The current climate models do extremely good job of explaining past climate given best guess for those forcings. The idea that governments are supporting climate scientist to create lies to support their nefarious schemes is ludicrous - leave that to tinfoil hat crowd please. This supposes that climate scientists in numerous groups in numerous countries are of one political persuasion and these governments are in collusion. A better understanding is to say that scientists worldwide are struggling desperately to get their governments to appreciate the risks that climate change pose, hampered by disinformation from established interests. "lacking accountability or transparency" - that is the limit. Climate science operates the most extraordinary environment with unprecedented levels of scrutiny and transparency. I am glad I am not having to work in such a fishbowl. Authoritarian? What authority? Just for moment, imagine it is all true and think how would anything be different. -
gallopingcamel at 13:18 PM on 12 August 2010Why I care about climate change
macoles (#129), I think you have it backwards. Science progresses by a series of testable hypotheses. I gave some examples in #128 of ways that Einstein's hypotheses have been tested. Although these tests appear to support the concept of general relativity, Einstein was well aware that such experiments do not prove him right, whereas a single experiment can prove him wrong. The climate scientists who preach Catastrophic Global Warming lack Albert's humility and act as though their fuzzy hypotheses have been proven beyond all shadow of doubt. Yet the predictive power of their theories is so weak that they cannot even explain past climates. Don't try to pretend that this nonsense is somehow comparable with the hard sciences which strive for 3 sigma or better precision. Scientists pushing CAGW are strongly supported by governments around the world. The danger is that this powerful political support may turn out to be Lysenkoism mutated into a much more virulent form. Scientific consensus is worthless, especially when it is authoritarian and lacking in accountability or transparency. Oops! The ghost of Urban VIII just mooned me. -
macoles at 12:11 PM on 12 August 2010Why I care about climate change
gallopingcamel @128 It is a noble thing to question, and a necessary thing to question authority, but by what measure do you judge the answers? Science (when properly conducted) provides the best answers for the questions that are within the empirical realm. Outside of the empirical realm science can only make hypothesis. The many physical phenomena that contribute to the global climate are well within the empirical realm. Perhaps your arguement isn't with the science, but the method by which scientific concensus is arrived? -
Doug Bostrom at 09:12 AM on 12 August 2010Three new studies illustrate significant risks and complications with geoengineering climate
Unfortunately Eclipse I suspect a lot of folks are going to look at that coal resource assessment and conclude there's no problem, someday in the vague and hazy future the coal will be gone, so what?. It's easy to worry neither about the climate nor about what we're going to do when the fossil fuel party is over. Both problems suffer from being abstract and not immediately visible in front of our noses, as well as being worrisome and messy and thus better pushed under our mental rug. A perfect storm in the risk perception world. -
Eclipse at 08:41 AM on 12 August 2010Three new studies illustrate significant risks and complications with geoengineering climate
If the following is true it will force us into action! Once we pass a peak in oil, gas, and now even coal, surely the economics of these resources change and will encourage a desperate rush to cheap GenIV nuclear reactors that eat nuclear waste? Check it out: yet another study that indicates we are closer to peak coal than anyone would imagine. Green Car Congress: Study Concludes Peak Coal Will Occur Close to 2011. -
Doug Bostrom at 08:32 AM on 12 August 2010More evidence than you can shake a hockey stick at
A plethora of data to explore: Dynamic climate indicators visualization via NCDC. Speaking of the humidity data available from NCDC, Tamino notices something begging a question: Not only is global humidity rising with the warming trend as expected, even its year-to-year fluctuations match well with those of global temperature. This is extremely strong evidence that, just as expected both from computer models and from basic physics, the dominant factor in global humidity is global temperature. It also raises a question for those who doubt the correctness of observed global temperature increase: if (as so many denialists claim) the globe isn’t warming because the global temperature estimates are wrong, then why does the specific humidity track it so well? Any bets on how long it takes someone to suggest that the increase in global humidity isn’t real — that the data are wrong and the apparent increase is only due to the “urban wet island” effect? -
batsvensson at 08:13 AM on 12 August 2010Waste heat vs greenhouse warming
@ doug_bostrom at 12:16 PM on 10 August, 2010 Doug, I love to, but a) the topic is OT, and b) I did address that question in another post but that post was deleted by the moderators, and c) it is not only pointless, but also a waste of my time and energy to try to establish any what so ever fruitful communication here as about half of my comments I post gets deleted by the moderator team. The only recommendation I can give, is to check the references I gave in an earlier post, but for your convenience that post was deleted as well. -
Doug Bostrom at 07:48 AM on 12 August 2010It's cooling
Voila, Charles. -
Charles Higley at 07:43 AM on 12 August 2010It's cooling
It is surely curious that the chart of ocean temperature stops at 2005. The oceans have been clearly cooling since 2006. How about an update and a new discussion?Response: It's a good question - I actually asked the same question to Dan Murphy, author of the paper where the total heat content data comes from (from Figure 1 above). The data actually ends in 2003. This is because the ocean heat data taken from Domingues et al. 2008 ends in 2003. This is why I post the von Schuckmann data in Figure 2 - this continues onto 2008. -
Doug Bostrom at 07:29 AM on 12 August 2010Grappling With Change: London and the River Thames
Pete, I don't see any points of disagreement to resolve with you, only some repetitions of things I mentioned in my article and from which some folks may derive comfort, and some speculations on your part. As to your question about the contribution of isostatic adjustment to local sea level rise, earlier in this thread of comments that question came up. Answer: Indeed the whole southern coast of England is sinking dorlomin. The rate varies by location; near London it's dropping at a pretty good clip of 0.5mm/yr. -
Pete Ridley at 07:19 AM on 12 August 2010Grappling With Change: London and the River Thames
Doug, getting back to your article, in which you address a long-standing battle between nature and humans – flooding - let’s try to resolve some points of disagreement (which may arise from the interpretation of words rather differences of opinion. You say in your article “It's notable that of the thousands of pages of assessment and planning documents associated with future London flood management there is essentially no mention of anthropogenic causes for climate change, naturally so because cause has nothing to do with response when cause is outside of the control of planners”. Of course there is another way to explain that lack of any mention of humans causing climate change. Perhaps the authors saw no convincing evidence that any such changes were at all significant. One thing that puzzles me is that London was established as a major urban area around AD 70 and has grown rapidly since (Note 1) with the population peaking in the 1940s. During those 2000 years we are led to believe that global mean temperature rose to a peak about AD 1300, fell to a low about AD1600 and has been rising since. In 1990 the IPCC was suggesting that the medieval period was hotter than in 1975 (Note 2) - but there is considerable debate about the extent and rate of increase occurring presently. Despite those higher medieval temperatures it was not until the damaging floods in 1928 and 1953 that consideration was given to the need for a “Thames Barrier” and that was not for protection from unusual downpours but “.. to prevent London from being flooded by exceptionally high tides and storm surges moving up from the sea” (Note 3). The Institute of Historical Research (Note 4) says “The lands bordering the tidal river Thames and the Thames Estuary have historically been highly vulnerable to marine flooding. The most severe of these floods derive from North Sea storm surges, when wind and tide combine to drive huge quantities of water against the coast, .. ”. This is substantiated by the Environmental Agency (Note 5). The London Regional Flood Risk Appraisal – October 2009 (Note 6) talks about “ .. responding to potential increases in flood risk from urban development, land use change, and climate change .. ”. They put climate change at the end of the list, perhaps because of the enormous uncertainty about what changes will occur. The extent to which global mean temperatures will rise, fall or remain the same is unknown and climate change can only be speculated about. There are apparently two causes of rising water levels in that area: 1) post glacial tilting of the UK, up in the N & W and down in the S & E, 2) rise in the high water level (2mm/year). Although the last ice age is long gone the effects of the weight of all that extra ice are still with us, including the restoration of equilibrium to the land. It is suggested (Note 7) that “Today, typical uplift rates are of the order of 1 cm/year or less” which suggests that sink rates are of the same order. I wonder how much of the mean sea level change (3mm/yr approx?) estimated using tide gauge measurements results from this sinking rather than from any global warming. Can anyone link to a study covering this? NOTES: 1) see http://en.wikipedia.org/wiki/History_of_London 2) see http://www.uoguelph.ca/~rmckitri/research/NRCreport.pdf 3) see http://en.wikipedia.org/wiki/Thames_Barrier 4) see http://www.history.ac.uk/projects/tidal-thames 5) see http://www.environment-agency.gov.uk/homeandleisure/floods/117047.aspx 6) see http://static.london.gov.uk/mayor/strategies/sds/docs/regional-flood-risk09.pdf 7) see http://en.wikipedia.org/wiki/Post-glacial_rebound Best regards, Pete Ridley -
Doug Bostrom at 06:29 AM on 12 August 2010Models are unreliable
Yeah, Pete: circumspect, conservative. Hargreaves notes that Hansen's 1988 model passes the "null hypothesis" test but does not leap to any conclusions about "all the models are really great." -
Pete Ridley at 05:39 AM on 12 August 2010Models are unreliable
Doug, thanks for that link to Julia Hargreaves’s paper. I wholeheartedly agree with her conclusion that “Uncertainty analysis is a powerful, and under utilized, tool which can place bounds on the state of current knowledge and point the way for future research, but it is only by better understanding the processes and inclusion of these processes in the models that the best models can provide predictions that are both more credible and closer to the truth”. There’s a lot more research to be done into obtaining a proper understanding of those horrendously complicated and poorly understood global climate processes and drivers before any reliable models can be constructed and used for predictions. Best regards, Pete Ridley -
Chris G at 05:25 AM on 12 August 2010On Statistical Significance and Confidence
#12 Ken Lambert, It is well known that CO2 is not the only influence on the earth's energy content. As temperature has a reasonably good relationship with energy content (leaving out chemical or phase changes), it is reasonable to use air temperatures to some extent. (Ocean temps should be weighed far more heavily than air temps, but regardless...) If you pull up any reputable temperature graph, you will see that there have been about 4 to 6 times in the past 60 years where the temperature has actually dipped. So, according to your logic GW has stopped 4 to 6 times already in the last 60 years. However, it continues to be the case that every decade is warmer than the last. What I find slightly alarming is that, despite the sun being in an usually long period of low output, the temperatures have not dipped.Moderator Response: Rather than delve once more into specific topics handled elsewhere on Skeptical Science and which may be found using the "Search" tool at upper left, please be considerate of Alden's effort by trying to stay on the topic of statistics. Examples of statistical treatments employing climate change data are perfectly fine, divorcing discussion from the thread topic is not considerate. Thanks! -
Chris G at 05:13 AM on 12 August 2010On Statistical Significance and Confidence
#14 Arkadiusz Semczyszak, "Why exactly 15 years?" Good question. The answer is that the person asking the question of Phil Jones used the range 1995-2009, knowing that if he used the range 1994-2009, Dr. Jones would have been able to answer 'yes' instead of 'no'. -
Doug Bostrom at 04:10 AM on 12 August 2010Models are unreliable
Pete, regarding validation you ought to take a look at Hargreaves' remarks here. Concerning that item, be sure also to read Annan's remarks here where as you can see he leads us to the conclusion that making broad condemnatory statements about purported lack of model utility is not circumspect. -
Pete Ridley at 03:47 AM on 12 August 2010Models are unreliable
Well that comment of mine on 11th August @ 07:12 did elicit some interesting responses but, as Doug acknowledged @ 08:03 “you won't find a refutation to M&M 2010 coming from here”. I think that Doug’s contribution @ 14:10 offered the best read, at friend James’s blog (Note 1). There are lots of interesting comments there, the one that I found most appropriate being from Ron Cram on 12th August @ 01:10 QUOTE: Gavin writes "It is also perhaps time for people to stop trying to reject 'models' in general, and instead try and be specific." People are not trying to reject models in general. It has already been done. Generally speaking commenters are bringing up points already published in Orrin Pilkey's book "Useless Arithmetic: Why Environmental Scientists Can't Predict the Future." Nature is simply too chaotic to be predicted by mathematical formulas, no matter how sophisticated the software or powerful the hardware. None of the models relied on by the IPCC have been validated. It is fair to say the models are non-validated, non-physical and non-sensical. Perhaps it is time to quit pretending otherwise UNQUOTE. NOTE: 1) see http://julesandjames.blogspot.com/2010/08/how-not-to-compare-models-to-data-part.html#comments Best regards, Pete Ridley -
John Russell at 03:08 AM on 12 August 2010On Statistical Significance and Confidence
ABG at 01:29 AM on 12 August, 2010 Thanks, Alden. I actually understood exactly what you're getting at. Whether I can remember and apply it in future is another matter! -
CBW at 01:58 AM on 12 August 2010On Statistical Significance and Confidence
BP @17: Nice. That level of disingenuousness must be applauded. Using a plot of localized ENSO-related temperature anomaly to suggest that the oceans are losing heat is pure genius. Anyone interested in the source and significance of BP's plot is directed here. See, in particular, the "Weekly ENSO Evolution, Status, and Prediction Presentation." -
CBW at 01:40 AM on 12 August 2010On Statistical Significance and Confidence
Ken Lambert @12: No scientist who studies climate would use 10 or 12 years, or the 15 in the OP, to identify a long-term temperature trend. For reasons that have been discussed at length many times, here and elsewhere, there is quite a bit of variance in annualized global temperature anomalies, and it takes a longer period for reliable (i.e., statistically significant) trends to emerge. Phil Jones was asked a specific question about the 15-year trend, and he gave a specific answer. Alden Griffith was explaining what he meant. Neither, I believe, would endorse using any 15-year period as a baseline for understanding climate, nor would most climate scientists. The facts of AGW are simple and irrefutable: 1. There are multiple lines of direct evidence that human activity is increasing the CO2 in the atmosphere. 2. There is well-established theory, supported by multiple lines of direct evidence, that increasing atmospheric CO2 creates a radiative imbalance that will warm the planet. 3. There are multiple lines of direct evidence that the planet is warming, and that that warming is consistent with the measured CO2 increase. One cannot rationally reject AGW simply because the surface temperature record produced by one organization does not show a constant increase over whatever period of years, months, or days one chooses. The global circulation of thermal energy is far too complex for such a simplistic approach. The surface temperature record is but one indicator of global warming, it is not the warming itself. When viewed over a period long enough to provide statistical significance, all of the various surface temperature records indicate global warming. -
Alexandre at 01:29 AM on 12 August 2010On Statistical Significance and Confidence
I bet you can get low-ish significance trends in any short interval in the last half century. There's nothing special in the "lack of significance" of this recent period. One could claim forever that "the last x years did not reach 95% significance". -
Alden Griffith at 01:29 AM on 12 August 2010On Statistical Significance and Confidence
John Russell: You're not alone! Statistics is a notoriously nonintuitive field. Instead of getting bogged down in the details, here's perhaps a more simple take home message: IF temperatures are completely random and are not actually increasing, it would still be rather unlikely that we would see a perfectly flat line. So I've taken the temperature data and completely shuffled them around so that each temperature value is randomly assigned to a year: So here we have completely random temperatures but we still sometimes see a positive trend. If we did this 1000 times like John Brookes did
the average random slope would be zero, but there would be plenty of positive and negative slopes as well.
So the statistical test is getting at: is the trend line that we actually saw unusual compared to all of the randomized slopes? In this case it's fairly unusual, but not extremely.
To get at your specific question - the red line definitely fits the data better (it's the best fit, really). But that still doesn't mean that it couldn't be a product of chance and that the TRUE relationship is flat.
[wow - talking about stats really involves a lot of double negatives... no wonder it's confusing!!!]
-Alden
So here we have completely random temperatures but we still sometimes see a positive trend. If we did this 1000 times like John Brookes did
the average random slope would be zero, but there would be plenty of positive and negative slopes as well.
So the statistical test is getting at: is the trend line that we actually saw unusual compared to all of the randomized slopes? In this case it's fairly unusual, but not extremely.
To get at your specific question - the red line definitely fits the data better (it's the best fit, really). But that still doesn't mean that it couldn't be a product of chance and that the TRUE relationship is flat.
[wow - talking about stats really involves a lot of double negatives... no wonder it's confusing!!!]
-Alden
-
Berényi Péter at 01:27 AM on 12 August 2010On Statistical Significance and Confidence
#13 CBDunkerson at 00:09 AM on 12 August, 2010 We must see rising temperatures SOMEWHERE within the climate system. In the oceans for instance. Nah. It's coming out, not going in recently. -
barry1487 at 01:01 AM on 12 August 2010On Statistical Significance and Confidence
Discussing trends and statistical significance is something that I attempt to do - with no training in statistics. All I have learned from various websites over the last few years is conceptual, not mathematical. I would appreciate anyone with sufficient qualifications straightening out any misconceptions re the following: 1) Generally speaking, the greater the variance in the data, the more data you need (in a time series) to achieve statistical significance on any trend. 2) With too-short samples, the resulting trend may be more an expression of the variability than any underlying trend. 3) The number of years required to achieve statistical significance in temperature data will vary slightly depending on how 'noisy' the data is in different periods. 4) If I wanted to assess the climate trend of the last ten years, a good way of doing it would be to calculate the trend from 1980 - 1999, and then the trend from 1980 - 2009 and compare the results. In this analysis, I am using a minimum of 20 years of data for the first trend (statistically significant), and then 30 years of data for the second, which includes the data from the first. (With Hadley data, the 30-year trend is slightly higher than the 20-year trend) Aside from asking these questions for my own satisfaction, I'm hoping they might give some insight into how a complete novice interprets statistics from blogs, and provide some calibration for future posts by people who know what they're talking about. :-) If it's not too bothersome, I'd be grateful if anyone can point me to the thing to look for in the Excel regression analysis that tells you what the statistical significance is - and how to interpret it if it's not described in the post above. I've included a snapshot of what I see - no amount of googling helps me know which box(es) to look at and how to interpret.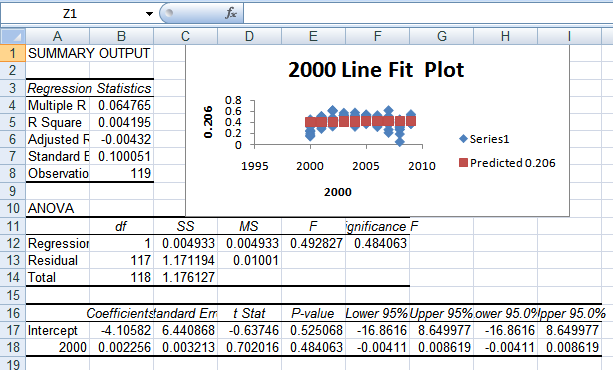
-
Alden Griffith at 00:59 AM on 12 August 2010On Statistical Significance and Confidence
Stephan Lewandowsky: I used the Bayesian regression script in Systat using a diffuse prior. In this case I did not specifically deal with autocorrelation. We might expect that over such a short time period, there would be little autocorrelation through time which does appear to be the case. You are right that this certainly can be an issue with time-series data though. If you look at longer temperature periods there is strong autocorrelation. apeescape: I'm definitely not a Bayesian authority, but I'm assuming you're asking whether I examined this in more of a hypothesis testing framework? No - in this case I just examined the credibility interval of the slope. Ken Lambert: please read my previous post -Alden -
Arkadiusz Semczyszak at 00:12 AM on 12 August 2010On Statistical Significance and Confidence
Since we are at the basis of statistics. I studied a “long three years” statistics in ecology and agriculture. Why exactly 15 years? I have written repeatedly that the counting period for the trend may not be in the decimal system, because in this system is not running type noise variability: EN(LN) SO, etc. For example, trends AMO 100 and 150 years combined with the negative phase of AMO positive "improving "results. The period for which we hope the trend must have a deep reason. While in the above-mentioned cases (100, 150 years), the error is small, in this particular case ("flat" phase of the AMO after a period of growth for 1998 - an extreme El Nino), the trend should be calculated from the same phase of EN(LN)SO after a period of reflection after the extreme El Nino, ie after 2001., or remove the "noise": extreme El Nino and the "leap" from cold to warm phase AMO. This, however, and so may not matter whether you currently getting warmer or not, once again (very much) regret tropical fingerprint of CO2 (McKitrick et al. - unfortunately published in Atmos Sci Lett. - here, too, went on statistics, including the selection of data) -
CBDunkerson at 00:09 AM on 12 August 2010On Statistical Significance and Confidence
Ken Lambert #12 wrote: "The answer is that the temperatures look like they have flattened over the last 10-12 years and this does not fit the AGW script!" This is fiction. Temperatures have not "flattened out"... they have continued to rise. Can you cherry pick years over a short time frame to find flat (or declining!) temperatures? Sure. But that's just nonsense. When you look at any significant span of time, even just the 10-12 years you cite, what you've got is an increasing temperature trend. Not flat. "With an increasing energy imbalance applied to a finite Earth system (land, atmosphere and oceans) we must see rising temperatures." We must see rising temperatures SOMEWHERE within the climate system. In the oceans for instance. The atmospheric temperature on the other hand can and does vary significantly from year to year. -
Ken Lambert at 00:00 AM on 12 August 2010On Statistical Significance and Confidence
Alden # Original Post We can massage all sorts of linear curve fits and play with confidence limits to the temperature data - and then we can ask why are we doing this? The answer is that the temperatures look like they have flattened over the last 10-12 years and this does not fit the AGW script! AGW believers must keep explaining the temperature record in terms of linear rise of some kind - or the theory starts looking more uncertain and explanations more difficult. It it highly likely that the temperature curves will be non-linear in any case - because the forcings which produce these temperature curves are non-linear - some and logarithmic, some are exponential, some are sinusoidal and some we do not know. The AGW theory prescribes that a warming imbalance is there all the time and it is increasing with CO2GHG concentration. With an increasing energy imbalance applied to a finite Earth system (land, atmosphere and oceans) we must see rising temperatures. If not, the energy imbalance must be falling - which either means that radiative cooling and other cooling forcings (aerosols and clouds) are offsetting the CO2GHG warming effects faster that they can grow, and faster than AGW theory predicts. -
Dikran Marsupial at 23:36 PM on 11 August 2010On Statistical Significance and Confidence
I'm going to have a go at explaining why the 1 - the p-value is not the confidence that the alternative hypothesis is true in (only) slightly more mathematical terms. The basic idea of a frequentist test is to see how likely it is that we should observe a result assuming the null hypothesis is true (in this case that there is no positive trend and the upward tilt is just due to random variation). The less likely the data under the null hypothesis, the more likely it is that the alternative hypothesis is true. Sound reasonable? I certainly think so. However, imagine a function that transforms the likelihood under the null hypothesis into the "probability" that the alternative hypothesis is true. It is reasonable to assume that this function is strictly decreasing (the more likely the null hypothesis the less likely the alternative hypothesis) and gives a value between 0 and 1 (which are traditinally used to mean "impossible" and "certain"). The problem is that other than the fact it is non-decreasing and bounded by 0 and 1, we don't know what that function actually is. As a result there is no direct calibration between the probability of the data under the null hypothesis and the "probability" that the alternative hypothesis is true. This is why scientists like Phil Jones say things like "at the 95% level of significance" rather than "with 95% confidence". He can't make the latter statement (although that is what we actually want to know) simply because we don't know this function. As a minor caveat, I have used lots of "" in this post because under the frequentist definition of a probability (long run frequency) it is meaningless to talk about the probability that a hypothesis is true. That means in the above I have been mixing Bayesian and frequentist definitions, but I have used the "" to show where the dodgyness lies. As to simplifications. We should make things a simple as possible, but not more so (as noted earlier). But also we should only make a simplification if the statement remains correct after the simplification, and in the specific case of "we have 92% confidence that the HadCRU temperature trend from 1995 to 2009 is positive" that simply was not correct (at least for the traditional frequentists test). -
andrewcodd at 23:29 PM on 11 August 2010On Statistical Significance and Confidence
"While this whole discussion comes from one specific issue involving one specific dataset, I believe that it really stems from the larger issue of how to effectively communicate science to the public. Can we get around our jargon? Should we embrace it? Should we avoid it when it doesn’t matter? All thoughts are welcome…" More research projects should have metanalysis as a goal. The outcomes of which should be distilled ala Johns one line responses to denialist arguments and these simplifications should be subject to peer review. Firtsly by scientists but also sociologists, advertising executives, politicians, school teachers, etc etc. As messages become condensed the scope for rhetoricical interpretation increases. Science should limit its responsability to science but should structure itself in a way that facilitates simplification. I think this is why we have political parties, or any comitee. I hope the blogsphere can keep these mechanics in check. The story of the tower of babylon is perhaps worth remembering. It talks about situation where we reach for the stars and we end up not being able to communicate with one another. -
Dikran Marsupial at 23:20 PM on 11 August 2010On Statistical Significance and Confidence
John Russell If it is any consolation, I don't think it is overly contraverisal to suggest that there are many (I almost wrote majority ;o) active scientists who use tests of statistical significance every day that don't fully grasp the subtleties of underlying statistical framework. I know from my experience of reviewing papers that it is not unknown for a statistican to make errors of this nature. It is a much more subtle concept that it sounds. chriscanaris I would suggest that the definition of an outlier is another difficult area. IMHO there is no such thing as an outlier independent of assumtions made regarding the process generating the data (in this case, the "outliers" are perfectly consistent with climate physics, so they are "unusual" but not strictly speaking outliers). The best definition of an outlier is an observation that cannot be reconciled with a model that otherwise provides satisfactory generalisation. ABG Randomisation/permutation tests are a really good place to start in learning about statistical testing, especially for anyone with a computing background. I can recommend "Understanding Probability" by Henk Tijms for anyone wanting to learn about probability and stats as it uses a lot of simulations to reinforce the key ideas, rather than just maths. -
Alden Griffith at 23:05 PM on 11 August 2010On Statistical Significance and Confidence
John Brooks: yes, this is definitely one way to test significance. It's called a "randomization test" and really makes a whole lot of sense. Also, there are fewer assumptions that need to be made about the data. However, the reason that you are getting lower probabilities is that you are conducting the test in a "one-tailed" manner, that is you are asking whether the slop is greater instead of whether it is simply different (i.e. could be negative too). Most tests should be two-tailed unless you have your specific alternative hypothesis (positive slope) before you collect the data. -Alden p.s. I'll respond to others soon, I just don't have time right now. -
adelady at 22:44 PM on 11 August 2010Models are unreliable
rcglinski. Not precipitation and not a century, but this item gives a really neat alignment of humidity over the last 40 years. I've not followed the references through, but you might find some leads to what you're after if you do. http://tamino.wordpress.com/2010/08/08/urban-wet-island/#comments
Prev 2249 2250 2251 2252 2253 2254 2255 2256 2257 2258 2259 2260 2261 2262 2263 2264 Next


