


 Arguments


Recent Comments
Prev 2251 2252 2253 2254 2255 2256 2257 2258 2259 2260 2261 2262 2263 2264 2265 2266 Next
Comments 112901 to 112950:
-
Sea level rise: the broader picture
Peter - Thanks for the update on the Wenzel paper. There definitely appears to be more data (and a much longer time period) in the 2010 paper than in their poster and web presentations from 2009, 2009. I had thought the 1.56mm/yr a bit low for the current rate, but that makes sense for the overall 20th century rate. -
Ned at 22:55 PM on 30 August 2010The empirical evidence that humans are causing global warming
I'm not sure under what circumstances "nights warm faster than days". Nights tend to cool down and days tend to warm up. Yes, but nights in the 2000s are warmer than nights in the 1990s, which were warmer than nights in the 1980s, which in turn were warmer than nights in the 1970s. That is nighttime warming. Predictions suggest that this process should happen faster than the similar warming of daytime temperatures, and observations confirm this. -
mscavazz at 22:54 PM on 30 August 2010Pakistan flood: many more will die unless more aid is delivered quickly
JMurphy, NASA and NOAA bulletins about strong La Nina, COMBINED to unusual position and stay of polar jet-stream, strongly suggest these two phenomenon are the main causes of this exceptional rainfall (and warm & dry climate over russia due to same jet-stream anomaly). -
Jaydee at 22:46 PM on 30 August 2010The empirical evidence that humans are causing global warming
I think this needs clarification "7. An increased greenhouse effect would make nights warm faster than days, and this is what has been observed." I'm not sure under what circumstances "nights warm faster than days". Nights tend to cool down and days tend to warm up. -
Anne-Marie Blackburn at 22:44 PM on 30 August 2010The empirical evidence that humans are causing global warming
kampmannpeine, You might be interested in reading this post on cosmic rays. Current evidence strongly suggests that cosmic rays are unlikely to be responsible for warming in the past 30 years. -
Peter Hogarth at 22:20 PM on 30 August 2010Sea level rise: the broader picture
HumanityRules at 14:03 PM on 30 August, 2010 (and comments 12 and 13) Thanks for this paper ( Wenzel 2010). Only 56 tide gauge sites were used in this study (which is justified in the methodology), and roughly half of these have data from before 1940, and roughly a third before 1930. These ratios are not really unusual, but there are obviously far more tidal stations in the full global network. This goes some way to explain differences in the pre-1950 period in this backpropagation technique compared with other methods, and the authors recognize this weakness as increased error before 1950 (pg 9) and note that their result is similar to that of Holgate 2007, which also used a small number of tide gauges. I believe the authors have factored in isostatic effects and back-estimating this is an inherent part of their method. In the presentation they arrive at an overall 20th century rise (ie for the entire period) of 1.56mm/yr which is in very good agreement with previous work. The confusion here (I think) is their reference to acceleration. In their paper they refer to 20th century acceleration (referring to the pre 1950 differences). It is the late 20th century acceleration to values of around 3.3 mm/yr (with GIA correction, as measured by both tide gauges and satellite altimeters, which has been the topic of discussion on this site and others. See free access Nerem 2010, and Leuliette 2010 for latest altimetry updates, and also see Wenzel 2010 figure 9a). This should clarify matters. -
JMurphy at 22:17 PM on 30 August 2010Long Term Certainty
thingadonta wrote : "Switching to renewable energies will 'create jobs', but at a higher cost to consumers and the taxpayer. Many such jobs are actually subsidised, by the taxpayer or otherwise. Many green groups have a hard time understanding this, becuase their jobs are also subsidised, they dont pay for themselves- they rely on society's good will to exist. This generally doesnt happen in oil and coal." Certainly not in America, judging by these reports : Energy Subsidies and Support by Type and Fuel (million 2007dollars) Coal/Refined Coal/Natural Gas/Petroleum Liquids - 5451 Nuclear - 1267 Renewables - 4875 Subsidy and Support per Unit of Production (dollars/megawatthour) Coal - 0.44 Refined Coal - 29.81 Natural Gas & Petroleum Liquids - 0.25 Nuclear - 1.59 Solar - 24.34 Wind - 23.37 "For example, even though coal receives more subsidies in absolute terms than wind power, the use of wind is likely to be more dependent on the availability of subsidies than the use of coal." Federal Financial Interventions and Subsidies in Energy Markets 2007 The largest U.S subsidies to fossil fuels are attributed to tax breaks that aid foreign oil production, according to research released by ELI. The study, which reviewed fossil fuel and energy subsidies for Fiscal Years 2002-2008, reveals that the lion’s share of energy subsidies supported energy sources that emit high levels of greenhouse gases. Fossil fuels benefited from approximately $72 billion over the seven-year period, while subsidies for renewable fuels totaled only $29 billion. Estimating U.S. Government Subsidies to Energy Sources: 2002-2008 Do you have actual figures and evidence that you can link to that goes against the above ? -
kampmannpeine at 22:10 PM on 30 August 2010The empirical evidence that humans are causing global warming
Thanks James, this was really helpful. I am trying to follow the peer reviewed literature on these issues which sometimes is difficult because not all these papers are publicly available without cost - althoug I have some kind of access to a library service... What I am missing is an open discussion on the effects which Svensmark discovered (Starry influence on cloud creation due to cosmic ray control thus increasing or decreasing the albedo). I recently read his book (published in 2007 - together with Calder) and it looks as if most of his arguments have strong weight ... So a combination of greenhouse effect which nobody negates and the cosmic ray effects might be a way to consider the causes of climate change ... -
johnd at 22:08 PM on 30 August 2010Why we can trust the surface temperature record
Peter Hogarth at 09:46 AM, whilst different cloud cover data sets may be differing in what they are measuring, as the graph shows there is quite a degree of variation, and depending on the type of clouds, any variation will either vary the incoming solar radiation, or the outgoing thermal radiation, or both. Given that clouds cover about 2/3 of the earths surface, a small change in coverage makes a significant difference, a change of about 5 percent roughly corresponds to a significant radiative net change of about 0.9 W/m2. -
JMurphy at 21:53 PM on 30 August 2010Pakistan flood: many more will die unless more aid is delivered quickly
mscavazz, although deforestation and bad land-cover decisions are, of course, important factors, how do you think these sort of tragedies can happen without an increase in precipitation (over a comparatively short space of time), and where do you think all that extra water is coming from ? -
johnd at 21:36 PM on 30 August 2010Why we can trust the surface temperature record
michael sweet at 23:10 PM, of course you are right, I was looking at it from the perspective of the precession rather than that of the calender. I had overlooked the leap years, and mans ability to change the calender and thus the climate, in a manner of speaking. However the precession continues it's cycle irrespective of mans adjusting the calender, but adjusting the calender so that defined seasons don't shift on the calender disguises the fact that oils ain't oils, in this case, the orientation of the planet is not the same each repeating solstice or equinox as perhaps more easily shown on this chart. Effects of axial precession on the seasons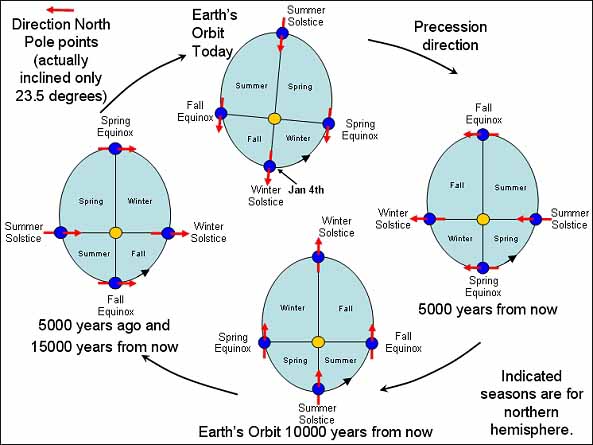 This figure illustrates the effects of axial precession on the seasons, relative to perihelion and aphelion. The precession of the equinoxes can cause periodic climate change because the hemisphere that experiences summer at perihelion and winter at aphelion (as the southern hemisphere does presently) is in principle prone to more severe seasons than the opposite hemisphere.
-
CBDunkerson at 21:03 PM on 30 August 2010Climate Models: Learning From History Rather Than Repeating It
johnd, we've had weather satellites for decades now. They've been able to track the changes in atmospheric water vapor, regional temperatures, clouds, precipitation, et cetera. We can also measure various positive and negative feedback effects of these clouds and precipitation... NONE of those measurements comes anywhere CLOSE (i.e. within an order of magnitude) of the positive feedback from water vapor. Nor does the net effect (which may even be positive). Ergo, NO they just aren't that important. Show me a measurement which even suggests that there could be a net negative feedback from 'downstream' effects (e.g. clouds, precipitation) of increased water vapor capable of offsetting a significant portion (i.e. 10%) of the positive feedback from water vapor and we'll talk. Until then it's all just vague hand-waving... and directly contradicted by the both the paleoclimate record and all measurements of the current ongoing climate change. -
CBDunkerson at 20:52 PM on 30 August 2010Arctic sea ice... take 2
Actually, based on PIOMAS, volume is ALREADY the lowest ever and has been since some time in the first half of August. The previous record (from last September) was 5,800 km^3, but if I'm reading the graphs right this year may hit 4,000 km^3. -
mscavazz at 19:34 PM on 30 August 2010Pakistan flood: many more will die unless more aid is delivered quickly
sorry JMurphy 24% was the %change rate/year. Its also the overall deforested % between 1990-2005. Not exactly what I wrote above, I admit, but as a result the 2.5% left is correct. see here My opinion for short, is that even with no global warming such tragedies would occur anyway due to deforestation and bad land-cover decisions. -
JMurphy at 19:13 PM on 30 August 2010Pakistan flood: many more will die unless more aid is delivered quickly
mscavazz wrote : "Pakistan has only 2.5% forest coverage. It was destroyed at a rate of 24%/year in the last 10 years. That's the main reason for human losses and damages." 24%/year in the last 10 years ? How come they still have 2.5% of it left, then ? Perhaps you'd better provide a link. Also, since much of the country is arid or semi-arid, and since AGW is making the country even warmer, deforestation will have to take its place as another cause of future tragedies related to AGW. -
mscavazz at 17:44 PM on 30 August 2010Pakistan flood: many more will die unless more aid is delivered quickly
sorry, missed the link: Biofuel demand driving Africa "land grab" : report Article here this is the real cause of future tragedies -
Peter Hogarth at 17:32 PM on 30 August 2010Ocean acidification threatens entire marine food chains
Agnostic at 11:44 AM on 30 August, 2010 I posted this elsewhere on the "acidification" thread, so sorry to repeat, but is pertinent here. The first deep basin observations of Aragonite undersaturation in surface waters have already been observed in 2008 Yamamoto-Kawai 2009, and in 2009 the extent of surface waters with undersaturated aragonite increased, although this is not yet region-wide. This means that these waters crossed the threshold where they are beginning to be corrosive to certain types of calcifying organisms. The trends in the Arctic regions have been a cause for concern for some time, Bates 2009 as the Arctic waters are subjected to the dual effects of decreasing alkalinity due to increasing pCO2 (directly due to uptake of the increasing atmospheric CO2 due to anthropogenic emissions), and increased sea ice meltwater due to increases in regional temperatures which are greater than the average global temperature rise. Models also predicted Aragonite undersaturation in these regions would occur in the near future, but the recent increased rate of ice melt has accelerated the process Steinacher 2009. As both atmospheric CO2 and Arctic sea ice melt rates are on accelerating trends this will have a negative effect on populations of both planktonic and benthic calcifying organisms in the Canada Basin, and potentially over wider areas within a relatively short time span. -
mscavazz at 17:27 PM on 30 August 2010Pakistan flood: many more will die unless more aid is delivered quickly
@Lou Grinzo post#2 "If we continue to pour 30 billion tons of CO2 into the air every year then tragedies like this will happen more and more often." More than CO2-cause, I would say "If we continue to deforest then tragedies like this will happen more and more often." Pakistan has only 2.5% forest coverage. It was destroyed at a rate of 24%/year in the last 10 years. That's the main reason for human losses and damages. -
Doug Bostrom at 16:50 PM on 30 August 2010Long Term Certainty
Thingadonta points out that prices for fossil fuels-- particularly liquids-- will become uncompetitive w/newer and more modern energy capture and liberation systems as we're forced to use increasingly poor and economically defective deposits, moving from flowing crude through tar and finally to hydrocarbons finely dispersed and tightly locked in shale. The variety of "green" to end our brief and sadly temporary fling with virtually free energy will be of the folding kind, not the two-legged sort. -
huntjanin at 16:40 PM on 30 August 2010Sea level rise: the broader picture
This idea may have already been included, but would it interest the reader to know that sea level is likely to rise by 1 meter (if not somewhat more) by 2100? -
thingadonta at 16:15 PM on 30 August 2010Long Term Certainty
Since this discussion has touched on oil/coal curves and energy related issues, a few points: -The world has at least 30-50 years of conventional oil, even at enhanced consumption rates. It has many times more than this of 'unconventional' oil shale and tar sands, however there are problems with rate of extraction of such. One estimate is that there are 242 times as much oil in remaining tar sands and oil shales than in all the oil which has already been consumed in conventional oil sources. -Many of these tar sands and oil shales are not currently being extracted because it is simply more economic to keep using conventional oil and gas. -Venezuela and Canada both have far more remaining oil in tar sands and oil shale than all the oil that has been produced in the Middle East. Canada recently annouced that it has more economically recoverable oil in tar sands, based on current prices, than Saudi Arabia has in conventional oil. -The USA also has vast resources of oil shale (eg inb Wyoming), enough to supply its own domestic needs for over a century, however at current oil prices these are not economic. Of course, extraction and access to these resources are also being blocked to some extent by green -driven agendas. -The world isnt going to run out of oil, any more than the Stone Age ran out of stones, it will simply move on to something else, when they become more economic. So far various renewables arent competitive. -It seems strange to me that so many who support strong AGW also support renewable energies being economically viable. One doesnt necassarily follow from the other, so this suggests a pattern-bias. AGW can have bad consequences, this doesn't mean renewable energies currently/will work at large scales. -Switching to renewable energies will 'create jobs', but at a higher cost to consumers and the taxpayer. Many such jobs are actually subsidised, by the taxpayer or otherwise. Many green groups have a hard time understanding this, becuase their jobs are also subsidised, they dont pay for themselves- they rely on society's good will to exist. This generally doesnt happen in oil and coal. -Renewable energies are currently largely an artificial market, suported on the belief that eventually they will become economic, when they currently are not. Such is probably the case for Denmark and Germany, and Spain. -One renewable energy which ha hogh potential in Australia is hot rocks. With Australia's low population and high radioactive granties close to the surface, this has the potential to be economically viable on a large scale. Currently however, hot rock technology is heavily subsidised by thre taxpayer. All such jobs are currently 'superficial'. -Australia, in any case is in a different position to Europe. Australia has a low population relative to energy-intensive exports, so obviously has a high carbon emission per capita. This is unlikely to change. Australia's GDP is largely dependant on the economic base of adjacent Asia, and exports which involve highly localised, captital and energy intensive industry drive up carbon emissions/capita. This won't change as long as Aisi continues to grow, whether we introduce wave and wind energy or not. -Australia currently has at least 400 years of mineable coal at current extraction rates. We import most oil and gas, however there is potentially large resources of oil shale, which is also being blocked by green-driven agendas (much like in the USA, although Venzeuala's totalitarian socialist government has one advantage-it can ignroe green driven agendas if it feels like it). We aren't going to 'run out' of oil quickly, but alternatives may become economic if rate of extraction of tar sands and oil shales remains an issue. But these 'alternative' energy source can only be subsidised for so long, they will need to economic at large scales on their own if they are to be competitive, which most at the present time are not, particularly at large scales (eg hot rocks). -
owl905 at 16:06 PM on 30 August 2010Why we can trust the surface temperature record
The description of precession causing a complete annular rotation of the seasons is false; it's science-fiction. There are two underlying fallacies - one degree of shift every 72 years (known) is the same as one day of season shift (a magic trick at best). The second is the circular season: if there's any effect, it will be advance and retreat. Even that interpretation doesn't match the older ice age cycles of 41,000 years. The easiest exposure of the nonsense is solstice and equinox celebrations - they'd be shifted by over a month from ancient times. They haven't done that. In fact, the northern hemisphere planting season moved later by over a week between 1940 and 1975, and has retreated by over two weeks since then. Like the skit said - "The Milankovich cycle don't enter into it. That theory is dead." -
Daniel Bailey at 15:30 PM on 30 August 2010Sea level rise: the broader picture
Re: HR at 14:03 PM on 30 August, 2010 Given that TOPEX/Poseideon and Jason-1 confirm the work of Church & White, how do Wenzel and Schröter account for the "discrepancy" (Church 2008 actually shows a significant increase in the rate of sea level rise in the period 1920-1950) you reference? Claims based on 1 paper that overturn much of the body of a field must be accompanied by an extraordinary level of evidence and surety. Share with us, what are those extraordinary levels of evidence and surety? The Yooper -
Sea level rise: the broader picture
HumanityRules - That's an interesting paper, but I can see what may be some serious methodological issues with it. Primarily, looking at the online versions of their work, they're splitting the ocean basins into only 12 regions. Looking at a current chart of isostatic rebound (land rise) since the glacial period it is clear that their regions cover large variations in isostatic rise, and they make no statements about correcting for this. That may account for their value of 1.56 ± 0.25 mm/yr, compared to the ~2.3 mm/yr found by others. Secondly, they state that they've found oscillations with periods of about 50–75 years and of about 25 years. If they are working from the same data they used in their earlier presentations (as there is a pay wall on the 2010 paper), 1990-2006, that is far too short a period to derive 75 year periodic behavior. Neural nets are a fine technique to use if you cannot find or characterize some internal relationships in an incompletely known system. If, however, you have some physical knowledge about the system, you are better off actually modeling it's behavior mathematically, or performing direct measurements, rather than trying to fit a mess of non-linear functions to it. There's always a risk of overfitting or underfitting a neural net - it's extremely difficult to match your network size to your problem if you don't start with a reasonable knowledge of the problem domain. -
HumanityRules at 14:03 PM on 30 August 2010Sea level rise: the broader picture
The follow 2010 paper suggests there isn't any recent acceleration in SLR based on a novel method of analysis. JOURNAL OF GEOPHYSICAL RESEARCH, VOL. 115, C08013, 15 PP., 2010 doi:10.1029/2009JC005630 Reconstruction of regional mean sea level anomalies from tide gauges using neural networks Manfred Wenzel and Jens Schröter The curved nature of the Church data comes from the slowdown between 1920-1950 which isn't present in the Wenzel and Schroter paper. -
muoncounter at 13:33 PM on 30 August 2010Human CO2: Peddling Myths About The Carbon Cycle
#12: "29 gigatons is safely in the margin of error (given our measurement ability) of the natural carbon cycle (771 gigatons)" If, as stated in the post, the larger amount is "moving through the carbon cycle each year", then it would seem to have little to do with the 50+ year trend. Atmospheric CO2 graphs display an annual oscillation superimposed on a long-period rise. The peak-to-trough excursion of the annual cycle (up to 15ppm/year in some places) is distinct from the 2ppm trend. A related question -- is it possible to quantify how much of the 'natural cycle' is due to wild growth vs. how much is due to agriculture? Would that be a valid part of the response to the argument that 'human influence is too small to be detected'? -
Daniel Bailey at 13:31 PM on 30 August 2010Sea level rise: the broader picture
Forgot to include the TOPAZ site (great for near-time ice & temperature maps & visualizations of the Arctic & surrounding areas). The Yooper -
Daniel Bailey at 13:21 PM on 30 August 2010Sea level rise: the broader picture
Re: Roy Latham at 12:22 PM on 30 August, 2010"The IPCC claims that the land ice masses in the polar regions are, net, stable, so that the predicted sea level rise of 9 inches in the next hundred years will come from thermal expansion of the water. Of course some scientists disagree,and paint an Al Gore scenario, but those are posed against both the IPCC and the skeptics, who in this case agree that thermal expansion is the culprit. Computing thermal expansion is straightforward, so measurements of that contribution are not required."
Actually, the IPCC disagrees :Models used to date do not include uncertainties in climate-carbon cycle feedback nor do they include the full effects of changes in ice sheet flow, because a basis in published literature is lacking. The projections include a contribution due to increased ice flow from Greenland and Antarctica at the rates observed for 1993 to 2003, but these flow rates could increase or decrease in the future. For example, if this contribution were to grow linearly with global average temperature change, the upper ranges of sea level rise for SRES scenarios shown in Table SPM.3 would increase by 0.1 to 0.2 m. Larger values cannot be excluded, but understanding of these effects is too limited to assess their likelihood or provide a best estimate or an upper bound for sea level rise. {10.6}
Quote is from P. 14. CYA translation: Here's what we have, based on available data. Melt continues, adding to sea level rise. Increased melt from ice sheets will yield sea level rise in a certain range. But because the game is still early, we could be way under-representing what could happen. Way."The reason the polar ice masses may be stable despite warming is that polar temperatures are well below freezing. Even if temperatures increase the ice doesn't melt. The balance is then determined by the amount of snowfall versus the glacial flow into the oceans. Satellite measurements put Antarctica slightly increasing and Greenland slightly decreasing in mass."
You are in error here on most points. 1. Ocean temps in the Arctic continue to be well above freezing (indeed, the majority of sea ice melt occurs from the bottom up; evidence of this is the extension of the melt season in the Arctic until late September: JAXA ). A good discussion on ice conditions in the Arctic can be found on Neven's blog, daily. 2. Antarctica is losing gigatons of ice yearly, even in the EAIS 3. So is Greenland"What is most interesting, I think, is that sea level rise is not the same everywhere. I would appreciate a simple explanation of that. I think it has to do with the shape of the ocean bottom, but it's not clear to me."
Because the Earth's gravity field is not uniform, mean sea level at a given location can be dramatically affected by local sea/landform conditions, tidal effects and the geoid. As in all things, "local results may vary." The Yooper -
Bern at 13:16 PM on 30 August 2010Sea level rise: the broader picture
Roy Latham, Doug makes the point that the IPCC projections are conservative (i.e. low) - as I understand it, that's mainly because the AR4 projections made the assumption that land ice sheets would be stable, whereas it appears they are not. Your repetition of the denialist argument that Antarctica is gaining ice is refuted here. Similarly for Greenland here. As for it being too cold - here's an article on this site pointing out why the ice doesn't have to melt in order to end up in the ocean. -
actually thoughtful at 13:07 PM on 30 August 2010Sea level rise: the broader picture
Daniel # 3 - I wasn't around during your last posting session - I am not really sure what you are trying to say, other than you don't like the paleo data (I don't think anyone does, but it appears people are doing there best to compensate for a lack of thermometers snd satellites a few million years ago). Do you have any data to back up your assertions? Are you at all concerned by the trends evident during the instrumented period? -
Roy Latham at 12:22 PM on 30 August 2010Sea level rise: the broader picture
Sea level does not rise if the ice that melts was floating. Arctic ice melts and reforms with a roughly 70 year cycle, with the Antarctic ice having the cycle but out of phase. There is no effect on sea level. The IPCC claims that the land ice masses in the polar regions are, net, stable, so that the predicted sea level rise of 9 inches in the next hundred years will come from thermal expansion of the water. Of course some scientists disagree,and paint an Al Gore scenario, but those are posed against both the IPCC and the skeptics, who in this case agree that thermal expansion is the culprit. Computing thermal expansion is straightforward, so measurements of that contribution are not required. The reason the polar ice masses may be stable despite warming is that polar temperatures are well below freezing. Even if temperatures increase the ice doesn't melt. The balance is then determined by the amount of snowfall versus the glacial flow into the oceans. Satellite measurements put Antarctica slightly increasing and Greenland slightly decreasing in mass. What is most interesting, I think, is that sea level rise is not the same everywhere. I would appreciate a simple explanation of that. I think it has to do with the shape of the ocean bottom, but it's not clear to me. -
Sea level rise: the broader picture
daniel - you might want to look over your previous post and compare it to the Comments Policy. It seems light in actual facts, while quite high on denigration. -
Doug Bostrom at 12:02 PM on 30 August 2010Sea level rise: the broader picture
"Metaphysical impossibility?" High falutin' indeed, Matt! You're thick-skinned so I'll in turn suggest you check the definition of "corroborate." :-) I'd say "mutually" is unnecessary and could well be discarded. As to run-on sentences, your calibration as a grammarian may insist that "in fact" is not technically a coordinating conjunction but I'm quite happy with the result. If I'm besieged by grammar grumblings over this license perhaps I'll change the sentence. -
Riduna at 11:44 AM on 30 August 2010Ocean acidification threatens entire marine food chains
CO2 pollution of the oceans (acidification) is and should be regarded as a major concern because it reduces aragonite. Thus reduces the ability of calcifying animals, particularly pteropods, to form shells and hence their ability to survive. Their disappearance, predicted by 2050, would create a potentially catastrophic break in the marine food chain, resulting in massive depletion of marine life. http://www.onlineopinion.com.au/view.asp?article=8934 That outcome is made more likely by several contributing factors such as rising temperature of seawater, pollution from human waste and overfishing as fish species diminish. The latter two can be expected to increase significantly as human population grows, while warming seawater is an inevitable outcome of global warming. No one should be in doubt that the future is bleak and largely our fault. -
daniel at 11:42 AM on 30 August 2010Sea level rise: the broader picture
Rupert has just wired me the first 50% of our agreed sum and so here we go.... That's nice David, you're right in saying that two poorly defined observations within the space of one lifetime are not enough to really determine anything and thankyou doug for your article that didn't cover our enlightening discussion a couple of months back. You remember the discussion where you tried to discredit me by comparing my lack of credentials against Donnelly's and then claimed that I therefore had nothing to say? You also misunderstood me in quite an amateur fashion and failed to understand the points I was making about the poor quality of work done in understanding paleo sea level rise? You see David what you don't realise is that much of the concern over the current sea level rise is based on comparisons to the past. We can't really say if the current sea level rise (and indeed global temperature, which is supposed to be driving the sea level rise) is unprecedented due to the lack of any really reliable paleo data. I encourage you to look into this yourself and do be careful of the deluded assertions of the true believers who write articles like that above without the competence or desire to critique the work put forward by supposed experts. Peter and others then took over trying to claim that I didn't have any evidence to suggest that there are any real drivers in the not too distant past to reproduce the current levels of SLR. Well that's a discussion I haven't had the time to have with them yet but I can say that i had a quick look a couple of months back and what i found in terms of the quality of paleo temperature records and also their comparison to modern temperatures gave me quite the confident grin. Yours truly David, from someone who actually knows what they're talking about :) Oh and peter, to claim that you are the ultimate authority on what is recognisable statistics or science was an absolute gem :D thanks for the laughs.... -
MattJ at 10:51 AM on 30 August 2010Sea level rise: the broader picture
This is basic version??? It is much too wordy and uses 'high-falutin' words like 'corroborate'. And what is "mutually corroborates" supposed to mean, anyway? It looks like the author thinks that sea-level rise confirms global warming, while at the same time, global warming confirms sea-level rise. But this is metaphysical impossibility (see http://plato.stanford.edu/entries/causation-metaphysics/ under 'Direction'). On a simpler note, am I the only one to notice that "Current sea level rise is after all not exaggerated, in fact the opposite case is more plausible" is a run-on sentence? -
David Horton at 10:40 AM on 30 August 2010Sea level rise: the broader picture
"Don't be mislead by only a carefully-selected portion of the available evidence being disclosed." They mostly don't bother with the graphs Doug. It is enough for the Murdoch media empire to send a middle-aged surfer to, say, Bondi Beach, and have him say that the beach doesn't look any different to what it did when he was a child. Now, that disproves all those silly measurements and graphs doesn't it? Just good common sense from a member of the public - who needs science? It's this kind of stuff that makes me doubtful that these very well-intentioned simple language arguments, as well done as they are, will make any difference to public discourse. Deniers, egged on by Rupert, will keep denying in the face of all and any evidence you throw at them. As can be seen on SS threads as well as elsewhere. -
actually thoughtful at 10:10 AM on 30 August 2010Human CO2: Peddling Myths About The Carbon Cycle
This is how the argument gets (ab)used by deniers 1) 29 gigatons is safely in the margin of error (given our measurement ability) of the natural carbon cycle (771 gigatons) 2)Regarding actions: The US is responsible for 25% of the global human induced CO2 emissions. Official plans call for very minor reductions, but even if you use 20% from a likely baseline, 20% of 25% of 2ppm (annual increase in CO2) is 0.1ppm and virtually unmeasurable. I myself come from the school of thought that says step one is to stop digging - any help for responding to the sophism I outline above? -
Chemware at 09:01 AM on 30 August 2010Human CO2: Peddling Myths About The Carbon Cycle
#7. HumanityRules, 20 million years ago sea level was about 90 m higher, Miller, 1996, and 100 million years ago it was about 145 m higher than it is today Müller 2008. That's what so special: global sea levels are intimately related to CO2 levels. Do you want sea levels like that in the near future ? -
Peter Hogarth at 08:40 AM on 30 August 2010Ocean acidification isn't serious
The first deep basin observations of Aragonite undersaturation in surface waters have already been observed in 2008 in the Arctic (Yamamoto-Kawai 2009), and in 2009 the extent of surface waters with undersaturated aragonite increased, although this is not yet region-wide. This means that these waters crossed the threshold where they are beginning to be corrosive to certain types of calcifying organisms. The trends in the Arctic regions have been a cause for concern for some time (Bates 2009), as the Arctic waters are subjected to the dual effects of decreasing alkalinity due to increasing pCO2 (directly due to uptake of the increasing atmospheric CO2 due to anthropogenic emissions), and increased sea ice meltwater due to increases in regional temperatures which are greater than the average global temperature rise. Models also predicted Aragonite undersaturation in these regions would occur in the near future, but the recent increased rate of ice melt has accelerated the process (eg Steinacher 2009). As both atmospheric CO2 and Arctic sea ice melt rates are on accelerating trends this will have a negative effect on populations of both planktonic and benthic calcifying organisms in the Canada Basin, and potentially over wider areas within a relatively short time span. -
Peter Hogarth at 06:53 AM on 30 August 2010Medieval Warm Period: rhetoric vs science
fydijkstra at 00:37 AM on 24 August, 2010 It seems no-one noticed (or commented) that my light hearted effort here was really a subtle poke at the Loehle methodology? (but with tree rings and 50 proxies) I tried taking the tree ring data out, - not much difference. With the 50 proxies and simple averaging that Loehle used the MWP appears slightly less warm than now. I could however easily cherry pick several proxy data sets and show a slightly warmer MWP... However every indication is that the late 20th Century multi-decadal warming trend will continue. -
rcglinski at 04:43 AM on 30 August 2010Ocean acidification isn't serious
Is there a way to read Pelejero 2010 w/o buying a membership with Science Direct? If not, this page would be improved by a summary of the proxies used and how they were validated. -
Peter Hogarth at 02:44 AM on 30 August 2010Can humans affect global climate?
HumanityRules at 19:51 PM on 29 August, 2010 Significant compared to the 20th century trend? The CET data shows the longer term trends better as there is even more data, which is why I included the CET data as a "sanity check". We also have to factor in the different forcing factors operating at different times, and uncertainties, which are high in the early data, compared with the modern data. Though this will sound a little perverse, a multidecadal slope in the early part of the data may be less statistically significant than a similar slope in the modern data where measurement errors are very small indeed. Anyone pointing to the very early CET temperature variations should bear in mind the Mercury thermometer was invented around 1714, and the Stevenson Screen around 1864. For Armagh, there were some documented 19th century thermometer errors of around 3 degrees Fahrenheit (if memory serves) which was a potential problem when trying to calibrate some of the early data.
-
Wayne Johnston at 02:32 AM on 30 August 2010Human CO2: Peddling Myths About The Carbon Cycle
You have a small typo in the Intermediate summary. The second sentence reads "Therefore human emissions upset the natural balance, rising ...". It should say "raising". -
Robert at 02:27 AM on 30 August 2010Human CO2: Peddling Myths About The Carbon Cycle
"100 million years ago pCO2 was three times it is today. 175 million years ago it was 7 times todays level." I understand why people raise this point, but if you think it through, you'll realize that the fact that a certain condition existed millions of years ago, prior to the entire period of the establishment and development of human civilization, does not mean that that condition isn't extremely dangerous and destructive, and an extreme change from the conditions that have existed for the thousands of years in which human societies have flourished. Suppose, for example, somebody said to you: "Who cares about nuclear war? Many times in the earth's history, we've been struck by giant meteors that exploded with the force of thousands of nuclear bombs. So what if it happens again?" I'm sure you understand my point: the earth has existed for billions of years. Just because something has an analogue somewhere in that history does not mean it is safe to bring it upon ourselves with our own actions. Giant meteor or nuke, you don't want to be standing next to it when it impacts. -
muoncounter at 02:07 AM on 30 August 2010Human CO2: Peddling Myths About The Carbon Cycle
#7: "100 million years ago pCO2 was three times it is today. 175 million years ago it was 7 times todays level." Point being? Don't neglect to mention that there was far more widespread volcanic activity during the Cretaceous than today. And highly variable climate as well. Although I hesitate to reference other blogs, this guy's pretty good with volcanoes. Of course that would suggest that CO2, whether 'natural' or emitted by fossil fuel use, influences climate in a GHG kind of way. So your comment suggest that you've come to accept the 'GHG hypothesis'? -
muoncounter at 01:56 AM on 30 August 2010Hansen etal hit a Climate Home Run -- in 1981
#23: "compared to some naive/null prediction? " The gray bars in Hansen's fig 7 are bounds on what temperatures would do if all climate variation was within 'the noise level of natural variation'. Temperature anomalies rose out of the noise in the mid-late 80's, as predicted. Isn't that the real key? When a natural phenomenon rises out of its natural range of observations, its time to go looking, via modeling runs or whatever tools are available, for the causes. -
HumanityRules at 01:14 AM on 30 August 2010Human CO2: Peddling Myths About The Carbon Cycle
What's so special about the past 20millions years? 100 million years ago pCO2 was three times it is today. 175 million years ago it was 7 times todays level. What is "the natural balance of the carbon cycle"? It seems like an unscientific statement. I can't imagine anything that is working for balance in this. -
RickG at 01:06 AM on 30 August 2010Why we can trust the surface temperature record
#2 thingadonta I guess that's why anomalies are used instead of actual temperatures. -
Peter Hogarth at 01:02 AM on 30 August 2010Climate's changed before
Svettypoo at 10:04 AM on 29 August, 2010 I’m not sure where your chart originates, but the temperature schematic is from Scotese, from around ten years ago. It is disheartening to see this schematic repeatedly being wheeled out on skeptical websites and venerated like the bones of some long dead saint, despite more than a decade of painstaking research since which makes it quite obsolete. It is a schematic only, meant to show very approximate periods of relative warmth and cold. The composite d18O proxy data used to estimate paleo-temperature variations, which has been gathered over many years is far more complex. I have charts if anyone is interested. Anyway, keeping it simple, the most recent chart showing Phanerozoic temperature variations estimated from updated d18O records compared with those which would result from (updated) paleo-CO2 data I have seen is from Royer 2009.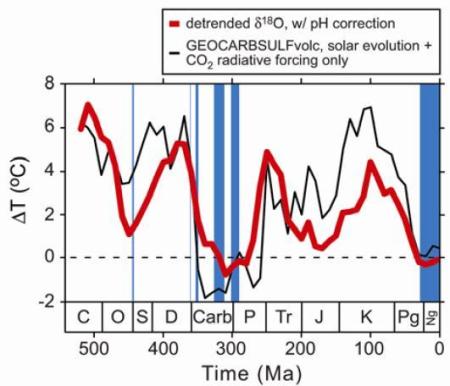 This includes recently revised (2009) paleosol CO2 estimates from Breecker 2010 but we must remember it is a compressed overview (each pixel is bigger than our entire ice core record). Over recent years, we have been able to address many gaps, uncertainties and lack of detail in our knowledge of paleo-CO2 data, from the Neogene to the Ordovician. Though much work is still to be done, as each new piece in the jigsaw is added, the link between carbon cycle and climate is strengthened. For those interested in more detail I have tried to find some free links to some good recent work, see: Seki 2010 (and see Seki 2010 supplementary data), Young 2010, Tripati 2009 (and see Tripati 2009 supplementary data).
Incidentally, for some longer term solar irradiance proxy data (9300 years) try
Steinhilber 2009, and on the NOAA paleo website there are much longer reconstructions based on the 10Be records from ice cores, though these should also be interpreted with a little care.
This includes recently revised (2009) paleosol CO2 estimates from Breecker 2010 but we must remember it is a compressed overview (each pixel is bigger than our entire ice core record). Over recent years, we have been able to address many gaps, uncertainties and lack of detail in our knowledge of paleo-CO2 data, from the Neogene to the Ordovician. Though much work is still to be done, as each new piece in the jigsaw is added, the link between carbon cycle and climate is strengthened. For those interested in more detail I have tried to find some free links to some good recent work, see: Seki 2010 (and see Seki 2010 supplementary data), Young 2010, Tripati 2009 (and see Tripati 2009 supplementary data).
Incidentally, for some longer term solar irradiance proxy data (9300 years) try
Steinhilber 2009, and on the NOAA paleo website there are much longer reconstructions based on the 10Be records from ice cores, though these should also be interpreted with a little care.
Prev 2251 2252 2253 2254 2255 2256 2257 2258 2259 2260 2261 2262 2263 2264 2265 2266 Next


