


 Arguments


Recent Comments
Prev 2260 2261 2262 2263 2264 2265 2266 2267 2268 2269 2270 2271 2272 2273 2274 2275 Next
Comments 113351 to 113400:
-
kdkd at 07:24 AM on 5 August 2010Has Global Warming Stopped?
Dikran #58 "assuming the null and alternative hypotheses are complementary" I'm pretty sure that the alternative hypothesis is the logical oposite of the null by definition (i.e. H1 = not(H0) ) -
kdkd at 07:21 AM on 5 August 2010Why I care about climate change
Cornelius #96 Basically we have the choice of two divided (on climate policy) parties, both in thrall to a rather toxic energy lobby, with the right wing party slightly more delusional than the left wing one. Then there's the biggest minor party, the Greens, who are the only sane voice in climate change policy, and look to get the balance of power in the upper house in the middle of next year. We also have fairly powerful state legislatures, but they're largely in thrall to the coal lobby at the moment, although interesting noises are coming out of Victoria. But in many ways we're lagging behind the USA on a lot of climate action right now. -
chris at 07:07 AM on 5 August 2010Confidence in climate forecasts
sheesh..."converge" should say "diverge" in the second paragraph... -
chris at 06:52 AM on 5 August 2010Confidence in climate forecasts
Dappledwater at 05:26 AM on 5 August, 2010 angusmac at 02:43 AM on 5 August, 2010 We need to be a little bit careful here. Remember that Hansen’s model was constructed and parameterized almost 30 years ago. The computational run under discussion used a 100 year control equilibration with no forcings, and simulated the earth global temperature from 1958 to 2020 according to a number of scenarios [*]. Dappledwaters picture (Figure 2 from Hansen et al. 2006) shows that the simulation has done a good job of simulating the actual earth surface temperature through around 2005. Angusmac’s figure updates the data through 2009. The simulation and measured surface temperature data now converge a bit. What do we make of this? I’d say the following are relevant: (i) There’s no question that Hansen’s simulation B has tracked the real world temperature from 1958 through 2005 pretty well. Scenario B is a little above the real world observations. However as Hansen et al. 1988 state [**] their model is parameterized according to a climate sensitivity of 4.2 oC (equilibrium surface warming per doubling of [CO2]). Since the mid-range best climate sensitivity estimate is 3.0 oC, we’re not surprised if the model is a little “over warm”. (ii) Since 2005, the global temperatures haven’t risen much whereas the model has increased. So there is a divergence as indicated in angusmacs picture. However if a model of Earth temperature matches reality quite well up to 2005, the fact that it diverges somewhat during the subsequent 4 years isn’t a reason to consider the model a poor one. As Alden Griffiths discusses elsewhere on this site, short term events can easily result in temporary shifts of observables from long term trends. There’s no expectation that the Hansen model should accurately track reality since stochastic variability is differently represented in reality and in the models. (iii) Is there anything we might say about the period 2005-2009? Yes, it’s a period that has seen the sun drop to an anomalous extended solar minimum, and that has had a largish cooling La Nina that greatly suppressed temperatures in 2008. So we’re not surprised that temperatures haven’t risen since 2005. (iv) Is there anything significant about the fact that scenario B and C are rather similar right now? Not really. Scenario B is a scenario that roughly matches the extant emissions and (serendipitiously) includes a significant volcanic eruption in the 1990s (1995 in the model; 1991 Pinatubo in reality). In scenario C greenhouse emissions were “switched off” after 2000. However since the Earth surface continues to warm under a (non-supplemented) forcing for some time due to inertial elements (the oceans) of the climate system, we don’t expect scenarios B and C to differ to much for a while following 2000. [*] from Hansen et al. (2006)“Scenario A was described as ‘‘on the high side of reality,’’ because it assumed rapid exponential growth of GHGs and it included no large volcanic eruptions during the next half century. Scenario C was described as ‘‘a more drastic curtailment of emissions than has generally been imagined,’' specifically GHGs were assumed to stop increasing after 2000. Intermediate scenario B was described as ‘‘the most plausible.’’ Scenario B has continued moderate increase in the rate of GHG emissions and includes three large volcanic eruptions sprinkled through the 50-year period after 1988, one of them in the 1990s.”
[**] from Hansen et al. (1988)“The equilibrium sensitivity of this model for doubledC O2 (315 ppmv - 630 ppmv) is 4.2 oC for global mean surface air temperature (Hansen et al. [1984], hereafter referred to as paper 2). This is within, but near the upper end of, the range 3 o +/- 1.5 oC estimated for climate sensitivity by National Academy of Sciences committees [Charney, 1979; Smagorinsky, 1982], where their range is a subjective estimate of the uncertainty based on climate-modeling studies and empirical evidence for climate sensitivity.”
J. Hansen et al. (1988) Global Climate Changes as Forecast by Goddard Institute for Space Studies Three-Dimensional Model J. Geophys. Res. 93, 9341–9364 J. Hansen et al. (2006) Global temperature change Proc. Natl. Acad. Sci. USA 103, 14288-14293 -
Doug Bostrom at 06:52 AM on 5 August 2010Communicating climate science in plain English
One (final? hah!) actual concrete suggestion would be to do some research on cognitive dissonance prior to making any substantial changes to the site, then ask whether such changes as can be made will address that fundamental problem. -
Cornelius Breadbasket at 06:39 AM on 5 August 2010Why I care about climate change
#93, 94, 95 Interesting point though. Here in the UK you'd have to vote for one of two very small and very unpleasant minority parties if you wanted to vote against carbon reduction. In the US its a 50 - 50 decision - and the democrats can't get the climate bill through. What are your choices in Australia? -
Doug Bostrom at 05:51 AM on 5 August 2010Communicating climate science in plain English
Naturally I agree with pohjois! :-) Regarding fragmentation, whatever you do don't divide comments. Their only practical utility in terms of improving public understanding is to serve as an illustration for lurkers of who has the more coherent grasp on reality so to that end they're worthwhile. Breaking 'em up would vastly increase the amount of effort needed to derive any benefit from comments threads. -
Rob Painting at 05:34 AM on 5 August 2010Confidence in climate forecasts

-
pohjois at 05:33 AM on 5 August 2010Communicating climate science in plain English
I agree with Doug. Implementing this idea as proposed will lead to tripling amount of work and fragmented discussion. I think that desired effect can be achieved with lower effort and without disadvantages by changing format of the articles. It should start with "Executive summary" - which is basically a simplified and highly compressed version of the main article. Then the normal article would follow, written in the "middle" level. If a more technical description should be useful for some part of text, then one can use boxes, or hyperlinks to supplementary material containing in-depth technical explanations. In this proposed scheme everything is in the single place, the discussion can be coherent and one can simply skip unnecesary fragments. -
Rob Painting at 05:26 AM on 5 August 2010Confidence in climate forecasts
Angusmac @20 - where does that graph come from?. As Dcruzuri has pointed out, it differs greatly from the actual 2006 Hansen paper, which shows actual temperatures tracking very closely to scenario B, and above scenario C. You even provided a link to the actual paper. Do you expect people not to check?. -
Dikran Marsupial at 05:13 AM on 5 August 2010Has Global Warming Stopped?
ABG I think the point Mike was making is that saying "95% confidence" is inviting the public to think this means that the probability of the trend being positive is at least 95%, however that would not be correct. The classic fallacy of significance tests is to treat the p-value as being the probability that the null hypothesis is true, which is the same fallacy as implying that we have 95% confidence in the alternative hypothesis (assuming the null and alernative hypotheses are complementary). The frequentist definition of probability means that it is meaningless to talk of the probability of a hypothesis being correct, it has no long run frequency, it is either true or it isn't - it isn't a random variable. That is why frequentists have to talk of what you might expect from a large number samples from some population instead (i.e. it doesn't actually answer the question you want to ask). The same sort of problem arises in the interpretation of confidence intervals, it isn't correct to say that there is a 95% probability that the true value lies in the 95% confidence interval (even though that would be the natural interpretation of the phrase). Caveat emptor: I am a Bayesian, in part because I find the frequentist approach to confidence intervals so hard to understand and unintitive, so you would probably be better off with the opinion of an expert freqentist statistician for chapter and verse (wierd bunch that they are ;o), if I have got it all wrong, I'm happy to be corrected. -
villabolo at 04:40 AM on 5 August 2010Communicating climate science in plain English
#29. doug_bostrom at 02:44 AM on 5 August, 2010 John's explanations are quite accessible to anybody with a high school diploma and the sheer amount of work involved in redoing the site is going to be a massive distraction. ****************************************************** Unfortunately a High School diploma does not mean much nowadays as far as level of education is concerned. -
villabolo at 04:36 AM on 5 August 2010Communicating climate science in plain English
It has always been my opinion that this site could have used two levels of explanations. The third, most advanced one, though would not be worth the trouble. It would reach only a small number of your potential readership and take a lot more effort out of proportion to its benefits. -
Doug Bostrom at 04:35 AM on 5 August 2010Grappling With Change: London and the River Thames
GC I've a feeling a lot of folks are thinking something to the effect that adaptation costs will indeed be confined to those gulping for air**. Although the book I cited cannot offer anything in the way of numerical predictions, it's absolutely chock-a-block with plausible and often apparently inevitable wealth transfer mechanisms to subsidize adaptation. Naturally these come with opportunity costs. The whole "concentrate on adaptation thing" strikes me as wishful thinking, a way of procrastinating, dealing with a problem in a comforting way. To use the tired medical analogy method, "Golly, I'm up to 400 pounds. No problem, I'll just buy some larger pants. Pass me another double bacon cheeseburger, please." ** (thanks Ann, that's a marvelous story and I've been trying to remember where in Lem's bibliography I could find it) -
John Russell at 04:27 AM on 5 August 2010Confidence in climate forecasts
Pete Ridley at 02:56 AM on 5 August, 2010 Some of the argument over predictions is because the word has differing meanings in science as opposed to 'general life'. Predictions in science are exact and leave no 'wriggle room'. Leaving aside its meanings associated with astrology -- for obvious reasons -- in contrast the word 'prediction' in general use tends to mean 'an educated guess' -- in much the same way as pollsters will 'predict' the outcome of an election before people have even put crosses on paper. I must say that for some years now I have completely avoided the word 'prediction' in the context of climate change -- it is too open to challenge. I now always use expressions like 'very high probability'. -
Doug Bostrom at 03:57 AM on 5 August 2010Monckton tries to censor John Abraham
Updates... Monckton blusters about libel charges to Scott Mandia, adding Mandia to his enemies list. The concept of fraud is investigated by kiwis at HotTopic. -
dcruzuri at 03:56 AM on 5 August 2010Confidence in climate forecasts
Re: #20: I went to the paper by Hansen, et al. (2006) and compared the graph above with the graph in the paper (figure 2, p. 14289). There seem to be significant differences between them. In particular, an naive reading of the original suggests that the data is tracking closely to both Scenario B and Scenario C, which have not diverged appreciably by this point in time. It is not clear at a casual glance why, but the graphs were plotted with different scales, with the graph above omitting about 30 years of data. I wanted to post a copy of the graph but could not figure out how. -
JohnHarrington at 03:45 AM on 5 August 2010Why I care about climate change
@Ned, thanks. I feel dumb now. -
DarkSkywise at 03:40 AM on 5 August 2010Communicating climate science in plain English
@ BaerbelW: Maybe we should ask for a raise... how does 20% sound? :D -
DarkSkywise at 03:37 AM on 5 August 2010It's the sun
Good thing I've kept it short then. ;) -
Berényi Péter at 03:35 AM on 5 August 2010Confidence in climate forecasts
#18 kdkd at 00:52 AM on 5 August, 2010 We now know from postings elsewhere that the measured TOA imbalance likely corresponds to a climate sensitivity of 3ºC #19 Ned at 01:30 AM on 5 August, 2010 kdkd is right -- a top-of-atmosphere radiative imbalance of 0.9 W/m2 corresponds to a climate sensitivity of around 3 C. TOA radiative imbalance is not measured, it is presumed. There is an essential difference in the epistemological status of these two approaches that should never be muddled up. Current Opinion in Environmental Sustainability 2009, 1:1927 An imperative for climate change planning: tracking Earth's global energy Kevin E Trenberth "Presuming that there is a current radiative imbalance at the top-of-the-atmosphere of about 0.9 W m-2 [etc., etc.]" -
BaerbelW at 03:29 AM on 5 August 2010Communicating climate science in plain English
Oh, oh, I see a lot of work coming soon for the translators ;-) Speaking of which, will the translators be included in the group given access to the discussion forum? I think it might generally help us to discuss strategies for translating the arguments and to try and keep the translations as current as possible.Response: Sure, I can give translators access to the forum. Was thinking about setting up a forum specially for the translators also - once the forum is programmed up, easy to add new forums for special topics.
Haven't really thought through how to approach translations with the new system. Don't want to put too much stress on you guys :-) That'll be something to discuss on the forum. -
Doug Bostrom at 03:23 AM on 5 August 2010Communicating climate science in plain English
Yeah, sorry NickD, I get your point. As far as I can tell, the most useful thing I learned in high school was touch typing. The important stuff happened earlier and elsewhere. My Dad refused to directly answer questions, always gave me some pointer in the direction of finding out by myself. -
NickD at 03:18 AM on 5 August 2010Communicating climate science in plain English
doug_bostrom at 02:44 AM on 5 August, 2010 says: "John's explanations are quite accessible to anybody with a high school diploma..." I'll go you one further, Doug. I never earned even a high school diploma and I find his explanations very accessible :-) -
Ned at 03:05 AM on 5 August 2010Why I care about climate change
John Harrington writes: You say you voted "both sides" in the last elections. I also don't consider myself of any particular political stripe, but, that said, I have a hard time understanding how anyone who understands the calamity of climate change could vote for a republican. I doubt John voted Republican, since that party doesn't exist in Australia! :-)Response: We do have a 'Climate Sceptics Party' (seriously, that's an actual political party) - that's probably the closest thing :-) -
Alexandre at 03:01 AM on 5 August 2010Communicating climate science in plain English
I hope someone comes up with a Blackberry app sometime. -
Doug Bostrom at 02:58 AM on 5 August 2010Communicating climate science in plain English
Finally will note, an increasing body of research indicates that the communications difficulties w/regard to climate science are not about failure to be able to understand science, they're about defensive postures on the part of the person refusing to acknowledge the science, protection of attitudes and beliefs having nothing to do with science. There are also indications that repeated or amplified explanations actually are counterproductive to changing beliefs, something that would call the notion of graduated explanations into question. If something can be done to the site that -rationally- attacks the underlying problem of dealing with "skeptic" psychology, that would be worth effort. A rearrangement hinging on what we thought we knew about skeptics 10 years ago not so much. -
JohnHarrington at 02:58 AM on 5 August 2010Why I care about climate change
Thank you for what you do. We share a reason for caring about climate change, and that is our children. I have a question for you, though. You say you voted "both sides" in the last elections. I also don't consider myself of any particular political stripe, but, that said, I have a hard time understanding how anyone who understands the calamity of climate change could vote for a republican. They seem to vote in a bloc against any prudent response to climate change. If you don't mind my asking, who did you vote for any why? And if you prefer to keep your vote private (as is certainly your right) can you discuss in general terms why anyone concerned about climate change should be a swing voter?Response: Well, firstly, I'm Australian so I didn't vote Republican or Democrat :-) Secondly, two federal elections ago, climate change wasn't really on my radar and I don't recall it being much of an issue at the time. If I'd been more aware at the time, I might have voted differently but I honestly can't remember what either party's policy was at the time.
In the last election, I had to choose between a party whose leader was a climate skeptic and a party whose policy was to put a price on carbon. A bit of a no-brainer really. Sadly, however, the party I voted for has now abandoned their attempt to put a price on carbon. -
Peter Hogarth at 02:57 AM on 5 August 2010Has Global Warming Stopped?
kstra at 06:03 AM on 3 August, 2010 Sorry if my previous comment was cryptic. To clarify and add further to what ABG has said, here is the HadCRUT3 chart with temperature values up to June 2010. I have used the same start date, and added the same Excel 4th order curve fitting process. I have also added error bars. The results are quite different (and just as inadvisable to use). As others have pointed out, this highlights several dangers when analyzing data in this way:
1) Fitting higher order curves is problematic when these fits are based on simple mathematical functions that are unlikely to represent or model complex climate variations. Simple trends are indicators, and should not be used as models and should not be extrapolated far.
2) For the end dates, up to date data should always be used (if available). For start dates, the most complete versions of the data should be used if possible, we shouldn’t cherry pick without justification. In this case the BBC asked a loaded question.
3) Deriving any trends from short time series can give misleading results. Caution and an appreciation of error bounds and physical processes should be applied.
If we take the entire data series from 1850 to 2010, and fit a second order function, and a fourth order function, the respective R squared values are indistinguishable. This kind of analysis tells us only general things about the temperature records, such as temperature is increasing, the rise is statistically significant, and the trend is probably accelerating over the recording period.
As others have pointed out, this highlights several dangers when analyzing data in this way:
1) Fitting higher order curves is problematic when these fits are based on simple mathematical functions that are unlikely to represent or model complex climate variations. Simple trends are indicators, and should not be used as models and should not be extrapolated far.
2) For the end dates, up to date data should always be used (if available). For start dates, the most complete versions of the data should be used if possible, we shouldn’t cherry pick without justification. In this case the BBC asked a loaded question.
3) Deriving any trends from short time series can give misleading results. Caution and an appreciation of error bounds and physical processes should be applied.
If we take the entire data series from 1850 to 2010, and fit a second order function, and a fourth order function, the respective R squared values are indistinguishable. This kind of analysis tells us only general things about the temperature records, such as temperature is increasing, the rise is statistically significant, and the trend is probably accelerating over the recording period.
-
Pete Ridley at 02:56 AM on 5 August 2010Confidence in climate forecasts
There has been recent debate on the “How reliable are climate models?” thread about this topic. The lead article here repeatedly uses the word “predict” or its derivatives, just as the IPCC did in its second assessment report. After IPCC reviewer Dr. Vincent Gray pointed out that no model had ever been validated and could not predict global climates the title of the relevant WG1 chapter was renamed “Model evaluation” and the word “predict” was replaced with “project”. These changes were not trivial but highly significant. There can be no confidence in the ability of climate models to predict what global climates will be during the present century of any other because the present scientific knowledge of those horrendously complex processes and drivers of global climates are too poorly understood. Anyone who is inclined to reject that last statement should read a few more scientific papers on the subject and look carefully for the word “uncertainty”. Sorry that I can’t spend more time on this at the present but I’m under strict orders from she who must be obeyed. There is more on this on the “How reliable are climate models?” thread - enjoy Best regards, Pete Ridley. -
Doug Bostrom at 02:52 AM on 5 August 2010Communicating climate science in plain English
Should also note, detailed discussion here over tabs versus sliders, terminology etc. seems to have skipped an important step, namely "does this need to happen." That's a question the folks at Coca-Cola might have paused on before deciding on "New Colk" vs. "Updated Coke" vs. "Slightly Different Product in a Slightly Different Can." -
Doug Bostrom at 02:44 AM on 5 August 2010Communicating climate science in plain English
Not to be the wet blanket but I don't think the current implementation is sufficiently flawed as to require a serious upheaval and I don't think such disruption is going to produce much marginal benefit at all. John's explanations are quite accessible to anybody with a high school diploma and the sheer amount of work involved in redoing the site is going to be a massive distraction. I think discussion threads here prove beyond a doubt that going from "Easy" to "Hard" changes nobody's mind, or at least is overwhelmingly ineffective. We do that continuum every day, in a countless myriad of ways. We can witness the same futility on a number of other websites devoted to this subject. Once you find yourself arguing with somebody over easy science you may as well give up because you're not arguing science, you're arguing ideology or something else. More explanation, more amplification, more detail is useless. If a one-liner backed by an argument of the kind found in the existing rebuttals does not work you may as well give up. John keeps a lot of stats. I don't know if any are available on moving people from "I don't believe it" to "Ah, I see" but I suspect they're perfectly dismal whether we can produce them or not. Not to say there's no point to SkS, not at all. If somebody's just got the wrong impression and is curious about the subject they're going to "get it" when steered to a little information, a little being all that's necessary. So concentrate on getting the one liners down, concentrate on providing a path to the classic rebuttals, concentrate on tuning the classic rebuttals, keeping them fresh, that's my suggestion. To convey more information, to get the same effect of tabs and the like, cultivate references at the end of the standard rebuttals. The curious will certainly find them, the argumentative simply don't care.Response: Ah Doug, you're such a contrarian! :-)
"John's explanations are quite accessible to anybody with a high school diploma"
I have various anecdotal evidence that this isn't the case. I have friends and family with high school or higher levels of education that have trouble understanding the explanations on my site. My wife Wendy (tertiary education, an Arts degree... not that there's anything wrong with that :-) often complains that it gets too technical. The climate communication workshop run by Jan Dash also suggests the detail is too complicated for the average person on the street.
So there is a definite need for plain English versions of the rebuttals. The emphasis here, the most important element of the multi-level system, is the Easy version. In my mind, the Hard version is almost an optional extra (although when I suggested having just the Easy and Moderate versions, one scientist I was speaking too insisted having the Hard version was important too).
Believe me, I don't go looking for more work to keep myself busy. When this idea was first suggested to me, I tried to put it out of my mind. Too much trouble! But the more I thought about it, the more I saw the need for plain English versions. We need to be communicating the realities of climate science to the general public in a way they can understand. If we're not reaching the average person, then what's the point? -
angusmac at 02:43 AM on 5 August 2010Confidence in climate forecasts
Your statement that climate models are accurate does not appear to be correct. The NASA GISS data up to December 2009 are shown in Figure 1. They are compared with the global warming scenarios presented by Hansen (2006).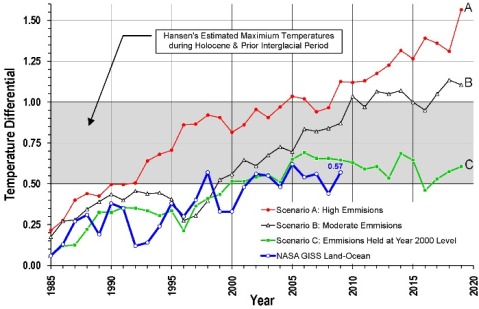 Figure 1: Scenarios A, B and C Compared with Measured NASA GISS Land-Ocean Temperature Data (after Hansen, 2006)
The blue line in Figure 1 denotes the NASA GISS Land-Ocean data and Scenarios A, B and C describe various CO2 emission outcomes. Scenarios A and C are upper and lower bounds. Scenario A is “on the high side of reality” with an exponential increase in emissions. Scenario C has “a drastic curtailment of emissions”, with no increase in emissions after 2000. Scenario B is described as “most plausible” which is expected to be closest to reality. The original diagram can be found in Hansen (2006).
It is evident from Figure 1 that the best fit for actual temperature measurements is the emissions-held-at-year-2000-level Scenario C. This suggests that global warming has slowed down significantly when compared with the “most plausible” prediction Scenario B.
A similar study comparing HADCRUT3 with AR4 may be found here
CONCLUSIONS
It is evident that computer models over-predict global temperatures when compared with observed temperatures.
Global warming may not have stopped but it is certainly following a trajectory that is much lower than that predicted by computer models. Indeed, it is following the zero-increase-in-emissions scenarios from the computer models
Figure 1: Scenarios A, B and C Compared with Measured NASA GISS Land-Ocean Temperature Data (after Hansen, 2006)
The blue line in Figure 1 denotes the NASA GISS Land-Ocean data and Scenarios A, B and C describe various CO2 emission outcomes. Scenarios A and C are upper and lower bounds. Scenario A is “on the high side of reality” with an exponential increase in emissions. Scenario C has “a drastic curtailment of emissions”, with no increase in emissions after 2000. Scenario B is described as “most plausible” which is expected to be closest to reality. The original diagram can be found in Hansen (2006).
It is evident from Figure 1 that the best fit for actual temperature measurements is the emissions-held-at-year-2000-level Scenario C. This suggests that global warming has slowed down significantly when compared with the “most plausible” prediction Scenario B.
A similar study comparing HADCRUT3 with AR4 may be found here
CONCLUSIONS
It is evident that computer models over-predict global temperatures when compared with observed temperatures.
Global warming may not have stopped but it is certainly following a trajectory that is much lower than that predicted by computer models. Indeed, it is following the zero-increase-in-emissions scenarios from the computer models
-
Jim Meador at 02:38 AM on 5 August 2010Communicating climate science in plain English
There is a well-developed body of knowledge from the museum world about how to write clear, concise explanations. The links below have some helpful information for anyone interested... http://www.museumprofessionals.org/forum/member-articles/2424-writing-exhibit-labels.html http://www.serrellassociates.org/labelwriting.html -
Communicating climate science in plain English
How about "In Brief", "Overview", and "Details"? I agree about a tab interface. I've seen several GUI's with inappropriate sliders for discrete steps, and users keep trying to place the slider between those values. -
Doug Bostrom at 02:19 AM on 5 August 2010It's the sun
By the way, Johno's entry to this thread and subsequent arc of discussion was truly classic. Arrogant but otherwise science-related premise leading to a screed about "my money" attached to a myriad of misinformation. An old story but useful. If somebody ends up talking about their money they're not really interested in science and wasting further time in discussion is probably pointless. -
wildrunar at 02:18 AM on 5 August 2010Communicating climate science in plain English
How about instead of "Basic" you use "Quick." The idea being that sometimes you just have to make the point in a hurry before the denalist gets distracted by something shiny. "Intermediate" could then become "More." For those rare cases when the person you're trying to explain it to isn't an indoctrincated denialist, but is instead curious enough to want to know more about the subject after having been won over by the Quick. Then "Advanced" could become "Detailed." I think it unilkely that you would ever need this to actually explain the point to someone, but it's always good to have the information there, because it reinforces the argument. Even if it won't be understood by our newly awakened former denialist, he'll be pleased to know that the science is there. You wouldn't, for example, ever see Creationism laid out with either an Advanced or Detailed tab. -
Doug Bostrom at 02:11 AM on 5 August 2010It's the sun
Johno, pharmaceutical companies spend vast amounts of money "seeing if it works." "It isn't happening and it's good for us" is not very persuasive, leaving aside your contrarian liturgy of wrongness. It leaves me wondering why you're so passionate about proving the case for AGW wrong if you're so keen on it happening. You also might take a look at the Stern Review w/regard to costs and benefits of mitigation. Though criticized in a way remindful of critiques of climate change science, it still has the virtue of existence, something its critics have not been able to address with their own implementation. -
Albatross at 02:06 AM on 5 August 2010Communicating climate science in plain English
Fantastic idea Michael and John! I also have to ask what ProfMandia did @2-- when do you sleep John? Personally I like the terms "basic", "intermediate" and "advanced" (or in-depth, advanced might sound too snotty) levels. 1) Basic-- a one or two liner. Didn't someone recently do that for you, or at least a few of the arguments? 2) Intermediate-- the current level of discussion as it appears on your web-site, maybe some of the jargon and more technical stuff taken out. 3) Advanced-- something you would expect to read in a journal; could also include a list of references. I like suggestions made by Davidhs @20 regarding the content for each of the three categories. John, I was thinking, some readers here and SS app users would probably find it useful to have access to a glossary, or even better, hyperlinks to a glossary, for some of the more technical terms (terms that we scientists might think are basic, but which are confusing or too technical for lay people, one example that comes to mind is "albedo"). A glossary might be superfluous/redundant though-- if you don't get the terminology, go down one level. So maybe a glossary would be more appropriate for the SS site. Wow, what a cool idea this is, wish I weren't so busy right now, or else I'd hop right in and contribute.Response: A glossary has been on the to-do list for a while now. Wasn't it you that suggested it to me a few months ago? :-) Would like to get to this sometime when I get the time. -
Alden Griffith at 02:05 AM on 5 August 2010Has Global Warming Stopped?
Hi Mike, I agree, and I'm well aware of how P values should be interpreted and what they really mean. I intentionally used language that might make a statistician squirm because I'm not trying to communicate to statisticians, but rather the public. The somewhat backwards logic of frequentist statistics is not all that easy to grasp for a lot of people at first. When communicating to the public, I think it's a lot easier to grasp the idea of 92.4% confidence than it is to interpret that there is a 7.6% probability of seeing the temperature trend that we did given the null hypothesis of no trend [a collective "huh?"]. While terminology is certainly important in science, it can really be a stumbling block in our notorious inability to actually communicate to the public. For the purposes of this post, I think saying 92.4% confidence is the way to go. -Alden -
gallopingcamel at 02:03 AM on 5 August 2010Grappling With Change: London and the River Thames
Adaptation is costly but the costs are borne by the local residents. Up to now the Dutch have not just maintained their perimeter; they have created significant new inhabitable areas (e.g. within the Zuider Zee). They seem to think the effort is worth it but for how much longer? The alternative to adaptation is relocation. Relocation or migration brings all kinds of strife, sometimes involving neighboring countries. -
John Mason at 01:49 AM on 5 August 2010Communicating climate science in plain English
John, This is an excellent idea. I'm doing a bit of blogging on climate science and trying to get things explained in everyday terms these days. As post #22 says, it's often very effective to use commonsense everyday context: analogy too can be extremely useful. The critical bit is to explain things accurately, so far as the most up-to-date science is concerned, without sounding patronising. I've worked on-and-off for some years in doing such interpretation in the Earth Sciences - especially hardrock geology - and I fully appreciate the size of the task you have set yourself from experience. I wish you all the best with it. I've been so disturbed by the efforts of the politically-motivated anti-science opposition that I'm determined to move from geology to climate outreach as a career-change. Climate science - indeed, Mankind - needs all the help it can get in terms of improved public understanding. Cheers - John -
Ned at 01:41 AM on 5 August 2010It's the sun
Agreed with JMurphy's comment. Johno, it's generally better to stick with one or two topics in a given comment, rather than tossing in economics, taxation, climate models, climate sensitivity, the fact that CO2 is a small fraction of the mass of the atmosphere, reliability of CO2 measurements, climate change impacts, the CO2/primary productivity relationship, ice ages, and solar irradiance. Throwing everything at the wall to see what sticks doesn't lead to very productive discussions. -
Jim Meador at 01:40 AM on 5 August 2010Communicating climate science in plain English
John, this is really a great idea. I used to work at a Science center in San Francisco, and I know that writing clear, concise, explanations takes a lot of effort but makes a big difference in terms of how much of the content reaches the readers. The key point is not to "dumb down" when writing the "basic" explanations, but to tie into commonsense, everyday context that everyone already has. Experts tend to tie their explanations into a context that non-experts don't possess, and thereby miss the opportunity to communicate all that they know. Naming the three categories must be done carefully, and is a subject worthy of the thought given by others above. You don't want your users to feel like "Dummies" when they go for the basic explanation. I'd be very interested to take a crack at a few of the arguments. How exactly do I submit my proposed text? As a comment? As to the user interface, I would suggest using three tabs instead of the slider. (A slider is more appropriate to a situation where there is a continuum of possible values. Since this particular situation is limited to three possible values, it seems like the wrong analogy.)Response: I'd be very interested to take a crack at a few of the arguments. How exactly do I submit my proposed text? As a comment?
Early next week, I'll start a forum where all the authors can get together and first discuss the general approach, terminology, etc. Then I'm thinking the way authors submit proposed text is to first submit it as a new thread in the forum. That way, other authors can offer feedback/suggestions and the text can be honed before it gets 'officially published'.
But like any social media experiment, who knows how this will evolve - first step is get the forum going then see what happens. -
Ned at 01:30 AM on 5 August 2010Confidence in climate forecasts
kdkd is right -- a top-of-atmosphere radiative imbalance of 0.9 W/m2 corresponds to a climate sensitivity of around 3 C. Ken, I'm not sure you understand the distinction between (a) a radiative imbalance at the top of the atmosphere, and (b) a climate forcing. The number you cite (0.9 W/m2) is the former. The AR4 figure to which you refer discusses the latter. The existence of a TOA radiative imbalance is an inherently transient thing. The existence of an imbalance means that the earth is radiating less energy than it receives from the sun. Over time, this causes the earth to warm up, allowing it to radiate more, which reduces the TOA imbalance. Eventually, that figure will drop back to 0 W/m2, because the earth has warmed up enough to rebalance its radiation budget. Ken's citation of Fig. 2.4 from AR4 relates to uncertainty in the net climate forcing from various sources. There is uncertainty in that total, which in turn leads to uncertainty in estimates of climate sensitivity. But it's distributed around the best estimate of a climate sensitivity of 3 C. If your reaction is "Well, the uncertainty means it could be lower" then you have to equally consider the possibility that "Well, the uncertainty means it could be higher." In the meantime, while trying to narrow that range of uncertainty, we should proceed on the assumption that climate sensitivity is around 3 C. As for Ken's continued claims of "flattening" temperatures, I point out again that most of the past decade had temperatures above the pre-2001 trend: In other words, the 2000s were actually warmer than one would predict based on the rate of warming over the preceding two decades.
-
Englishborn at 01:23 AM on 5 August 2010Communicating climate science in plain English
On the comments issue - I am not techie enough to know if this can be done but if one comment thread were to be used could the comment have a marker stating from which level they are commenting from? From a personal view the idea of splitting comments would likely cause those more knowledgeable and have a better understanding to not read and therefore answer questions or statements in the "lower divisions", which I find very valuable. -
Davidhs at 01:19 AM on 5 August 2010Communicating climate science in plain English
A vote for "thorough" for the third category, rather than words like difficult or hard or even technical. Rather than worrying at this stage about the exact labels, it might help to set out in more detail the characteristics of each category. This would help us all to start thinking along the same lines and have a clearer idea of what is in your mind, rather than just our interpretation of your headings. We will know better what to call each category when we have a clearer idea of what they look like. For example, the first category might (only might, note! I have only spent a few moments on these scribbles.) be as follows: - straightforward statement of the point. Two or three sentences at most, perhaps. - general indication of where the evidence comes from, eg. from Antarctic boreholes. - when this point was established, eg. CO2 greenhouse effect: demonstrated experimentally in mid 19th C. The second category might: - expand the basic statement, - indicate the history of the point, how the argument developed, - indicate the experimental history, - indicate the counter arguments and work on addressing them, - The third category would then be a more thorough discussion, including the maths, the references to the key papers, etc. ... Sorry: being called away to something else now! -
JMurphy at 01:19 AM on 5 August 2010It's the sun
Johno, it appears that you need to start reading some of the threads here at Skeptical Science. Try these, for starters : Models are unreliable We're heading into an ice age It's not bad CO2 measurements are suspect Hanson's 1998 prediction was wrong Animals and plants can adapt to Global Warming The rest of the arguments are here -
Jeff Freymueller at 01:18 AM on 5 August 2010Communicating climate science in plain English
This seems like a workable idea for the App, and for the skeptic arguments page. I just don't see it working on the regular posts, though. Actually, it could work on the posts but not for the comments -- I think any discussion would be far too fragmented, and confusing as different people would be talking about different versions of the same thing. Chaos. So I would vote for using it on the archived skeptic arguments, and using Basic/Intermediate/Advanced as the terminology.Response: Multi-levels would definitely NOT be used for blog posts - this is solely for the skeptic argument rebuttals. -
DarkSkywise at 01:17 AM on 5 August 2010Communicating climate science in plain English
I like Yooper's Basic / Medium / In-Depth. It has a certain "je ne sais quoi". ;)
Prev 2260 2261 2262 2263 2264 2265 2266 2267 2268 2269 2270 2271 2272 2273 2274 2275 Next


