


 Arguments


Recent Comments
Prev 2269 2270 2271 2272 2273 2274 2275 2276 2277 2278 2279 2280 2281 2282 2283 2284 Next
Comments 113801 to 113850:
-
muoncounter at 15:17 PM on 1 August 201010 key climate indicators all point to the same finding: global warming is unmistakable
#103: "there is evidence that solar winds can be a strong indicator of variations in global temperatures." Well, you better be prepared to show that evidence, as there is a wealth of publicly accessible solar wind data out there. For example, here's a picture of the solar wind during that hot year all the deniers find so interesting (1998). And here's 1999
 As a cosmic ray researcher, I know those spikes relate to CMEs. But I wonder: What's the 'strong indicator'? Or will this be just another easily-repeated denier mantra based on a subjective read of the actual research?
-
Josie at 15:12 PM on 1 August 2010Visually depicting the disconnect between climate scientists, media and the public
It would also be quite interesting to compare media reporting and public perceptions in different countries on other issues too (not just climate). I don't suppose anyone knows of any research that has been done into this? Not my area! -
gallopingcamel at 15:08 PM on 1 August 2010What do you get when you put 100 climate scientists in a room?
Pete Ridley (#150 & #151) Sorry to hear that you will be taking a break as many of your comments make perfect sense to me. When Barry Brook pushes nuclear power as the only long term basis for an industrial civilisation I support him. "Renewables" are wonderful but they will not deliver enough power to sustain first world living standards at an affordable cost. Barry's #1 argument for Nuclear Power Plants is to save the planet from increased concentrations of CO2 in the atmosphere. My #1 reason for using nuclear power is economics; NPPs will provide the cheapest electricity in the long term (centuries rather than decades). As you point, out coal is often the source of the cheapest electricity today. When "Scott" posted a study that showed nuclear power as cheaper than coal, my bulls**t detector activated as you will see in this link: http://bravenewclimate.com/2010/07/28/nuclear-power-yes-please-for-cc/#comment-86087 The interesting thing about Barry's blog is that it may help conservatives to work with their political opponents. Maybe Barry can lead us beyond politics. You mention electric vehicles as "personal transport". In my estimation such vehicles can be economic for many uses, including commuting to work. I own an electric car which is fun to drive. I just wish it had the performance of the EV1 described in the Sony movie "Who Killed the Electric Car". I will not be buying a Chevy "Volt" because at $33,500 ($41,000 minus $7,500 government subsidy) it is far too expensive. You can buy a new road worthy electric car here for as little as $3,000 ($9,000 minus $6,000 federal tax credit). -
Josie at 15:08 PM on 1 August 2010Visually depicting the disconnect between climate scientists, media and the public
I would be very interested in analyses that compare the different media and public perceptions in different countries. Does anyone know of anywhere that this has been done or will I have to do it myself? -
tonydunc at 15:06 PM on 1 August 2010Visually depicting the disconnect between climate scientists, media and the public
I would question the media coverage and public perception figures. i do not think either are as negative as these graphics portray. I have not read or heard about studies that show only 26% of the public thinks Global Warming is real. And unless one is including the right wing blogoshere, I doubt the media coverage is only 28% supportive. I would guess it is more like 50-50. And I have seen polls that showed significantly more than 50% believe ACC is real and happening. There is no need to exaggerate the problem, since the disconnect between 97% and even 60% is a serious problem @Thigadonta@4 You are right that scientists should not be determining policy, other than as concerned citizens. and they should be contributing only to their areas of expertice. The problem is that almost NOTHING is being done, there is NO policy toward climate change, which means the policy is effectively to do nothing. You can't really expcet scientists who understand what is happening to not react. I see a similar situation with military leaders. While they are subordinate to the civilian political structure their obligation is to advise on national security. In 1938 after Germany had annexed Austria and Sudetenland, and Japan had occupied China and indochina, would you consider it improper for military leaders to say we have to do SOMETHING to defend against German and Japanese Military. it is POSSIBLE we won't go to war, but we NEED to do something. Some scientists are convinced the situation is drastic and are proclaiming that we need to radically change our economy and way of life. It is certainly their right to do that, as long as they are not saying that there view is the only possible way to look at the science. In fact the media is NOT covering what you actually suggest they do. There are numerous state federal and private collaborations studying the various economic social and political options including a wide range of expertise, including scientists, economists and public policy experts who are trying to develop broad based approaches based on real science. I just met someone tonight who is going to work at Yale School of Forestry & Environmental Studies, which is doing great work in this area, but the media is focused on being "fair" about climate change, so the groups like this doing the real work don;t get any real exposure. the media doesn't get into the details because it is still milking the "conflict" about the science. -
huntjanin at 14:47 PM on 1 August 2010Visually depicting the disconnect between climate scientists, media and the public
A heretical comment: In American frontier history, there's a fine story about how, when a 19th century mountain man (beaver trapper) rode away from a campsite, he did not notice that his "possible sack" (a small sack contained flint, steel and other items essential for survival in the wilderness) had fallen off his saddle and lay in the dust. His friends at the campsite saw it fall, but said nothing. When a visiting Englishman asked them why, the answer simply was: "He'll find soon enough." By the same token, don't you think that the deniers will find out "soon enough" even if we say nothing more about the perils of global warming? -
MattJ at 13:33 PM on 1 August 2010Visually depicting the disconnect between climate scientists, media and the public
thingadonta #4: It may be true that the press is reacting to the policy, not the science, but aren't you missing the point? They are reacting to the policy because they do not accept or understand the science that lies behind it. That science is: AGW is real, it is a real problem, we must act NOW to keep it from being an absolute disaster for our descendants. In fact, now is already rather late: we should have acted in the 80s. Once this is understood, then the policies proposed no longer seem so very outrageous. On the contrary: they are all inexpensive and even mild compared to the outrageous high cost (politically and economically) our descendants will pay should we continue to do nothing to mitigate AGW. -
Daniel Bailey at 12:51 PM on 1 August 201010 key climate indicators all point to the same finding: global warming is unmistakable
Re Geo Guy at 09:40 AM on 1 August, 2010, who said: "Daniel # 105 - see my comment above. That argument is predicated on the assumption that solar output was significantly lower than current levels which I believe is incorrect." Dude, I have to agree with Doug Bostrom (#112 above): dissing not only the physics of greenhouse gases AND the physics of stellar atmospheres because you don't like the results? Crowley and Berner looked into the issue of CO2, temperatures and solar output in the Ordovician in their paper here. Another good resource on the changes in the solar constant over time can be found here. Instincts, a willingness to learn and a normal level of skepticism are good things. I've seen you make some good insights when trying to explain your positions in previous posts. But your response above was...disappointing. You're capable of better than that. The Yooper -
thingadonta at 12:42 PM on 1 August 2010Visually depicting the disconnect between climate scientists, media and the public
re #1 : "Notice how the media coverage and public perception percentages are almost identical?" I would suggest that most media coverage supposedly not supporting the 'consensus', is actually questioning public policy relating to it, not the science. The disconnect between the 'consensus' and media coverage suggests there is something currently fishy with the 'consensus', not the media; and most of this probably relates to public policy issues which is often intermingled within the 'consensus', rather than the science itself. Part of the problem almost certainly lies in the distinction between science, and public policy-ie what 'ought' to be done about something. This is a value judgement, and technically, science can't make decisions about value judgements, yet many scientists within the 'consensus' often report that it can, and betray their own value judements. 'Science says' we should' do this' or 'we should do that'. The 'should' often reflects people's relative values, and more often than not, advocates use only that branch of science which supports their value position. Their 'science' is often correct/well-established, its just that often it is not the only relevant data. This is especially the case, for example, in land tenure issues, where an area may have competing values and interests: eg "the science says this area should be set aside for National Park". This is not a scientific statement, it is a value judgement, which depends on relative community values, and a range of datasets-social, economic, and conservation/environmental. It is essentuially the same with climate change science and public policy. Climate change policy must take into account social, economic, and environmenal/'natural' science data, in conjunction with relative community values. Part of the role of the media is to examine the relationships between the above: socio-economic data, environmental data, and relative community values, to report on what is largely a political process. Some scientists don't understand this process, and essentially want to subvert and corrupt it for their own narrow, specialised, interests. I'm pretty sure the statistics given in the above arcticle fail to make the proper distinction also; there is a difference between what the science says, and what policies ought/ought not, to be put in place. This probably largley explains the disconnect between the 'consensus' and the media. -
Cornelius Breadbasket at 11:49 AM on 1 August 2010Visually depicting the disconnect between climate scientists, media and the public
An incredibly revealing and useful graphic - thank you. I think (hope) that the wave of denial is now on the wane although my experience is restricted to the UK. News stories like this may be helping. -
Rob Painting at 11:24 AM on 1 August 2010Visually depicting the disconnect between climate scientists, media and the public
Yes, the mainstream media coverage, therein lies the problem. Notice how the media coverage and public perception percentages are almost identical?. -
kdkd at 11:12 AM on 1 August 201010 Indicators of a Human Fingerprint on Climate Change
johnd #37 The carbon fingerprinting in parts relates to the proportion of C14 isotope in the atmosphere showing that the increase in carbon content of the atmosphere is caused by the burning of fossil fuel (which is C14 depleted due to its age). The second part of the "fingerprinting" which is more a model prediction borne out by observation, is that the increase in night time temperatures should be greater than the increase in day time temperature (solar effects would be opoposite to this). These are long term measurable things. We don't have the same radioisotope measurement capability for the water cycle, and the water cycle is probably more complex than the carbon cycle. -
Doug Bostrom at 11:00 AM on 1 August 201010 key climate indicators all point to the same finding: global warming is unmistakable
I believe the statement regarding solar variation in the Ordovician is simply a statement of convenience and bears no credibility. Be careful. The sun is a main sequence star; output during the Ordovician is predicted to have been some 3.5-5% less than during the present. Taking on a whole other realm of science (solar physics) to make an argument against C02 as a significant greenhouse gas is going to be difficult. -
barry1487 at 10:35 AM on 1 August 201010 Indicators of a Human Fingerprint on Climate Change
Thanks for the replies. Let's see if I have this right... There is currently an imbalance between the amount of energy coming from the sun, and the amount of energy being radiated by the Earth/atmosphere, because CO2 increase has prevented some long-wave radiation escaping to space. If we were to freeze all CO2 emissions today, global temperatures would increase for a while until the atmosphere was in radiative balance with the incoming solar energy. With photons zipping in every direction at the speed of light, being absorbed and re-emitted by gas molecules in the atmosphere, why isn't equilibrium established quickly? Is it that the surface is slower to warm, thus keeping the atmosphere cooler and out of radiative balance with solar energy?Response: You've pretty much got it right. The reason why the climate takes a little while to return to equilibrium is because the oceans have a great deal of thermal inertia - as our climate is accumulating heat due to the energy imbalance, it takes a while for the oceans to warm up to the point where our planet is once again radiating enough energy to match the incoming sunlight. -
johnd at 10:31 AM on 1 August 201010 Indicators of a Human Fingerprint on Climate Change
I find it interesting that water vapour and clouds are not mentioned as being measured fingerprints. Irrespective of what CO2 levels are currently doing, AGW depends on the amplifying effect of water vapour. Is their absence acknowledgment that perhaps water vapour and clouds may not be part of the human fingerprint? With regards to solar activity perhaps the most relevant measure is the AA index which tracks the solar coronal magnetic field strength. Response: I could only fit 10 fingerprints in that picture. I'm now planning a sequel, "10 more human fingerprints on climate change".
 -
Doug Bostrom at 09:55 AM on 1 August 2010The Past and Future of the Greenland Ice Sheet
Robert Wray just recently did a nice post here on SkS on "how ice sheets lose ice." Worth a look in reference to John Russell's questions. -
Geo Guy at 09:40 AM on 1 August 201010 key climate indicators all point to the same finding: global warming is unmistakable
Chris # 104 - I post two graphs, the first is at: http://www.geocraft.com/WVFossils/PageMill_Images/image354_lg.gif ..where CO2 from Antarctica ice core is compared to plant CO2 as a proxy....so in my view the plot is about CO2 concentrations as deduced from plant stomata. The second graph I posted was to the CO2 vs temp graph which I agree has nothing to do with plant stomata. The two graphs were posted for two purposes. The first to show that there are valid arguments to support the contention that historical CO2 concentrations were higher than those determined from ice core data. The second was to show that over geological time a plot of temp vs CO2 indicates there is not a close correlation between the two, albeit there are periods where a correlation appears to exist. To me this suggests other factors are at play when it comes to the earth's temperature. I read the link regarding the Ordovician and I take exception to the statement "During the Ordovician, solar output was much lower than current levels." On what basis was this statement made? If you read further, no mention is made about solar output. Given that it is only in the last 40 years of so that we have been able to measure the sun's radiation and that proxies for those measurements go back to only about 1400, I believe the statement regarding solar variation in the Ordovician is simply a statement of convenience and bears no credibility. With regards to my argument on thermodynamics, it certainly does apply. Most undergraduate courses when I was at university had a simple lab assignment which was to take a set volume of ice, measure the heat needed to melt that ice and then take the resulting water, heat it with the same amount of energy that it took to melt the ice. In the end, the temperature that was reached was 140 F. When you deal with glacial ice, a lot more energy is needed to melt that ice. An uptick of less than 1 degree C over 100 years will not, in my view, provide enough energy to melt glaciers such as Greenland. I would contend the culprit is the initial sun radiation that hots the earth and not the reflected radiation. Daniel # 105 - see my comment above. That argument is predicated on the assumption that solar output was significantly lower than current levels which I believe is incorrect. KR # 107 - while I accept some of what you have posted, as you know using a mean or average temperature as many climate scientists seen to use, is very sensitive to outlier measurements. If you investigate global temperatures over the time period 1900 to the present, there were a number of instances where warm anomalies coincided with el Nino as demonstrated in the graph. However there does seem to be a close correlation between periods of el Nino activity and higher global temperatures. In order to have a greater degree of confidences that the warming is due to rising CO2, data sets should be filtered to exclude the el Nino effect. I do not believe that they have done that. http://www.appinsys.com/GlobalWarming/GlobalElNino.htm ..my apologies to the moderator..I answered a post that was in response to an earlier post. I don't dispute the contention that the earth seems to be heating up..I've posted that earlier in this blog. What I do contend is that the science does not support the contention that the increase in global temperatures are driven by increases in atmospheric CO2. I will post my theory regarding the source of CO2 accumulation in the atmosphere in the near future. It is something I want to put together off line and to get it down to a minimum of words so I don't hog a lot of space here. -
MattJ at 09:06 AM on 1 August 2010The four sides model for improving climate communication
At the risk of sounding too much like someone from the Aspen Institute, I will say that we all have a lot more to learn from Aristotle's "On Rhetoric" than from this Schulz von Thun. The latter's "four sides" model is inappropriate for the problem at hand for many reasons, but mainly for the following two: 1) when von Thun is described as "expert at _inter-personal_ communication", that means exactly what it sounds like: his model is more appropriate for describing (mis)communication between husband and wife or father and children. I doubt he even really meant it for policy debate. 2) the model confuses under four heads, notions that are really different. Perhaps Marchand was admitting as much, when he said, "the channels are never so clearly defined". But the confusion is unnecessary, and wholly absent from Aristotle's classic on the subject. So, for example, his channel labedled'appeal' is simply wrong: the main sense of 'appeal' we have to be concerned about in these debates is a rather different sense of the word, namely, "what is the (emotional) appeal to the listener of the argument?" This is something that Aristotle analyzed very well in http://classics.mit.edu/Aristotle/rhetoric.html. The authors of the various articles on Skeptical science are very good at presenting the facts, or, as Aristotle put it, at the Dialectic, but not so good at Dialectic's counterpart, Rhetoric. It is high time to address this imbalance. -
CBW at 09:01 AM on 1 August 2010The Past and Future of the Greenland Ice Sheet
dansat says: "I have a tiny vial of water with me (Still travelling toward home) that was from ice at the bottom of the core. The water is from snow that fell in Greenland 150K years ago!" This is proof that Greenland ice loss isn't being caused by global warming. The real cause is all these scientists who are trying to get rich off of global warming carrying the ice away themselves. -
Ken Lambert at 08:47 AM on 1 August 201010 Indicators of a Human Fingerprint on Climate Change
muoncounter #35 You are right about the 30% of TSI reflected out to space. I realized the error after posting and shutting dowm for the night. The figures I quoted should reduce from 1400 E20 Joules to approx 1000 E20 Joules, and the time from 22 years to about 15 years. Still significant I would have thought. -
chris at 08:28 AM on 1 August 2010Plant stomata show higher and more variable CO2 levels
David Middleton at 07:00 AM on 1 August, 2010 GeoCarb is a (very nice) model with 10 million year resolution. I don't see how you can use this to say that much about what true [CO2] levels were in the past at high resolution. It certainly doesn't "trump" direct measurements. Plant stomata frequency estimates of past [CO2] have large uncertainties (e.g. +/- 30-60 ppm; see a recent analysis of reconstruction uncertainties in Betula nana leaves). I think these studies are fine, and useful for estimating broad atmospheric [CO2] levels (or changes in [CO2] levels) in the deeper past, but one should accept that these are not precise measures. The NASA AIRS comparison is misleading since these are generally shown as snapshots. If one averages a full years worth of AIRS data, then the yearly averaged difference between polar and equatorial (say) [CO2] is only a few ppm. It's not reasonable to compare AIRS snapshots with ice core data (or stomatal data for that matter!) which is significantly temporally averaged. Obviously the mechanism for sealing off atmospheric samples in ice cap or glacial firn results in a considerable multiyear averaging of the atmospheric [CO2]. In the high resolution Law Dome core the averaging is smallish, whereas in the deep Antarctic cores the averaging may encompass a large number of years (can't remember off hand, but this may be a hundred years or more???). However considering the high resolution Law Dome data and the last couple of thousand years, I don't see any basis for concluding that the ice core data is biased low as you suggest. Yes, it's smoothed (it's something like a 10 year running mean); but (just like contemporary [CO2] variation), we expect rather low amplitude variability in [CO2] at high resolution. Yes, the natural variability (likely largely ENSO-related, with perhaps some significant wildfire variability) encompassing a few ppm will have been smoothed out. But it's not reasonable to think that we are missing large jumps and falls in [CO2], apart from anything else, because largish non-ENSO-related increased [CO2] levels take a long time to drop, and so they should stil be observed in cores. In any case if we're not seeing them (i.e. high resolution, large amplitude jumps and falls in [CO2]) during the last 50 years of very high resolution measurement, what is the basis for expecting that these occurred in the past? Incidentally, I don't understand the reference to "skeptics" in your last paragraph. These guys/gals are just scientists working to improve their methodologies and obtain insight into the past. I don't think one should adopt the false notion that science is composed of groups of people that have one view of the science and others that are "skeptics". If the group of people you refer to were "trying to debunk AGW" they would be wasting their careers. Science simply doesn't work like that... -
michael sweet at 07:51 AM on 1 August 201010 key climate indicators all point to the same finding: global warming is unmistakable
BP, You are arguing that scientists like James Hansen are too concerned about CO2 that they are ignoring black carbon by citing a paper by James Hansen about the problem of black carbon. To me that is a contradiction in terms. Dr. Hansen is very active in promoting lowering CO2 in the atmosphere. He also says that we should lower black carbon immediately as it is easier to control. Your suggestion that scientists ignore other issues while they promote control of CO2 is simply false. A glance at the IPCC report will show that it includes many sources of AGW, but CO2 is the largest. We do not yet debate the best ways of limiting global warming here on SS. When we do we will consider all sources of warming. -
J Bowers at 07:15 AM on 1 August 2010The four sides model for improving climate communication
Re. 1 dcruzuri I think there's a No.7, which is different to No.5 or 6, and I come across more and more often: Those who believe climate change and temperature increase is beneficial for mankind, CO2 emissions should continue to increase as it will benefit crop output and therefore feed the hungry, and curbing CO2 emissions is tantamount to genocide. -
David Middleton at 07:00 AM on 1 August 2010Plant stomata show higher and more variable CO2 levels
Van Hoof et al., 2005 demonstrated that the ice core CO2 data essentially represent a low-frequency, century to multi-century moving average of past atmospheric CO2 levels.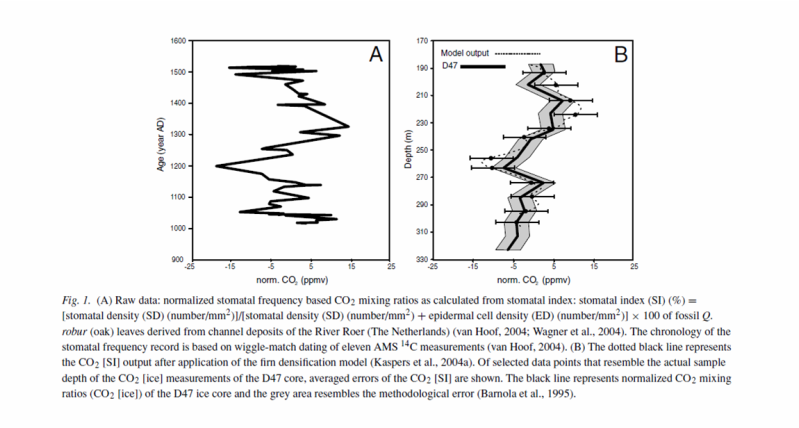 Van Hoof et al., 2005. Atmospheric CO2 during the 13th century AD: reconciliation of data from ice core measurements and stomatal frequency analysis. Tellus (2005), 57B, 351–355.
Three separate lines of scientific evidence indicate that Antarctic ice cores underestimate the average global atmospheric CO2 concentration by 20-40 ppmv:
1) GeoCarb
2) Plant stomata
3) NASA AIRS satellite measurements
See my Debunk House post for an in depth discussion.
By the way... Wagner, Van Hoof, Kouwenberg and the other botanists publishing papers on plant stomata & atmospheric CO2 are generally not "skeptics." They are looking for a pre-industrial coupling of CO2 & temperature. They aren't trying to debunk AGW.
Van Hoof et al., 2005. Atmospheric CO2 during the 13th century AD: reconciliation of data from ice core measurements and stomatal frequency analysis. Tellus (2005), 57B, 351–355.
Three separate lines of scientific evidence indicate that Antarctic ice cores underestimate the average global atmospheric CO2 concentration by 20-40 ppmv:
1) GeoCarb
2) Plant stomata
3) NASA AIRS satellite measurements
See my Debunk House post for an in depth discussion.
By the way... Wagner, Van Hoof, Kouwenberg and the other botanists publishing papers on plant stomata & atmospheric CO2 are generally not "skeptics." They are looking for a pre-industrial coupling of CO2 & temperature. They aren't trying to debunk AGW.
-
John Russell at 06:05 AM on 1 August 2010The Past and Future of the Greenland Ice Sheet
mspelto at 05:26 AM on 1 August, 2010 Thanks for the response. Hope you get time to answer this before you leave! The way you describe it -- and certainly the way it looks on the diagrams -- it sounds like the whole of central Greenland (where ice is a mile thick?) is an accumulation zone. Is this correct? Is, in fact, the whole of Greenland, in effect, one big glacier that radiates out in all directions? Is that a good way to visualise it? If so has anyone mapped the direction of travel of the ice around that continent? Sorry if the questions seem naive to the experts but it's important that we laypeople understand the way the mechanism works. -
Doug Bostrom at 06:03 AM on 1 August 2010The Past and Future of the Greenland Ice Sheet
Further to mspelto, key concepts: Accumulation zone, ablation zone. Easy enough, once it's pointed out. The example is helpful in determining the utility of Monckton's presentations. -
muoncounter at 05:38 AM on 1 August 201010 Indicators of a Human Fingerprint on Climate Change
#33: "The integral of [area under] this curve (divided by 4) is roughly the total Solar energy added to the Earth system since 1920." Isn't a significant fraction of TSI (30% as shown below) reflected back into space? The papers cited at Argument #1 give significantly different conclusions from yours.
-
mspelto at 05:29 AM on 1 August 2010The Past and Future of the Greenland Ice Sheet
Tomorrow I leave for the 27th consecutive glacier mass balance field monitoring season. I should note that even on small North Cascade glaciers we hope our stakes in the accumulation zone get buried and do not reappear for many years until they move down glacier. Unfortunately in 2005 and 2009 even the accumulation zone lost all of its recent snowpack. -
mspelto at 05:26 AM on 1 August 2010The Past and Future of the Greenland Ice Sheet
#14 The key is that the radar station is built in the accumulation zone where the snow pile up every year slowly burying any object place on it. Eventually this object will move into the ablation zone where melting dominates every year. If an object placed in the accumulation zone does not get buried we are in trouble. -
John Russell at 04:52 AM on 1 August 2010The Past and Future of the Greenland Ice Sheet
I'd be grateful if someone could help answer a question put to me by a denier regarding Greenland ice mass. He used an illustration from one of Monckton's lectures showing photographs of radar stations sitting on top of the ice sheet where the ice was purportedly a mile thick. The slide showed photos of the radar stations when they were first built, sitting on top of the ice, and then ten years later (and the same month of the year) buried in deep snow. Monckton -- and my denier friends's -- argument was that it was blindingly obvious proof that the ice sheet was not melting but was in fact accumulating. My counter was that A) soft snow would be removed before a structure was erected, and then re-accumulate. B) Snow packs down, so it's quite likely that the radar station would settle and soft snow would accumulate. And C) why would the ice melt from the top? Melting polar ice melts, and moves, down towards the sea and the radar stations could all now be lower than they once were -- even though snow still falls (because more snow falls as temperatures rise). Of course my response was purely conjecture -- and thus unconvincing -- but I couldn't find anything on-line that specifically addressed this anecdotal 'evidence'. Any thoughts/links/whatever, gratefully received. -
Doug Bostrom at 03:51 AM on 1 August 201010 Indicators of a Human Fingerprint on Climate Change
Worth noting, temporal changes of TOA flux could tell us something useful. The integral of a constant energy flux is a linear rise in total energy. If temperature is roughly proportional to energy input (which is so with specific heats of materials) then a rising temperature curve is no surprise. Needs to take into account radiation; for an object radiating IR temperature will not be directly proportional to energy input. So a constant energy flux will not produce a linear rise in total energy, not for Earth anyway. -
Doug Bostrom at 03:36 AM on 1 August 2010The four sides model for improving climate communication
Chiming in with dcruzuri, a thought-provoking post that causes me to scrutinize my own efforts and motivations. Thanks! John Cook caused me to reevaluate what I presume to call my "communications." I've got a proclivity toward mocking humor that may be enjoyable for some but is not at the end of the day probably very effective for communicating. On another note, this climate affair is becoming a matter of serious interest to social scientists. Lots of puzzling features to investigate. Nice to see a post looking at the scene from that perspective. -
dhogaza at 02:37 AM on 1 August 2010The Past and Future of the Greenland Ice Sheet
I have a tiny vial of water with me (Still travelling toward home) that was from ice at the bottom of the core. The water is from snow that fell in Greenland 150K years ago!
Dansat is way cooler than the rest of us put together ... What were you doing there? -
chris at 02:35 AM on 1 August 2010The Past and Future of the Greenland Ice Sheet
sorry, I mangled a sentence and didn't spot it before posting. Under (ii) it should say. "The rapid rate of warming during the 20's to 30's almost certainly had a strong contribution from the recovery following the suppression of temperatures associated with the prolonged period of high volcanic activity from the late 19th century through the first decade of the 20th century (e.g. see Figure 11 of Box et al, 2009)." -
chris at 02:25 AM on 1 August 2010The Past and Future of the Greenland Ice Sheet
angusmac at 00:24 AM on 1 August, 2010They conclude that current temperatures are, “well below” those reached in the 1930s and 1940s.
No, angusmac, that's a false précis. The term “well below” was used only once in Chylek et al. 2006, and refers specifically to the years 2004 and 2005 in one location (Ammassalik)! The passage containing “well below” is reproduced below and we can look at those two words in context [*]. It’s obvious from the Figure you reproduced that current temperatures in those coastal sites in Greenland are similar now to temperatures in the 1930’s/1940’s. [*] (my highlight) [see near start of section 5. of Chylek et al (2006)]”The year 2003 was extremely warm on the southeastern coast of Greenland. The average annual temperature and the average summer temperature for 2003 at Ammassalik was a record high since 1895. The years 2004 and 2005 were closer to normal being well below temperatures reached in 1930s and 1940s (Figure 2).
Otherwise it’s worth being a little more considered about the data on the progression of Greenland temperatures during the 20th century which indicates: (i) Current Arctic temperatures are warmer now than during the 1930's/40's, (ii) early 20th century Greenland temperature rise likely had different causes to current warming, and (iii) the evidence supports the conclusion that Greenland will continue to warm quite a bit further in the coming decades ( barring large volcanic events): (i) A recent multiproxy temperature reconstruction (Kaufmann et al, 2009) indicates that the last decade was the warmest in the Arctic for the last 2000 years, and 20th century warming has reversed a long term (and extremely slow 0.22 oC per mellenium) cooling trend. Contemporary temperature measures indicate that the Arctic as a whole is warmer now than during the mid-20th century, even if Greenland itself may be not much warmer (and accordingly Arctic sea ice retreat was likely minimal during the time of the apparent Greenland summit temperature max). (ii) The Greenland ice sheet is very sensitive to volcanic (and also solar and aerosolic) variability, with volcanic activity greatly suppressing temperature responses to global warming. A recent study of Greenland temperature (Box et al, 2009) also found that Greenland was around as warm (and possibly a tad warmer) during 1930-40 than now. The rapid rate of warming during late 20's to late 30's almost certainly had a strong contribution to the suppression of temperatures associated with the prolonged period of high volcanic activity from the late 19th century through the first decade of the 20th century (e.g. see Figure 11 of Box et al, 2009). We should also consider black carbon (BC) which has a strong warming effect when it's deposited on snow/ice; BC levels are identified in Greenland cores (McConnell et al, 2007) and were high through the period of rapid warming (they dropped in Greenland once Western industrial nations cleaned up emissions in the 50's, and BC is largely from Asia now,and mostly affecting the Himalayas). (iii) So one does need to be careful with attributing temperature variations in Greenland. These are not necessarily related to phenomena that influence Arctic temperatures overall. Obviously in the present widescale warming both Greenland and the Arctic as a whole are warming. One of the potentially concerning observations of Box et al is that Greenland tends, as a result of “polar amplification” to retain a phase relationship with overall N. hemispheric warming, such that it eventually rises to a temperature anomaly around 1.6 times that of the N. hemisphere. It’s way below that now, and if this relationship holds up Greenland has got quite a lot of warming (1-1.5 oC) just to “catch up”. Kaufman DS, et al. (2009) Recent warming reverses long-term Arctic cooling. Science 325:1236–1238. Box, J. E.et al (2009) Greenland Ice Sheet Surface Air Temperature Variability: 1840–2007. Journal of Climate, 22, 4029-4049. McConnell et al (2007) 20th-Century Industrial Black Carbon Emissions Altered Arctic Climate Forcing Science 317, 1381 - 1384 -
angusmac at 00:24 AM on 1 August 2010The Past and Future of the Greenland Ice Sheet
Perhaps your data period is too short for a reasonable comparison of recent Greenland warming? Chylek et al (2006) show that the rate of warming in, “1920-1930 was about 50% higher than that in 1995-2005.” They conclude that ,”… the current Greenland warming is not unprecedented in recent Greenland history. Temperature increases in the two warming periods are of a similar magnitude, however, the rate of warming in 1920-1930 was about 50% higher than that in 1995 - 2005.” They summarise that they, “… find no direct evidence to support the claims that the Greenland ice sheet is melting due to increased temperature caused by increased atmospheric concentration of carbon dioxide…The temperature trend during the next ten years may be a decisive factor in a possible detection of an anthropogenic part of climate signal over area of the Greenland ice sheet.”. They conclude that current temperatures are, “well below” those reached in the 1930s and 1940s. I enclose a copy of their chart of Greenland temperatures from 1900–2005 which appears to support their conclusion. Figure 1: Comparison of Current Greenland Temperatures with Previous Temperatures (Chylek et al, 2006)
Perhaps we should wait until definitive records over a longer timescale are available before we reach unwarranted conclusions about AGW causing melting of the Greenland icecap?
Figure 1: Comparison of Current Greenland Temperatures with Previous Temperatures (Chylek et al, 2006)
Perhaps we should wait until definitive records over a longer timescale are available before we reach unwarranted conclusions about AGW causing melting of the Greenland icecap?
-
Ken Lambert at 23:57 PM on 31 July 201010 Indicators of a Human Fingerprint on Climate Change
muoncounter #31 michael sweet #30 BP is correct about the TOA imbalance not being 'measured' - but implied by models. Dr Trenberth's 0.9W/sq.m is a net of several theoretical warming and cooling forcings and feedbacks including radiative cooling from the 0.75 DegC warming of the Earth since preindustrial times when the CO2 concentration was about 280ppmv. Your Temperature vs. Solar Activity chart could be looked at this way: The integral of a constant energy flux is a linear rise in total energy. If temperature is roughly proportional to energy input (which is so with specific heats of materials) then a rising temperature curve is no surprise. Assume your baseline 11 year moving average TSI is 1365.5W/sq.m. Ignore the 11 year solar cyclic variation. It rises to about 1366W/sq.m from 1920 to 1950 and flatlines on a slightly falling trend up to date. The integral of the area under this curve (divided by 4) is roughly the total Solar energy added to the Earth system since 1920. A TSI difference of 0.5W/sq.m divided by 4 = 0.125W/sq.m which equals about 20E20Joules/year. For the 1920-1950 period this sums to about 300E20 Joules. For the 1950 - 2005 period this sums to about 1100E20 Joules. Total - roughly 1400E20 Joules. Dr Trenberth estimates that in the 2004-08 period total energy absorbed by warming land is 2E20 Joules/year, and melting total land ice is 2E20 Joules/year and Arctic Sea Ice is 1E20Joules/year. Total for all three: 5E20 Joules/year. OHC increase is highly uncertain however let's use his estimate of 20-95E20 Joules/year. Using an average of say 58E20 for OHC plus 5E20 for all other sources - we get 63E20Joules/year of energy absorbed by OHC increase and all the ice melt and land warming. We have Solar imbalance energy input since 1920 of roughly 1400E20 Joules divided by 63E20 Joules/year (at 2004-08 rates) = 22 years equivalent. The majority of the warming has occurred over the last 30 years, so 22 years equivalent solely attributable to Solar at the 2004-08 rate is highly significant. -
dcruzuri at 23:53 PM on 31 July 2010The four sides model for improving climate communication
A very insightful post. I want to contribute a different perspective, one I learned on my work trying to abolish the death penalty. This approach is designed to help you communicate better by understanding your audience and understanding what you are trying to accomplish. The theory is that anyone you are speaking to will fall somewhere on the following six point scale: 1 -- Totally committed: believes climate change is a serious issue and is committed to working in some way towards a solution. 2 -- Convinced climate change is a problem, but is less certain about how serious the problem is and/or is less engaged in dealing with it. 3 -- Somewhat uncertain on the subject of climate change, but leans toward believing it is a problem. 4 -- Uncertain about climate change, but leans towards believing it is not a problem or has been over-hyped by activists. 5 -- Does not believe climate change is a problem, or believes that proposed solutions are more destructive of society etc. than the problems they purport to fix. Believes nothing should be done. 6 -- Actively denies climate change and works to prevent the dissemination of information or the implementation of any solutions of the problem. Obviously these divisions are somewhat arbitrary, and other facets of support/opposition can be included. Think of these not as discrete boxes but markers on a spectrum. The goal of any discussion is not to move a person from where they are to #1: this simply will not happen and will often entrench the person you are speaking to more strongly in where they are, or even move them in the opposite direction. Rather, the goal is to move a person one stage up the scale: from firm opposition to uncertain, from uncertain to weak concern, from weak concern to strong concern, and finally to activism. People in #6 may be immovable, but in speaking to them you have to remember that there will be a lot of #5's and #4's listening. Our belief in using this in anti-DP work is that we will win if we can move a majority of people one step up. -
dansat at 23:25 PM on 31 July 2010The Past and Future of the Greenland Ice Sheet
Exc. post. I just returned from 9 days on the Greenland ice sheet at the NEEM drill site. They succeeded in bringing up the oldest ice ever recovered from Greenland. The Eemian and even the penultimate ice age before it is represented. There are some surprises in the ice core. There seem to be some rapid descents into colder conditions than are normally seen. The rapid (very rapid) warmups are also seen. They were able to do do 018 measurements as the core came up and the Eemian shows up very clearly. I have a tiny vial of water with me (Still travelling toward home) that was from ice at the bottom of the core. The water is from snow that fell in Greenland 150K years ago! dan -
Tenney Naumer at 23:05 PM on 31 July 2010The Past and Future of the Greenland Ice Sheet
Sorry, forgot to say that this was a really excellent post. -
Tenney Naumer at 22:49 PM on 31 July 2010The Past and Future of the Greenland Ice Sheet
I'm pretty sure that the figures (from a 2008 pub) for the portion of mass balance loss due to melt runoff are dated. Newer studies indicate that the runoff is moving closer to half of the mass balance decline. This makes sense since the edges of the ice sheet are retreating rapidly, reducing feed to the outflow glaciers, while at the same time the melt lakes and moulins are increasing in size and quantity, and quite rapidly these days. Sorry, I don't have that study at the tip of my fingertips, it's somewhere on my blog, for sure, but others may be aware of it. -
Berényi Péter at 22:29 PM on 31 July 201010 Indicators of a Human Fingerprint on Climate Change
#30 michael sweet at 12:29 PM on 31 July, 2010 Since we measure an energy imbalance at the top of the atmosphere (TOA), this is strong evidence of global warming. Come on. We do not measure it in any meaningful sense of the word. Why disseminating misinformation? AMERICAN METEOROLOGICAL SOCIETY March 2009 BAMS | 311 EARTH’S GLOBAL ENERGY BUDGET by Kevin E. Trenberth, John T. Fasullo, and Jeffrey Kiehl "There is a TOA imbalance of 6.4 W/m2 from CERES data and this is outside of the realm of current estimates of global imbalances" That is, energy imbalance at the top of the atmosphere (TOA) is measured to be 6.4 W/m2, but that's impossible. Therefore accuracy of measurement is so low, that imbalance is not measured at all. Precision is a bit better, but that only gives temporal changes of TOA imbalance, not its absolute value. As far as radiation measurments are concerned, imbalance can even be negative, that is, Earth would lose heat instead of gaining it. It's only computational climate models that tell us otherwise, not measurements. OHC (Ocean Heat Content) measurements are also consistent with a negative energy balance. -
Doug Bostrom at 21:12 PM on 31 July 2010Waste heat vs greenhouse warming
Almost to "Music of the Spheres," as I predicted. RSVP, have you ever heard of "cosmic microwave background radiation?" -
huntjanin at 20:35 PM on 31 July 2010The Past and Future of the Greenland Ice Sheet
For Daniel (no. 5): Thanks very much. I'm writing an introductory survey on sea level rise and, being a mere generalist, need to rely on the kindness of strangers like you. Would you have any interest in reading (I can't pay you anything) my draft Preface, which describes the IPCC; draft Introduction, which tries to be a primer on global warming; and/or Chapter 1, which seeks to explain why sea level rise is important. If interested, please contact me off line at huntjanin@aol.com -
kdkd at 19:08 PM on 31 July 201010 key climate indicators all point to the same finding: global warming is unmistakable
BP #108 I can see a significant problem with your hypothesis, to wit: CO2 fully mixes in the atmosphere, and as a result its effects are global. Black soot does not, so its primary effects are local. Do the climate models predict and observations confirm the local effects consistent with black soot playing a major role in climate change to date? Well because black soot is an indirect solar effect, we might expect it to be observed most in the day time if it was the major driver of climate change. However, instead we see more warming at night which is a signature of increased greenhouse gasses. Nice try, but it's yet more trying to chip around the edges to give an illusion of greater than justifiable uncertainty. You especially need to get rid of the emotional expressions that hint at conspiracy theory ("for God's sake, why"), and to stop presenting hypothesis as conclusion. -
muoncounter at 16:33 PM on 31 July 201010 Indicators of a Human Fingerprint on Climate Change
#30: "This heating up is Global Warming. Since we measure an energy imbalance at the top of the atmosphere (TOA), this is strong evidence of global warming." Here is additional direct evidence of global warming (and I must thank BP in the prior thread for his remarks about snow cover (comment #91) for reminding me about that dataset. Look at the NH snow cover for winter vs. the NH snow cover for spring
 While I'm not a fan of straight line trends through such data, let's accept them as is for the sake of discussion.
The winter snow extent is thus virtually constant; the spring decreases significantly. Hence for any given melt season, the difference (spring min areal extent - previous year's winter max areal extent) is increasingly negative from year to year. Similarly, for any given snow season, the corresponding difference (winter max areal extent - same year spring min areal extent) is increasingly positive.
We have just described an oscillating system (winter max to spring min to winter max) with increasing amplitude. In such systems, increasing amplitude requires a gain in system energy.
This begs the question: What supplies the additional energy, especially during a 50 year period of declining solar radiation?
While I'm not a fan of straight line trends through such data, let's accept them as is for the sake of discussion.
The winter snow extent is thus virtually constant; the spring decreases significantly. Hence for any given melt season, the difference (spring min areal extent - previous year's winter max areal extent) is increasingly negative from year to year. Similarly, for any given snow season, the corresponding difference (winter max areal extent - same year spring min areal extent) is increasingly positive.
We have just described an oscillating system (winter max to spring min to winter max) with increasing amplitude. In such systems, increasing amplitude requires a gain in system energy.
This begs the question: What supplies the additional energy, especially during a 50 year period of declining solar radiation?
 This figure was discussed at length here.
Answer: As less energy is available from the sun, an increasing percentage of that energy must be stored in the atmosphere/oceans from year to year and thus they are getting warmer. None of those 'questionable' temperature records needed! Oh but wait a bit, the temperatures say the same thing.
This figure was discussed at length here.
Answer: As less energy is available from the sun, an increasing percentage of that energy must be stored in the atmosphere/oceans from year to year and thus they are getting warmer. None of those 'questionable' temperature records needed! Oh but wait a bit, the temperatures say the same thing.
-
RSVP at 16:28 PM on 31 July 2010Waste heat vs greenhouse warming
In my Universe, there are no "orphan" photons. It is a tidy Universe. If, for instance, stars radiated without a destination for each photon, there would be a photon clouds collecting in the furthest reaches of space. This of course is not the case. So as it turns out, you all live in my Universe, which from the comments is apparently quite tramatic. -
Daniel Bailey at 16:16 PM on 31 July 2010The Past and Future of the Greenland Ice Sheet
Hunt: The latest paleo records indicate that the last time CO2 levels were similar to today's was about 15,000,000 years ago. Ellesmere Island in the Canadian Arctic sported boreal forests and enjoyed winters similar to parts of Southern Canada or Southern Alaska (mild winters, but still some snow). Greenland would have been largely ice-free, resulting in a nearly 6-meter sea level rise. Of course, this much of a rise from Greenland's ice loss would have already triggered a commensurate ice loss from the WAIS in Antarctica (conservatively, a composite 9 meter sea level rise - not that the extra 3 meters would matter). Remember, central Greenland is below sea level, so once the sea makes a meaningful entry through the coastal mountain ranges, it's game over for the ice sheet. With no way to reverse CO2 rises from current levels (we can't even figure out how to slow emissions, let alone how to make CCS work), the Greenland ice sheet is Dead Man Walking. How quickly? (shrugs) No one knows. The rate of mass loss is rising quickly, with no indication that it will stay uniform. Some indication in the paleo record indicates severe losses have occurred in less than a century's time (multiple-meter rises in sea level). Again, once the sea gains access through the coastal ranges, it's done. As the sheet offloads the ice, isostatic rebound of the basement rock increases (it is already doing so). Ice quakes on the sheet are recorded routinely (none significant). Possible tectonic activity could occur at some point in response to the offloading. As the Guardian link mentions, as far as sea level rise is concerned, the 1st meter of rise is the most important. If it happens too quickly, every sea level city in the world is done. Mark Lynas' 6 Degrees is a must-read (link to review provided). We are basically at 1 degree now, locked in for 2 more; the remaining debate is if it's possible to avoid the Full Monty discussed in the link. Alley's Biggest Control Knob lecture a must-see (link also provided) for an internalizing of the effects of CO2. Check out these references (not a comprehensive listing, of course, but representative of 15-minutes searching can provide): Why Greenland's ice loss matters Greenland ice sheet won't collapse Is Greenland gaining or losing ice? Greenland used to be green What links the retreat of Jakobshavn Isbrae, Wilkins Ice Shelf and the Petermann Glacier? Glaciers melting so fast, a generation will be too late Six steps to hell CO2 biggest control knob The Sermilik fjord in Greenland: a chilling view of a warming world Ice Sheets Can Retreat 'In A Geologic Instant,' Study Of Prehistoric Glacier Shows Greenland - No Ice Greenland - IPCC - Ice Melt I remember bookmarking a rotatable 3D animation someone had created of Greenland with no ice, but no luck on finding it with this tired brain tonight. Dig through this stuff for a start. Digest what you don't already know. Anything I can help you with, let me know. The Yooper -
huntjanin at 15:10 PM on 31 July 2010The Past and Future of the Greenland Ice Sheet
If you can handle a question from a real beginner, what, if anything, is the relationship between the Greenland ice sheet, carbon dioxide, plate tectonics, and sea level rise? -
jyyh at 13:33 PM on 31 July 2010The Past and Future of the Greenland Ice Sheet
Is there anyway of knowing how much this stuff is in the Greenland? http://www.reuters.com/article/idUSTRE66S57H20100729 I would believe part of the meltpools drain in this kind of reservoirs, once filled, they'll burst like some subglacial volcano lake.
Prev 2269 2270 2271 2272 2273 2274 2275 2276 2277 2278 2279 2280 2281 2282 2283 2284 Next


