


 Arguments


Recent Comments
Prev 35 36 37 38 39 40 41 42 43 44 45 46 47 48 49 50 Next
Comments 2101 to 2150:
-
MA Rodger at 21:42 PM on 18 March 2023The Big Picture
Bart Vreeken @80,
That is a curious quote about the Greenland contribution to Netherland SLR given the KNMI Report also says on P22:-
The mass loss of the ice sheets of Antarctica and Greenland and glaciers continues unabated. Since 1993, this component has been the largest contributor to sea level rise.
The idea that the melt water from Greenland, part of the largest contribution to SLR, should somehow choose to avoid the seas off the Netherlands is somewhat silly. I think the idea being expressed is that (as explained within the KNMI Report) SLR is not appearing so much off Netherlands due to altered weather in the North Sea and so the 'Greenland melt' is being used in your quote synonymously for SLR.
-
Bart Vreeken at 20:35 PM on 18 March 2023The Big Picture
Bob Loblow @75 you said:
"Another clue for you: losing ice at lower altitudes around the perimeter of the ice sheet, and gaining ice at the higher altitude is Business As Usual for continental ice sheets. There is this thing called "glacial flow" that moves ice from the accumulation zone to the ablation zone"
Well, that's great. Do you really think I would write about Greenland when I didn't know how it works?
My turn then. The mass change of Greenland by year. Cherry-picking? Maybe, but I use all the available data of GRACE. Over a longer period (altimetry data) there is an increase of mass loss. Don't pay too much attention to the trendline, for the data have a lot of noice. But there is a similarity with Antarctica: more snowfall in the last years, caused by less sea ice.

-
Bart Vreeken at 19:48 PM on 18 March 2023The Big Picture
Thank you michael sweet @72 for the map of Greenland, based on altimetry. I didn't know this one, it's different from what I expected. I was too quick with my map of the SMB anomaly of only this year, it turns out to be untypical. Never the less we don't expect so much contribution from Greenland here. From the KNMI-report we discussed before:
"Many factors have been taken into account in the calculation of sea level rise on the Dutch coast, including the expansion of the oceans due to warming, self-gravitation, the changes in salinity, and the mass loss of glaciers and ice sheets in Greenland and Antarctica. Because the melting of the Greenland Ice Sheet hardly contributes to the sea level rise off the Dutch coast, we expect that the increase here will lag slightly behind the world average."
-
Bart Vreeken at 19:30 PM on 18 March 2023The Big Picture
michael sweet @78
Good summary of the gravity point. I hope that it's clear for everyone now.
About the KNMI-report: the 2 meter sea level rise is not in the summary on page 2. Mayby you were confused by the european notation of the number? "de zeespiegel kan tot 1,2 meter stijgen" means: "the sea level can rise up to one point two meter.
An other thing is that the report has changed from the original version. We don't know what was in the original version now.

-
michael sweet at 12:36 PM on 18 March 2023The Big Picture
It is a real phenomenom that when the great ice sheets in Greenland and Antarctia melt that means there is less gravity there and the sea flows away. I remember that around Greenland itself that could be tens of meters less water and more around Antarctia. There are papers describing where in the globe there will be less water and where there will be more water (ths article describes the affect). By looking at the pattern of sea level rise (upthread I posted a map of sea level rise) and seeiing where it is higher and where it is lower scientists can get an idea of where the water is coming from.
Bart Vreeken posted a map upthread, it is probably accurate. They suggested that melting in the Antarctic will result in higher sea level rise than the global average but melting in Greenland will result in less sea level rise than the global average in Holland. Different parts of Greenland affect Holland differently.
There are other effects on sea level rise that are not intuative. The Gulf Stream carries water from North America to Europe. Sea level in Europe is about 1 meter (!!!) hgher than off North America. If the Gulf Stream stopped, sea level in Europe would decrease substantially while the East coast of the USA would flood. Who wudda thunk.
-
One Planet Only Forever at 11:54 AM on 18 March 2023The Big Picture
peppers @69,
I will offer the following response to your departure.
Claiming that a person who is twice as harmful as all other individuals is acceptable because thetotal imp[act of 3 of those others would be more harmful is ... so many applicable terms, none of them compliments.
I will add that the 'more harmful' are not discovered by evaluating the total impacts of a group. Identifying the most harmfully impacting people within any group is the proper action. The problem for any group is when its leadership is taken over by the most harmful and misleading members of the group. And that is more likely to happen in a group with a higher per capita level of harmfulness.
-
Bob Loblaw at 11:34 AM on 18 March 2023The Big Picture
Rob @ 74:
Yes the horizontal gravitational pull is indeed a factor that will affect regional sea level around Greenland.
Less mass in Greenland should mean less gravitational pull towards Greenland, so more sea water to spread elsewhere. I'll leave it to Bart to try to explain why less water around Greenland would lead to less sea water in The Netherlands. (I don't expect it to be a logical or rational explanation.)
-
Bob Loblaw at 11:28 AM on 18 March 2023The Big Picture
Bart @ 62:
In addition to pointing out what Rob said to you at comment 64 about the error in using Surface Mass Balance, I note that you have also given a map of SMB for a single winter season. Do you not bother looking at the ful captions of the figures you pick up? This one does not need translation from Dutch - it is dated March 16, 2023, and states "Accumulated anomaly since Sep 1, 2022".
You're back to the same basic error that you made in your very first post here at SkS on March 9, regarding Antarctic ice. Treating a single year of data as if it represents a long term trend.
At least you honestly say "...how the Greenland Icesheet reshapes at the moment..." Now all you need to figure out is that "the moment" is not enough to make predictions about the future.
Another clue for you: losing ice at lower altitudes around the perimeter of the ice sheet, and gaining ice at the higher altitude is Business As Usual for continental ice sheets. There is this thing called "glacial flow" that moves ice from the accumulation zone to the ablation zone. You should read about it some time.
-
Rob Honeycutt at 11:20 AM on 18 March 2023The Big Picture
Hang on. Am I missing something or is Bart actually thinking that the gravitational mass of Greenland is going to pull sea level away from The Netherlands, when it's 3000km away, making their impacts of SLR nominal?
Surely not.
-
michael sweet at 10:44 AM on 18 March 2023The Big Picture
Bart Vreeken,
I am sorry, the summary page showing 1.2-2.0 meters of sea level rise is page 2 of the document I linked. This was widely reported in newspapers like here, here and here. When a number is in the summary page at the start of a report many people do not read the rest of the report. I have difficulty reading the report, my computer does not translate PDF's.
-
michael sweet at 10:24 AM on 18 March 2023The Big Picture
Here is a map of surface height change in Greenland. That includes snowfall, melt runoff, ocean melting and iceberg calving.

The caption reads:
Maps of elevation change from satellite altimetry reveal where the Greenland Ice Sheet is changing mass. Map created using data acquired by the CryoSat-2 satellite radar altimeter. Credit: CPOM
I note that the major areas of ice loss are on the west and northwest side of the island, the opposite of Holland.
-
Rob Honeycutt at 10:10 AM on 18 March 2023The Big Picture
Peppers, I will also note that you never responded to my corrections to your C-P extinction statement that "Everything died, except the microorganizms around the rim of the oceans, around the world."
-
Rob Honeycutt at 10:06 AM on 18 March 2023The Big Picture
Peppers @69... "No one could forsee a rise in Co2 being a side effect to solving almost ever ailment of mankind..."
Give it a rest (rolls eyes). You're presenting fossil fuels as if they were the messiah.
Fossil fuels have merely been one form of energy in a long line of sources of energy through human history. They are not the "reason" for humanity solving problems nor have we solved "almost ever[y] ailment of mankind."
As pointed out before, without acknowledgement, we now have access to cheaper, more abundant forms of energy than fossil fuels and those sources are cleaner, safer, and do not emit CO2. And eventually even those forms of renewable energy will be replaced with fusion energy.
-
peppers at 09:17 AM on 18 March 2023The Big Picture
Hi One Planet,
We are not so far apart, as a growing human presence is bringing more co2 to the surface.
I depart with the vilification of part of the population as being most harmful-per person. Every segment has grown, and the greatest contributors are not the highest per person emitters. China is 4 times the population of the USA, and they are at 7.5 per capita to the USA's15.5pc, and therefore emits twice as much as the USA. If the USA were to halve thier emissions to match China's pc the USA would be at 7% of the worlds emisions. Its just not going to do anything against the new emitters being born and growing.
Great interactive chart: https://www.worldometers.info/co2-emissions/co2-emissions-by-country/
There are 15 nations as higher emitters pc than USA, including Canada and Australia. They are 1/3 in population total (of the USA) yet emit 1/2 that again of the USA. Blaming nieghbors so can scold them is what needs to be lost, when you realize it was population that has caused more co2 to be emitted.
I would be in a camp for any and all aid in helping people adapt to the forseable new environment. No one could forsee a rise in Co2 being a side effect to solving almost ever ailment of mankind, except cancer pretty much. More live to adulthood, and they live much longer too. Conquering infant mortality and pennicillin has take us from 1 to 8B and rising. There are no villians is my point. We need to be of help, not blaming. Co2 is going to continue to rise for a while.
Thanks, tons, David
-
One Planet Only Forever at 08:58 AM on 18 March 2023The Big Picture
The comments have improved my understanding of sea level rise.
Thank you Rob, Bob and Michael.
Though I lack detailed background knowledge regarding sea level rise I feel confident about pointing out that the 'peak sea level rise', not 'sea level rise by 2100', is what the future of humanity will have to deal with.
From an ethical and moral perspective, the people who benefit(ed) most from causing the harmful result should be responsible for paying for the required mitigation and adaptation. The more that they suffer because of the 'mitigation actions to rapidly end the harmful impact' the less they will have to pay in advance for the required adaptations. This avoids the problem of 'benefiting from harm done while evading the consequences of the harm done'.
What is happening today is serious unethical and immoral attempts to make the future impacts worse and avoid paying for the required repairs and adaptations. The 'highest harming' portion of the global population is not building CO2 removal devices now required to bring harmful impacts back down to 1.5 C levels of warming. And that group is also not planning to pay for the required adaptation in places like Bangladesh (or the island nations being submerged).
I will go one step further on the point of the real problem being the peak impact that has to be adapted to. There is uncertainty regarding how much adaptation is 'enough'. As a structural engineer I am very familiar with the requirements for all load resisting aspects of a structure to have a very low probability (less than 2%) that very severe potential future impacts would exceed the performance capability of the aspects of the structure. And aspects of the structure that are Primary, where their failure would cause significant overall structure failures, would have redundant mechanisms that would keep the structure system from collapsing due to the failure of a Primary element.
Sea level rise impacts would be equivalent to impacts on Primary Structure elements. So the sea level rise that the biggest beneficiaries of fossil fuel use in the current generation are ethically obligated to build globally, for all of the inhabited areas affected by the future sea level rise that they benefited from causing, would be the 'peak sea level increase' that has far less than 2% chance of being exceeded.
The big question is not the different evaluations (uncertainty) regarding the ways that Greenland and Antarctica will respond to human caused global warming. The big question is: What level of warming is almost certain to be the maximum level of the harmful human impacts.
-
Rob Honeycutt at 08:48 AM on 18 March 2023The Big Picture
Yes, Bart, they are different for important reasons. Once again, you're trying to cherry pick information to support your position without fully (or even partially) understanding what you're talking about.
Once again, your own citations are saying The Netherlands are at greater risk of sea level rise, not less.
-
Bart Vreeken at 08:39 AM on 18 March 2023The Big Picture
Michael sweet, are you playing games? In your link at 39 I see the town of Hindeloopen on the cover, behind a dike. The figure I posted comes from this report, it's on page 30. Please have a look. No 1-2 m sea level rise there.
Rob Honeycutt, offcourse SMB is different from the total mass balance. But not very different. The negative anomaly along the coast comes from high temperatures, not from shortage of precipitation. So the discharge will also have a negative anomaly there.
-
nigelj at 08:33 AM on 18 March 2023The Big Picture
Peppers @36
"I disagree, but if population is the cause (of global warming) we may be better oriented to aid in adaptation to the changes.
'Population' is not the cause of global warming. The cause is largely the fossil fuel energy we elect to use because it causes a warming effect. If 8 billion people had been using carbon neutral fuel source we would not have global warming to anything like the extent we have, all other things being equal. So population is not a primary cause of warming.
That fossil fuel energy choice has at most lead to a particularly large population, in a positive feedback loop - but it is still not the cause in any fundamental sense. And your comments are wrong for another reason. We have alternative sources of energy that would eliminate the problem, if we can find a will to develop them more quickly. How can you say population is the cause when we can fix the problem with alternative energy sources? It doesnt make sense logically.
You can behave like a stubborn, over confident egotistical crank if you want - or you can accept sensible explanations.
-
Rob Honeycutt at 08:14 AM on 18 March 2023The Big Picture
Bart... (sigh) That is surface mass balance. Not total mass balance. The two are very different. Surface mass balance is a subset of total mass balance.
-
michael sweet at 08:13 AM on 18 March 2023The Big Picture
Bart Vreeken,
My link at 39 appears to be the KNMI climate change report published at the end of 2021. It contains the new sea level rise projections. On the cover it gives 1.2-2.0 meters as projected sea level rise. It was widely reported in the newspapers at the time. My link at 38 was to a newspaper summary of the KNMI report.
-
Bart Vreeken at 08:07 AM on 18 March 2023The Big Picture
@60
"You have no justification for saying that the mass loss will come from the southern part of Greenland."
When we look at the anomaly of the Surface Mass Balance of Greenland of this moment then I think that it gives a good idea of how the Greenland Icesheet reshapes at the moment. The lower parts and the southern parts are losing ice, and the higher part can gain ice due to more precipitation.

-
Bart Vreeken at 07:42 AM on 18 March 2023The Big Picture
@ Michael sweet,
Unfortunately you didn't give a link to the KNMI site, but to some Turkish site. Here's a proper link (please use Google translate):
www.knmi.nl/over-het-knmi/nieuws/nu-ook-zeespiegelstijging-te-zien-in-het-klimaatdashboard
-
Bob Loblaw at 07:33 AM on 18 March 2023The Big Picture
Bart @ 57:
Yes, I could use Google Translate, but why should I? You are the one trying to make a case here, and if you can't be bothered to provide proper references, proper indications of what you expect people to see in those references or diagrams, then why should we make the effort to guess at what you are trying to show us?
Now that you have provided a translation of the caption and some of the text for the figure that shows "the magical 12.5% figure", I see that the main text says "the rise in the Netherlands could amount to 60% of the global average sea level rise". No 12.5% there, and a direct refutation of your 12.5% claim.
What about the caption? It says that the map is showing "the consequences on the Dutch coast of the disappearance of ice in different parts of the Greenland ice sheet".
The values on that map range from maybe -30% to over +45%. You stated "The mean value of the southern half of Greenland is someting like 12,5%. My assumption is that the mass loss in this century will come from the southern part."
So, that diagram does not demonstrate that sea level rise in The Netherlands from Greenland ice melt will be 12.5% of the global average. The 12.5% value is a value you picked out of the figure purely on the basis of that's what you want to believe. You have assumed your conclusion.
Once again, you have no scientific basis for your claim. You have no justification for saying that the mass loss will come from the southern part of Greenland.
It is obvious that you are just making stuff up, with a smattering of out-of-context quotes or diagrams, with no real understanding of any of the processes.
-
Rob Honeycutt at 07:01 AM on 18 March 2023The Big Picture
Bart... Do you understand the meaning of "disproportionately affected"?
-
michael sweet at 07:01 AM on 18 March 2023The Big Picture
Bart:
I do not see the graph you posted at 35 in your paper. You have a graph at 52 that shows considerably more sea level rise than your graph at 35, but still much less than the KNMI report.
The KNMI report that I linked was put out after the IPCC updated their sea level rise projections in 2021. Apparently the paper you link was written before the IPCC updated their projections.
The Netherlands National Weather Institute's (KNMI) most recent projections, made after the publication of the paper you linked, are 1.2 - 2.0 meters of sea level rise in Holland by 2100. If you prefer to look at outdated projections by lesser authorities that is your business. Every time sea level projections are updated they are increased. I suggest you try to keep more up to date.
At 35 you said " I don't see many projections between 1-2 meters here." That is incorrect, the Dutch National Weather service best estimate is 1.2-2.0 meters.
Rob at 42: The link to Tamino (copy of link) that I posted at 30 shows the sea level data and explains why you cannot use the average of 1900-2020 to project to the future with a straight line. He used the data from 1970-2020 and a quadratic fit for the most accurate projection.
Peppers: Tamino explains how to project future sea level rise. He only projects to 2050 because the uncertainty bars become too big after that.
-
Bart Vreeken at 06:59 AM on 18 March 2023The Big Picture
Hi Bob, with Google Translate you can read the text in English. Here's a screenshot of the translation:

-
Bob Loblaw at 06:46 AM on 18 March 2023The Big Picture
Well that source is in Dutch (I presume).
Please prove a translation of the caption in figure 2.
-
Bart Vreeken at 06:41 AM on 18 March 2023The Big Picture
Bob Loblaw, the magical 12,5% figure comes from this message:
www.knmi.nl/over-het-knmi/nieuws/de-groenlandse-ijskap-smelt-steeds-sneller
In Figuur 2 we see the influence of the melting of different parts of Greenland to the sea level rise in the Netherlands. As we see, melting at the east coast of Greenland gives a sea level decline in the Netherlands becourse it's at a short distance. The mean value of the southern half of Greenland is someting like 12,5%. My assumption is that the mass loss in this century will come from the southern part.
-
Bob Loblaw at 06:08 AM on 18 March 2023The Big Picture
Actually, I see that Bart's 13cm is the proportion of the overall total of sea level rise that is due to Greenland. That's not in the figure he refers to. He must be getting that from a different source - one he has not provided a reference to.
On top of that, he's said "12.5% of this comes to the Netherlands, that's 1,6 cm." That is a claim that appears to be a figment of his imagination.
Where does this magical 12.5% figure come from, Bart?
-
Bob Loblaw at 06:00 AM on 18 March 2023The Big Picture
Bart @ 52:
Really? I don't see anything in your figure in #35 that indicates 13cm in 2100. In the diagram you provided, in 2100, the lowest coloured zone is closer to 25cm, and the red ones (SSP5-8.5) range from 55cm to 120cm. The last time anything in that diagram was below 13cm was before 2050.
You can't even read your own graphs properly.
Of course, maybe you're still using 13cm from some bogus extrapolation of historical data.
-
Bart Vreeken at 05:48 AM on 18 March 2023The Big Picture
Bob Loblaw @50
"let's start with you explaining what you think makes The Netherlands any different from any other part of the globe that is a long way away from Greenland?"
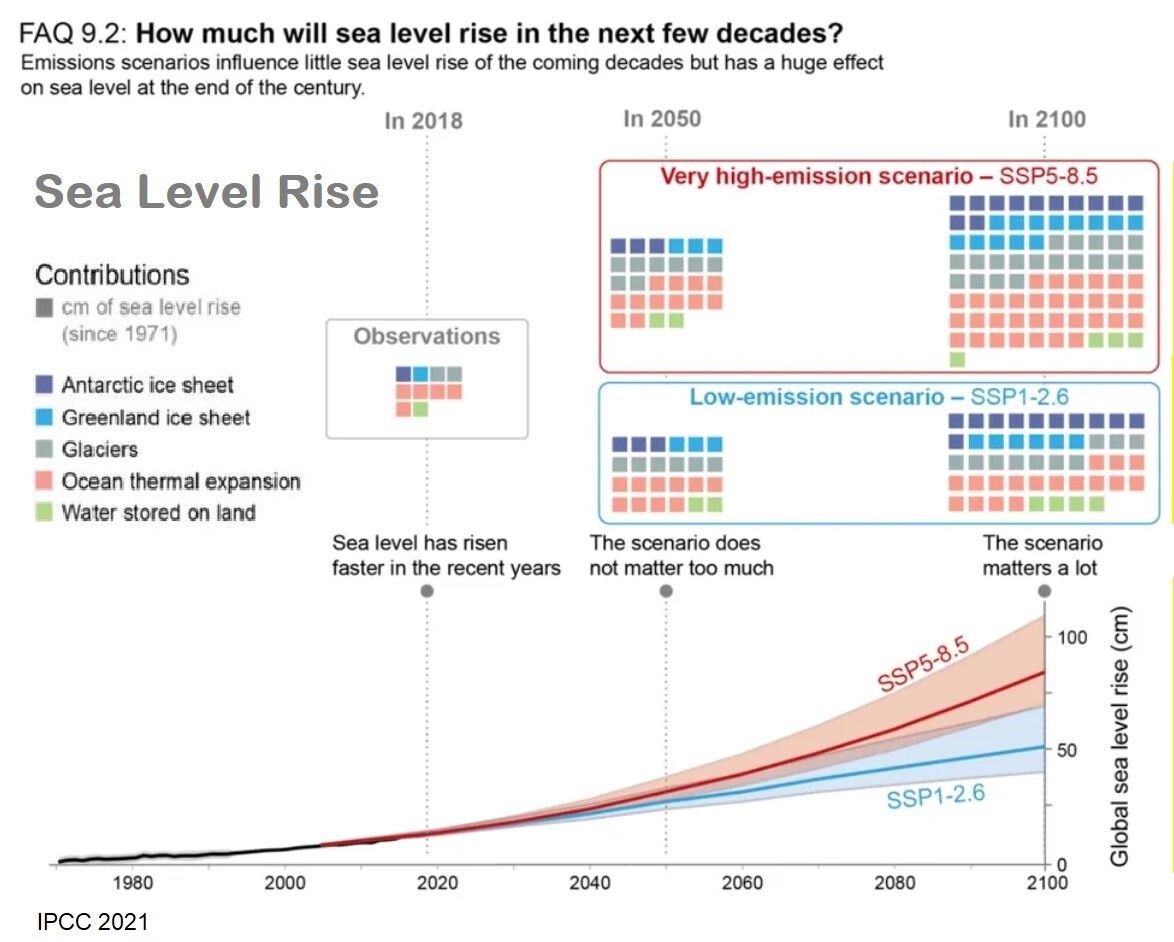
Why should I explain it when you know allready know the answer? Back to @35. There we see the projection of the sea level rise for the Netherlands, according to IPCC.
Also according to IPCC the addition to the global sealevel rise by Greenland in the SSP5-8.5 scenario in 2100 is 13cm. 12,5% of this comes to the Netherlands, that's 1,6 cm. Not very much to be worried about.
-
Bob Loblaw at 05:24 AM on 18 March 2023The Big Picture
Rob @ 49: [questioning Bart]:
Did you read the paper, or are you just looking at charts without understanding the full context of their meaning?
That's not an either-or question, Rob. It's quite possible that Bart read the paper and still doesn't understand the full context of the meaning of the charts.
-
Bob Loblaw at 05:21 AM on 18 March 2023The Big Picture
Bart @ 44:
do I have to explain basic geophysics here? When the ice in Greenland melts then only 10 - 15% of it will make the sealevel rise in The Netherlands. That's due to the self gravitation of the ice sheet.
You have yet to say anything in any of your comments here that represents anything that you can teach me, but let's start with you explaining what you think makes The Netherlands any different from any other part of the globe that is a long way away from Greenland?
Do you actually think that the people that do sea level rise for a living are missing some aspect of geophysics that only you understand? Do you actually think that they do not know about the factors affecting regional patterns of sea level rise? That's the way you are coming across.
-
Rob Honeycutt at 04:35 AM on 18 March 2023The Big Picture
Bart, you didn't answer my question. Did you read the paper, or are you just looking at charts without understanding the full context of their meaning?
-
Bart Vreeken at 04:19 AM on 18 March 2023The Big Picture
Rob @47 The answer is in Figure 2 and Figure 3. You are right, some of the projections (or the upper end of the uncertainty range) are between 1-2m by 2100. However, the average of all the projections for the RCP8.5 scenario is ca 0.9 meter.
-
Rob Honeycutt at 03:49 AM on 18 March 2023The Big Picture
Bart @45... Have you read this entire paper? I ask because just reading the abstract it looks to me it supports projections of 1-2m by 2100.
-
One Planet Only Forever at 03:17 AM on 18 March 2023The Big Picture
Peppers @36,
In spite of all that you have claimed the evidence-based understanding continues to be:
1. The climate impact problem of developed human activity is real.
2. The climate impact to date has already seriously compromised the future of humanity, especially due to the locking in of significant sea level rise). And because of the inertia of harmful developed over-consumption by the most harmful portion of the population things will be worse before humans stop making it worse. The continued harmful activity requires more repair (adaptation). And ‘adaptation effort’ delays human development of sustainable improvements. And the required adaptations will not be done for every body (I see not plans for the current portion of the population responsible for the rising sea levels to build flood mitigation systems that will be required for Bangladesh). And in some cases the harm is not repairable (The rising sea level impacts on Bangladesh may not be possible to adaptively mitigate).
3. The problem is the portion of the total population that is most harmful per-person. The total population increasing is a concern. But the problem of the total harm done is the real concern. And that can be understood to be due to the portion of the population that has developed a liking for over-consumption, not just unnecessary energy over-consumption. And the problem within that problematic ‘highest harm’ portion of the population is the portion that has less interest in learning about the harm caused (or the risk of harm) by their pursuits of ‘more personal enjoyment or benefit’
4. The problem can be solved. It just requires all people, even with an increasing population, to understand and accept the need to limit how harmful they are and to want to be more helpful to Others. There is a planetary limit on how many humans can live sustainably, concurrently live basic decent lives into the distant future. Many studies have established a consensus understanding that the maximum sustainable global population is a function of how much harmful over-consumption develops within the population. The planet can sustainably support more than 10 billion humans living basic decent lives (doing what is needed to live a decent basic live, and limiting the harm done by that essential activity). The planet cannot sustainably support the current 8 billion (or the most harmful 800 million) because of the developed harmful over-consumption within the population (and not just the harmful climate change impacts). Also, the developed systems fail to ensure that every body has the necessities of a basic decent life, including failing to provide basic minimum energy needs to every body and failing to have the ‘needed energy’ be as harmless as possible.
What is tragically missing from most discussion of the climate change problem, and other human harmful impact problems, is that the solutions require everybody to be governed by the desire to learn to be less harmful and more helpful to others. Some people 'doing their best to be less harmful and more helpful, and trying to help others be less harmful and more helpful' face the uphill challenge of overcoming the harm done by 'people who have developed other interests and related harmful misunderstandings'.
-
Bart Vreeken at 01:48 AM on 18 March 2023The Big Picture
The link above does not work. Next try:
agupubs.onlinelibrary.wiley.com/doi/epdf/10.1029/2021EF002576
A. B. A. Slangen, M. Haasnoot, G. Winter, 2022
Rethinking Sea-Level Projections Using Families and Timing Differences
-
Bart Vreeken at 01:42 AM on 18 March 2023The Big Picture
michael sweet @ 39
I took my figure (@35) from exactly this report. And here you find an overview of all the different kind of sea level projections (april 2022):
https://agupubs.onlinelibrary.wiley.com/doi/epdf/10.1029/2021EF002576
Bob Loblaw @40
do I have to explain basic geophysics here? When the ice in Greenland melts then only 10 - 15% of it will make the sealevel rise in The Netherlands. That's due to the self gravitation of the ice sheet.
-
John Mason at 01:03 AM on 18 March 2023The Big Picture
I was going to point out peppers' fundamental errors but you've beat me to it, Rob!
All I can add is that as long as there has been life, organic carbon has under the right geological circumstances been buried, preserved and in some less common cases accumulated in sufficient quantities to form ecomonic fossil fuel deposits.
-
Rob Honeycutt at 00:54 AM on 18 March 2023The Big Picture
Peppers @36... Do you honestly need me to explain why you can't just take historical sea level rise data, run a straight line through it, and extrapolate sea level in 2100? This is basic enough that it might be a challenge to find citations. How about you make a guess and we'll see if you can work out why and perhaps, from that, we can help you understand why SLR projections show 1-2 meters for 2100.
I'll even get you started: Think about ice.
This is also wrong: "66M years ago we had the meteor strike, and the world went dark under dust for 3-4 years. Everything died, except the microorganizms around the rim of the oceans, around the world."
Though it is off-topic, it's a good demonstration of how you're simply making things up as you go along. In the Cretaceous–Paleogene extinction event about 75% of species went extinct. We are direct decendants of small mammals that survived the event.
Most of the rest of what you state there is also BS (for instance, much of the world's oil actually originates from the Cretaceous and Jurassic periods, not just the Tertiary period following the C-P event) but I'm not going to waste my time.
-
Bob Loblaw at 00:52 AM on 18 March 2023The Big Picture
Peppers @ 36: "Do you have cites for your 'abundantly obvious reasons?", Thx"
Sorry. Rob assumed that he was talking to a reasonably well-informed audience.
Look at some of the links I gave to RealClimate in my previous response to Bart.
-
Bob Loblaw at 00:50 AM on 18 March 2023The Big Picture
Bart @ 38 responds to Rob @ 35 by saying "I don't make a mistake", and then proceeds to explain that he (Bart) has done exactly the mistake that Rob said he was doing: using historical data to extrapolate out SLR over the coming century. Bart even included the quote from Rob saying you can't do that, so Bart has no excuse for not paying attention to what Rob said.
Bart says he included "an extrapolation of the change by year" - but this is still using historical data to extrapolate. Mistake confirmed.
Anyone who is reasonably well-informed about sea level rise projections understands that such projections need to include physics and processes that will cause sea level rise - glacier dynamics and their response to temperature and precipitation changes; climate warming and associated changes in ocean temperatures (including horizontal and vertical distributions of temperature change). Projections require understanding the future path of these factors - and the past sea level is not necessarily an indicator of the future of glaciers and global temperatures.
RealClimate often covers this topic, and covers it well. A few related pages there:
dont-estimate-acceleration-by-fitting-a-quadratic
sea-level-in-the-ipcc-6th-assessment-report-ar6
why-is-future-sea-level-rise-still-so-uncertain
Another mistake made in Bart's short comment: the Netherlands doesn't need to worry about Greenland's contribution to sea level because it is "not very much here". (Granted, the last few sentences of Bart's comment are very poorly worded, so it's hard to understand exactly what point he is trying to make.)
-
michael sweet at 00:40 AM on 18 March 2023The Big Picture
Bart Vreeken:
This link appears to be the KNMI report (in Dutch). The illustration on the front page shows 1.2 - 2 meter sea level rise (I cannot read the report).
-
michael sweet at 00:27 AM on 18 March 2023The Big Picture
Bart Vreeken:
According to the Dutch Weather Institute (KNMI),
"sea levels will rise 1.2 to 2 meters (3.3 feet-4 feet) over the next 79 years if greenhouse gas emissions are not reduced immediately and the melting of the Antarctic ice sheet accelerates."
I found a description of the Dutch Weather Institute as the national weather authority in the Netherlands. Certainly there are projections of up to 2 meters of sea level rise in the Netherlands. Can you provide a link to support your claims? I cannot read most of your graph but it appears to be dated 2005. More recent projections have been much higher than older projectins.
-
peppers at 00:20 AM on 18 March 2023The Big Picture
828,000 kilometers per hour
-
peppers at 00:18 AM on 18 March 2023The Big Picture
HI Rob!
Do you have cites for your 'abundantly obvious reasons?", Thx
One Planet, huge effort and thanks for it!
In that rise in population from 1B to 8 B ( Im going to use 1900 to present, although 1B was in the 1800's), the USA rose from 76.3M to the 335M now. China went from 336M to 1.3B, and so on. The world gained porportionally and if a household used blank amount of energy, it increased 5 fold in the US in quantity and so on. The new population was not all in low production regions.
I am minded of the basic business principal of the 3 terms, reduce outgo, increase income (per unit), and doing more of it. The doing more of it is the mark of the run away businesses. I would not dilute the 800% rise in population with trace factors, to not tell yourself the truth that population, the 'more of it' is the core of this issue.
And it is important. Because if one realizes this, you can consider if this is in the solar system's realm of inevitibles rather than in our hands. I mean, the sun is moving 828k/hr around the milky way, we are orbiting 18.5 miles per second around the sun, and all the countless other intricacies of our solar system which would be folly to address. Might be dangerous even...
Its a question, as Rob poses above, of doing the best we can. He says what is being done is at least stemming the flow. I disagree, but if population is the cause we may be better oriented to aid in adaptation to the changes. Nothing really is wrong and there is no reason to fear a runaway cycle as the cause is not mysterious then.
Nasa concludes more warmth likely adds more energy to the environment, but they do not know if, how much or where. I would think it does add. But what of it is my mext question. The problem is addressable in the quality of our shelter.
Hurricane Dorian was the largest in 84 years ( an example on the Nasa Site), so it matched one as large before the industrial revolution was in great effect. Nasa's point it, its still a guess.
But Florida level of sheltering, where 150 died in 200mph Ian last Sept, was better than the 200k who died in crumbling buildings in Syria. Thats what we can put hands on, to aid in this issue.
https://climate.nasa.gov/ask-nasa-climate/2956/how-climate-change-may-be-impacting-storms-over-earths-tropical-oceans/
I would like to add one more mode of thought, which I dont see addressed here much. And it is only remote, so please do not categorize me as conspiracy oriented. My thoughts are how we best use our hands and feet on this. Not whether the problem exists.
But I find this interesting.
66M years ago we had the meteor strike, and the world went dark under dust for 3-4 years. Everything died, except the microorganizms around the rim of the oceans, around the world. The myth is that oil deposits are decomposed dinosaurs, but really it it the rotted countless trillions of these happy cells which had a heyday for a millions years with no other competition for the enriching co2 and oxygen in the environment. These tiny crustaceans died with the oxygen in its calcium and sequestered away ox as well as co2, of which these 2 chemical elements are bossom brothers.
As such, an inordinant amount of oxygen was also captured and the current level of oxygen dimishment has us at about 900 feet altitude now compared to sea level saturation back then. Saturation is going down and the equivolent as altitude is increasing.
Forbes: Air bubbles trapped within ice provides clues to the atmospheric composition at the time of "deposition" and can be analyzed for paleo-oxygen levels. The study finds that over the past 800,000 years the amount of oxygen found in the atmosphere has decreased by 0.7% and continues to decline.
I think it is something like 14M years before oxygen reaches where we would need masks to visit the beach, so this is a mild bit of input on this supercharged forum.
But what is the solution to this? More weather and rain is needed to wash the shells with all this captured oxygen back in to the oceans, to restock the active environment with the element.
Do we know what we are doing to pick any possible cycle of earth or the solar system itself, and interfer with all these conclusions and guesses. Why is it not prudent to ask these questions?
I dont think it is invasive to make umbrellas, levee's, bunkers and warm towels!
Thanks everyone, D
-
Bart Vreeken at 18:07 PM on 17 March 2023The Big Picture
Rob Honeycutt @ 32
"You're making exactly the same mistake as Bart. You can't use historical data and merely extrapolate out SLR over the coming century, again, for abundantly obvious reasons."
I don't make a mistake. First, I don't say that the sea level rise isn't change. I make an extrapolation of the change by year, so the increase is allready included. As we can sea, there's a lot of noise in the data, so the trendline is not very clear. Second, we all know that such a simple trendline does not include everything.
When I look at the latest projections for the Netherlands (I live there) my extrapolation is not too bad. I don't see many projections between 1-2 meters here.
On global scale it's little different, for the part of Greenland is not so very much here.

-
One Planet Only Forever at 13:32 PM on 17 March 2023The Big Picture
I believe that it is important (and may be helpful) to reasonably (rationally) evaluate (question) the following questionable (interesting) claims that have been made:
1. The increase of CO2 has been caused by the growth of global population (from 1 billion to 8 billion).
JasonChen and Peppers have both made versions of this claim in this comment string.
There does appear to be a correlation. But correlation does not mean causation. The details within the full picture of human population impacts are important to understand.
Not every human has caused, or benefited from, an equal amount of harmful impact. And the personal difference of magnitude of impact among the global population is massive. A multitude of evaluations, enough to establish a consensus understanding, conclude that the majority of the ‘CO2/global warming/climate change’ impact is due to the highest impacting portion of the population (and any population sub-group).
Said another way: If the highest impacting 800 million of the global population were the only humans to live, global population peaked at 800 million rather than having the global population grow to 8 billion, the climate change problem today would be almost as serious as it currently is with 8 billion now on the planet. And the solution would still be 'rapidly ending fossil fuel use', especially by the highest impacting portion of the 800 million.
The problem is the highest impacting portion of the population and their bad examples of how to live being perceived as ‘advanced, superior, and desired’.
2. Helpful developments for the benefit of (the future of) humanity require(d) fossil fuel use.
JasonChen and Peppers have both made versions of this claim in this comment string.
Fossil fuel use burns up non-renewable resources. This planet could be habitable for hundreds of millions of years. At current levels of use, fossil fuels will not last 1000 years. Perceptions that helpful development is achieved through fossil fuel use makes no sense. Any benefits ‘relying on continued fossil fuel use’ will end as the resource runs out. And there is the added matter of the many harms caused by fossil fuel use, not just the rapid production of excess CO2 causing rapid global warming/climate changes and changes of ocean chemistry.
3. Perceptions that helpfulness justify harmfulness.
When people focus on claiming perceptions of the positive benefits of fossil fuel use they are essentially claiming that perceptions of benefit justify or excuse harm done. They may also try to deny that harm is being done by what they perceive to be a positive action. Or they may try to argue that more evidence that harm is being done needs to be obtained before action is taken to limit the harm done (Waiting until the actual damage done is undeniable ‘based on their perceptions’: Waiting until the car crashes before trying to reduce the chances of a car crash). Or they may try to argue that the harm done is acceptable or enjoyable (that car race was thrilling ...).
4. Perceptions of potential personal benefit can cause a person to resist learning to be less harmful and be more helpful to Others (and even themselves).
This is the tricky bit. When a person is confronted with evidence that something they have developed a desire and preference for is harmful or risks causing avoidable harm some people will learn to be less harmful and more helpful. But some people will try to argue against the real and potential harm. They will seek out and develop a liking for a misunderstanding that they believe excuses or diminishes the harmfulness of a ‘perceived to be personally beneficial’ activity like fossil fuel use.
-
nigelj at 10:57 AM on 17 March 2023The Big Picture
Peppers @17
"The modeling ( we love modeling here) by the U.N. is this rises until reaching 10.5B about the end of this century, and then begins to decrease. That is when we will see Co2 level and fall. Meanwhile this push to curb Co2 efforts cannot even keep up with the population rise continuance. The US adds the population of California again, about 2055."
The proliferation of solar and wind power and reduced use of coal (its still growing but the rate of growth has slowed down considerably) may have already stopped the business as usual worst case of 5 degrees by end of this century (which is based on certain trajectories of use of fossil fuels, and the available reserves of coal). Some studies on this if you google them . So we don't have to wait until population shrinks, to make a significant difference.


