


 Arguments


Recent Comments
Prev 428 429 430 431 432 433 434 435 436 437 438 439 440 441 442 443 Next
Comments 21751 to 21800:
-
One Planet Only Forever at 08:00 AM on 5 December 2016Justin Trudeau approves two big oil sands pipeline expansions
Andy Skuce, your comment@20 includes the following statement in the quote from Jason MacLean's counterpoint "Models of the social cost of carbon depend on modellers’ assumptions, including how much to discount future damages."
It is very important to make sure that such thinking is limited to setting a price in an attempt to stop something that needs to be stopped (not just slowed). It cannot be allowed to be used to excuse the damage that is being done by the activity. Paying a price does not make such an activity acceptable.
It is unacceptable for anyone to believe it is acceptable to calculate the costs being created that future generations of humanity (or other current day members of humanity) have to deal with and compare that cost to the reduced wealth and opportunity for those people if they had to stop creating trouble others have to deal with. It is even less than unacceptable, bordering on criminally insane, to deliberately "discount" the estimated impact others have to suffer or deal with, especially when those evaluations may miss major impacts.
A business investor who will gain any benefit and suffer any and all impacts and consequences of their investment choice/gamble can use that method to compare 'their options for action that they will solely suffer any consequences of'. However, that type of thinking is irrelevant when humans other than the ones benefiting will be potentially suffering some consequences.
It is simply unacceptable for a portion of any generation of humanity to benefit from an activity that can be understood to be creating costs or challenges or limitations or damages or risk of damage that other humans have to deal with, particularly future humans who have no voice today. That should be repeated at the start of any discussion of how this type of problem will be addressed, openly admitting the unacceptability of perceptions and activities that have developed.
In a nut-shell, it is common sense that it is nonsense to claim that developed economies need to be protected from the changes and undoing that are required by better understanding of the unacceptability of what got away with developing popularity and profitability.
-
john warner at 06:13 AM on 5 December 2016Trump and the GOP may be trying to kneecap climate research
Tom Curtis @ 15 I am working on a response. Here are two things to consider in the mean time. Adding ocean and land absorption of heat diminishes the role of carbon dioxide when your consider air, land and oceah heat versus only air heat. You logically increase the role of natural heating forces. Second, if you misspecify the cause effect relationship between Temperature and CO2 growth you get inexpected public policy implications. As you can see I have already done the calculations and the y axis intercept is crucial for interpreting the results.
Since you did not cite the sources I have to gather my own facts. Paste the IP address for NASA’s 2010 Earth Energy Budget into IP address for your Browser. Paste the IP address for the complete satellite temperature record from 1979 to 2016. Scroll down to the bottom of the page. Under Global and in the Trend row notice 0.12. This is the temperature trend. 0.12 degrees Kelvin per decade This is also 0.012 degrees Kelvin per year. Just a bonus note before we proceed. Multiply 0.012 times 37 years. This informs us that conditional mean temperature around which the earth’s average annual global air temperature varies has increased 0.444 degrees Kelvin between 1979 and 2016. My argument is that the earth’s air temperature is increasing but carbon dioxide in the air is not the cause.
You said the increase in the earth’s air temperature is only 1% of the global temperature effect. 0.012 degrees per year is the only defensible metric of the increase in the earth’s air temperature. Dividing 0.012oK/yr by 0.01 yields 1.2oK/yr. Your statement translated into reality is that for a representative one square meter of air at the elevation of one kilometer the average annual global air temperature increases 0.012oK/yr. The air equivalent increase in kinetic energy in the ocean is 1.128oK/yr. And I assume the other 5% is land, 0.06oK/yr. The earth’s surface air radiates at 358.2 watts per square meter. Google the Stefan-Boltzmann Law calculator and enter 1.0 for A and e. How much does the rate of energy absorption have to increase to maintain the increased land and ocean temperature measured in terms of our representative air. Add 1.188oK/yr to 281.92oK and enter 283.108 for T. Enter x for P and click Calculate x. P =364.24335wpsm Subtract 358.2wpsm. The change in Radiation Power per area absorbed by the surface is 6.04335wpsm.
Now look at the 2010 NASA Earth Energy Budget. Notice net absorbed by surface, 0.6wpwm. And there is more. The Earth Energy Budget does not reconcile. Therefore, change net absorbed to 0.5wpsm, incoming solar radiation to 340.3wpsm and emitted by surface to 398.3wpsm. 6.04335wpsm exceeds 0.5wpsm by more than 12 times. To find the correct values add 0.012oK/yr to 281.92oK, enter 281.932 into the Stefan-Boltzmann Law calculator for T and x for P. Click Calculate x. P equals 358.2288408wpsm. Add 0.5wpsm and enter 358.7288408wpsm for P and x for T. Click calculate x. T equals 282.0303256oK. Subtract 281.92oK. 0.110325609oK/yr is the net absorbed kinetic energy by air, land and ocean. 0.012/0.110325609=0.108768944 The annual air temperature increase is 10.9% of the global temperature effect. 1-0.108768944=0.891231056 The annual air temperature increase equivalent to the kinetic energy absorbed by land and ocean is 89.1% of the global temperature effect. The ocean is 84.6% of the global temperature effect. The land is 4.5% of the global temperature effect.
I calculated that carbon dioxide’s annual contribution to temperature is 0.0029oK/yr. 0.0029oK/yr divided by the current trend 0.012oK/yr is only 24.17%. In terms of the last 4.75 years it is only 2.76%, 0.013775oK/0.5oK=0.02755. How low can you go! Now that you have forced me to calculate the annual temperature effect it is only 2.63%, 0.0029oK/yr divided by/0.110325609oK/yr=0.0263.
I statistically proved that the earth’s air temperature determines the growth rate of carbon dioxide in the air by regressing annual changes in carbon dioxide against channel 5 AMSU annual global air temperature anomalies between 1979 and 2011. The equation is dC=1.70+1.94*T. r=0.76434 r squared = 58.42% This equation estimates that if the temperature anomaly is plus 0.5 degrees Celsius the increase in carbon dioxide for that year will be 2.67 parts per million. Mis-specifying cause and effect is an intellectually dishonest trick to deceive the technically challenged. But if the Global Warming Believers want to insist that the direction of cause and effect is the other way around I can do that also. The equation is T=-0.514+0.302*dC r=0.7643492 r squared = 58.42% Both equations have the same level of attained statistical significance but only the first equation has any correspondence with reality. The mis-specified equation infers that in reality the earth's air temperature anomaly decreases 0.514 degrees per year unless there is a 1.7 part per million increase in carbon dioxide per year. In fact the coefficient overestimates the effect of carbon dioxide on temperature by 37.67 times. The average annual temperature at which the earth’s air radiates to space actually increased 0.4393 degrees Celsius between 1979 and 2011. Since carbon dioxide increased 54.8ppm the temperature anomaly according to the mis-specified equation should have increased 16.5496 degrees Celsius. 0.302*54.8=16.5496 degrees Celsius 16.5496/0.4393=37.67 This is a textbook perfect example that the public policy inference from a mis-specified equation of reality might be different than you expected. For example between 1979 and 2011 the carbon dioxide concentration increased 1.702 parts per million per year. If you plug 1.702ppm of carbon dioxide per year into the mis-specified equation the answer is 0.0 degrees Celsius increase in the earth’s annual air temperature anomaly. The Public Policy Inference is that you can increase carbon dioxide 1.7 ppm per year forever and never increase the earth's average annual global air temperature. The point is that if you try to use phony science to deceive, somebody like me can use your mis-specification of reality to draw a public policy inference that is not what you expected. All you have to know is that since 1979 the earth's average annual global air temperature has increased 0.80 degrees Fahrenheit and this was not caused by carbon dioxide.
Moderator Response:[PS] This is a naive approach considering only one line of evidence. Please see "CO2 lags temperature", "Warming causes CO2 rise" and "CO2 rise is natural". Comments should go there.
-
John Mason at 22:40 PM on 4 December 2016Dear Mr President-elect: a message from across the Pond
Just a second point in response to feedback regarding ice ages. Yes they would present problems due to ice sheets gradually spreading over northern continents over many tens of thousands of years (although many areas that would be affected are at present sparsely populated). However, there's something else to think about. Sea level fall. During the last glaciation, sea-levels fell by approximately 125 metres and remained around that lowstand for many thousands of years - long enough for the continental shelves of the world to - in part at least - become fertile plains. Look up Doggerland, as but one example - where people lived, hunted and forage and now the sea-bed of the North Sea.
-
curiousd at 19:19 PM on 4 December 2016Climate change could push risk of ‘megadrought’ to 99% in American southwest
Some time ago, I was encouraged by a poster on Skeptical Science to look at a climate modeling program that was simple enough to run on a P.C., and originated at some university in Australia. I pointed out a couple of glitches in the displays but it looked like an interesting and useful project. If you ran it, a predicted climate change consequence that was imminent enough to strike within my lifetime was the desetification of the American Southwest.
But I have now forgotten the University and the name of this program. Can anyone remind me?
Curiousd
-
Eclectic at 13:33 PM on 4 December 2016Trump and the GOP may be trying to kneecap climate research
John warner @13, you give the impression you have misunderstood the importance of climate being assessed over a 30 year period.
You have implied that a 30 year period means that [any] climate change can therefore only be assessed retrospectively 3.33 times per century - and that this somehow "reinforces the point" you were trying to make. (Your point, whatever it was, has become lost in a jungle of words and semantic confusions. Best if you concisely restate the point you wish to make!)
In practice, John warner, it is perfectly acceptable to assess climate changes over rolling 30 year periods (i.e. overlapping periods), if you wish to do so. Which may (or may not?) castrate your unexplained point.
-
gmg at 11:06 AM on 4 December 2016Water vapor is the most powerful greenhouse gas
I have read through most of the SkS posts, but I have seen no mention of the very limited bandwidth of the CO2 absorption spectrum in the region of 250 K radiation. It seems that CO2 will be transparent to most of the outward radiation from water at the top of the troposphere. Comment, please.
-
Tom Curtis at 10:31 AM on 4 December 2016Trump and the GOP may be trying to kneecap climate research
john warner @various:
Using the Law Dome combined CO2 data plus the BEST Land Ocean Temperature Index over the period of their overlap (1850-2013), we find a correlation between CO2 forcing (calculated as 5.35 x ln(CO2current/CO2initial)) of 0.900, an R-squared of 0.811, with a linear regression of 0.58 +/- 0.044 C/(W/m^2). This is the scatter plot of the data:

You may object that because of the infilled values in the Law Dome data set, that artificially inflates the correlation. Using just the raw Law Dome data (with no Cape Grim), however, we achieve a correlation of 0.711, and R-squared of 0.505, and a regression of 0.59 +/- 0.164 C/(W/m^2). Using forcings calculated from the Mauna Loa montly values from March 1958 to July 2016, the correlation is 0.854, the R-squared is 0.729, and the linear regression is 0.62 +/- 0.28 C/(W/m^2).
In short, it is a robust feature of the data that the temperature response to CO2 forcing is approximately 0.6 C/(W/m^2). That translates to a Transient Climate Response of approximately 2.2 C per doubling of CO2.
As the Earth's energy imbalance is currently, approximately 0.7 W/m^2. That means we would currently expect a further increase of Global Mean Surface Temperature of up to 0.4 C based on CO2 emissions to date. Taking the Law Dome data, the increase of 1.7 W/m^2 has left 0.7 W/m^2 that has yet to contribute to the Earth's warming, resulting in a temperature increase of 0.87 C to be explained by the remaining 1 W/m^2. That yields a back of the envelope estimate of the Equilibrium Climate Sensitivity of 0.87 C/(W/m^2) or 3.2 C per doubling of CO2 based on CO2 and temperature data alone.
Against this robust evidence, you can only provide evidence from a truncated data set, with no estimates of the uncertainties, and employing an absurd estimate of future increase in CO2 forcing with Business As Usual which assumes a linear rate of increase from non-linear data.
-
michael sweet at 09:16 AM on 4 December 2016Fires and drought cook Tennessee - a state represented by climate deniers
Nigelj,
Keep in mind that the majority of scientific opinion is towards more damage from AGW than the IPCC reports. The IPCC reports the minimum consensus that scientists agree on. Most scientists think there will be more damage than reported by the IPCC.
For example, this Real Climate post reviews expert opinion on sea level rise and compares it to the IPCC report. The majority of scientists think sea level rise will exceed the IPCC projections. If we are going to consider the "saner" skeptical reports we need to also cover Hansen's projection of 5 meters of sea level rise by 2100. Hansen has more scientific support than the skeptical reports.
I teach High School (and college) in the USA. If you want schools to cover AGW you must accept that probably half of Science teachers do not understand the problem and will think the sketical arguments make sense. We used to have an AP Physics teacher (the highest level of Physics in High School) who taught his students that AGW could not occur because the absorbtion spectrum was saturated. He is no longer at our school but teaches at another school nearby.
-
chriskoz at 08:37 AM on 4 December 2016Trump and the GOP may be trying to kneecap climate research
john warner@13,
Please note that dana1981 is a man. Everyone on this site knows Dana because of his invaluable contributions as science communicator and scientist with growing resume of peer reviewed publications.
If you don't know Dana yet, you can easily get to know him by looking here or his numerous photos. And please avoid the pitfalls of English language & never again refer to him as "she".
-
nigelj at 08:36 AM on 4 December 20162016 SkS Weekly Climate Change & Global Warming News Roundup #49
Trump keeps saying he wants to make America great again. Going back to coal wont make America great again. This is yesterdays technology.
Why doesn't Trump make America a leader in green technology and efforts to combat climate change? That would be making America great again in terms of global perceptions, climate change, and even energy economics. Right now Trump is at risk of being remembered as yesterdays man, who was out of touch with global realities.
You help blue collar workers by really helping them with meaningful assistance, and taking them along with a changing world. You dont help them by going back to dubious policies from the past.
-
nigelj at 08:10 AM on 4 December 2016Fires and drought cook Tennessee - a state represented by climate deniers
Topal @5, you want to know where is the evidence we are changing the climate? Why dont you do a google search or read the IPCC reports or articles on this website. You are presumably familiar with search engines. Its just annoying that you expect people to repeat all this on this comments box and waste their time when the information is already out there and easy to find.
Your post was also pure rhetorical questions. This becomes annoying when there are just purely rhetorical questions. This is not a teacher / student website. This is a discussion, news posting and debate forum like many others, and Im interested in peoples opinions or genuine questions if they dont know something and have already tried google. I ask a few myself.
-
nigelj at 07:59 AM on 4 December 2016Fires and drought cook Tennessee - a state represented by climate deniers
JW Rebel @2. I hear you and you may ultimately be right. However I still think theres a case for examining both the IPCC conclusions and the saner sceptical positions. We are having this educational debate in my country on how to strike the right balance between rote learning, creative thought, and critical analysis. Im convinced it needs a mixture of all three. Its not an "either / or" thing.
This is where I was coming from, and its hard to see why some student critical analysis should not be applied to the big issuess of the day. However it would have to be in the final year of school as younger students can only really absorb basic information. Critical analysis would bamboozle them.
And special emphasis needs to be placed on the evidence based approach of mainstream science as opposed to the less rigorous thinking around something like "creationism" and the sophistry or appeals to emotion you get in some climate denialist positions.
-
chriskoz at 07:56 AM on 4 December 2016Fires and drought cook Tennessee - a state represented by climate deniers
topal@5,
This is just a trivial (or maybe sarcastic on your part?) question on this site. Just look for any argument among 150+ argument in the myth debunking "thermometer" on the top left. Or look at this post for a comprehensive summary of AGW indicators. That's why 97% of people who have the undestanding of these facts (incl. climate scientists) do accepts them.
-
john warner at 07:03 AM on 4 December 2016Trump and the GOP may be trying to kneecap climate research
Ubrew 12 @ 10 Thank you for your response to my comment at 2 which I admit was incomplete.To be ontopic I was responding to the dana 1981 post we were commenting under. In paragraph 8 she [mod. - he] injected that 2014,2015, and 2016 were record breaking temperature years in an attempt to expose Bob Walker as a global warming denier. I was only pointing out that it was natural and not man-made forces that were the scienfific explanation for the 4.75 year increase. I did not have the time to document how I calculated the theoretical scientific effect that increases in carbon dioxide has on the air temperature, (0.0029oK)/yr. I presented the documentation in comment 9 the next day. (4.75yr)*(0.0029oK)/yr = (0.013775oK) (0.05oK/0.013775oK) = (36.3) I subtracted 1 for carbon dioxide and left 35 for nature.
The IPCC had a problem with publishing the TAR Climate Change 2001: The Scientific Basis. The Framework Convention in 1992 defined climate change to include only changes as a result of human activity. [mod. - The roles and purposes of the IPCC and the UNFCCC are different. They're respective definitions have no relevance.] I cited footnote 1 to see if Skeptical Science would verify my explanation of what it meant. The, "This is why" beginning to my statement refers to the discrepency in the magnitudes of the man-made and natural causes that I illlustrating in comment 2.. "This is why the IPCC scientists insisted on this disclaimer that human activity caused climate change and redefined climate change to include natural variability." [mod. - Again, wrong. And note that this is a very serious accusation that we do not take lightly here at SkS.] The moderator did not bother to read footnote 1, crossed out my statememt and gave me a Warning. Then she accused me of fraud and sloganneering. Then a mini-lecture that to prove science wrong I had to cite and quote dana 1981's Post. [moderation complaint snipped.] [...] [Accusations of dishonesty snipped]I wasn't trying to prove science was wrong. I was trying to show that dana 1981 was dishonestly disinforming Skeptical Science viewers that 3 consequtive years of record temperatures was scientific proof that human activity was the cause of climate change.. Then a note that you can't make claims of climate change under IPCC rules before you have the average temperature for a period of 30 years. Which reinforces the point I was trying to make. She [mod. - he] concludes with, that no climate scientist after FAR ever claimed temperatures would keep rising year after year. [mod. - No climate scientists has ever claimed that temperature would be warmer year after year] That is the acceptance that natural forces cause the air temperature to change and that the IPCC had to change the definition of climate change. [mod. - Nope. You're naively trying to attribute internal variation with attribution.] Your graph is a good example of how quickly simple facts reveal the defenders of the indefencible.
john warner @ 7 does not make any sense because the moderator deleted the top half. [mod. - For clear stated reasons.] Enthymeme is a debating trick to get a misinformed person to supply a false first premise for an argument to get him to draw the wrong conclusion. I was commenting on dana 1981's post but the moderator said, offtopic gets deleted. [moderation complaint snipped] I self idenitfied as a, "CAGW critic" and said that unlike other deniers I believe the air temperature is increasing. The whole sentence gets deleted because she did not like acronym CAGW. [mod. - False. That's not what was stated to you.] The last part of my deleted statement was. "...the incorrect unspoken premise is that science has proved man-made carbon dioxide is the cause." Now 7 makes sense. Essentially, I said if you have the proof show it to me now. Nobody at Skeptical Science has put up the proof yet. You can read the rest of the comment. The moderator snips the url address, says were not your advertising firm and calls me bubba. [moderation complaint snipped] My son set up Moraleconomist's in 2011. Nobody ever visited the site. No comments. No recommends. I deleted 5 brief posts and published the list of sources on November 28, 2016 for my argument on Skeptical Science. I did not know that I was allowed to submit it as a comment. Apparently my assumption was not too far off. See last Moderator Response. But I did submit my list as comment 9. Further more the moderator agrees with me that sub decadal (2014-2016) is not long enough period to prove climate change. Then she [mod. - he] says [moderation complaint snipped] as an acceptable comment, I can't formulate my own argument or the already discredited denier skeptical science reports (strawmen), but only global warming consensus science reports as evidence against the global warming concensus science. Talk about defining the bounds of an argument to get the conclusion you are assuming.
I am going to open a new comment to respond to the moderator at 9. I only chose 4.7 years to be on topic for dana 1981's Post. My real intent for the scientific reasoning power contained in 9 is to debunk the claim that real science has been used to prove that man-made carbon dioxide causes the earth's air temperature to increase. The Moderator's comments alone provide more than enough instances to inject real science to debunk the anthropogenic global warming theory. I am a teacher, agreeing with is not enough. You have to know why you are agreeing with me. Even before I make the argument, Ubrew12 already sees enough scientific fire power sitting on the battle field to win and he is scolding me for not using it wisely. Ubrew already knows why he agrees with me and if I make a mistake he wiil be the first to point it out.
[moderation complaints snipped]
Moderator Response:[RH] You're going to have to try a little harder to focus on specific points on specific science and leave out all the rambling rhetoric. If you can manage that I think you'll find SkS to be a good place to have a substantive discussion.
[PS] You also cannot have a reasonable discussion about truth when you constantly misrepresent what the science actually says and make unsubstatiated accusations about people involved. Read the science at source not some misrepresentation constructed by some denier source. Quote the original sources, provide links to your data and above all take the time to understand what the science says instead of what you would imagine it does. You have yet to provide any evidence that any climate scientist ever asserted that that temperature would rise year on year. To me, this implies that you have never bothered to investigate a modern (post 1970) understanding of climate preferring an imaginary construct that you can disagree with instead.
-
topal at 05:47 AM on 4 December 2016Fires and drought cook Tennessee - a state represented by climate deniers
"Was this fire caused by climate change? The answer is yes. "
Simple as that! And then ask: Is this climate change caused by human activity?
Where is the evidence?
-
william5331 at 04:43 AM on 4 December 2016Fires and drought cook Tennessee - a state represented by climate deniers
It is a bit like allowing the teaching of creationism. Yes, let it be taught but in the next or the same lesson, take the kids to a carbon dating laboratory and have the head honcho in the lab explain how it is done and what the results say about a minimal estimate of the age of the earth (50,000 years just from carbon dating). Then let him explain how longer term dating is done with other isotopes and to what extent this provides a much longer minimal estamate of the age of the earth. nothing wrong with letting these alternative world views be taught but then take off the kid gloves and give the kids the true story and the evidence on which the scientists base their world view. A great teaching oportunity.
-
crandles57 at 02:00 AM on 4 December 2016It's not bad
Winter deaths will decline as temperatures warm (HPA 2007)
may need an update partly because the link no longer works. You might want to use refs 4 through 8 from http://www.nature.com/nclimate/journal/v4/n3/full/nclimate2121.html
and you may want to note that the above link disputes this for England and Wales.
-
sciencepolice at 23:50 PM on 3 December 2016Fires and drought cook Tennessee - a state represented by climate deniers
@1 nigelj - I know that myself and other astronomers that teach college general education-level astro courses, when we touch on planetary atmospheres and greenhouse gases we include AGW in our courses. It's nice that the textbook (Bennett et al.) also touches on it explicitly.
A lot of us consider it an obligation! And I do expose as I go through it each time the skeptics use a blatant falsehood.
But having been exposed to that earlier, for e.g. in a high school earth science course, I imagine would be better, and tougher to achieve :(
-
MA Rodger at 23:32 PM on 3 December 2016Climate Change Cluedo: Anthropogenic CO2
jifqam,
I think it might be useful to to emphasis the point made by michael sweet @65 paragraph 2.
The graphic from Gruber et al (2009) 'Oceanic sources, sinks, and transport of atmospheric CO2' presented @64 shows various annual CO2 flux for various ocean regions. These are net fluxes per region. Add them up and they total to about 2.2Pg(C) flux into the ocean and 0.5Pg(C) out of the ocean. The paper tells us global net figure includes " an uptake flux of anthropogenic carbon of 2.2 ± 0.3 Pg C/y(inversion) and 1.9 ± 0.7 Pg C/y(pCO2-climatology)." This represents about a quarter of our anthropogenic CO2 emissions which today total about 10Pg(C)/year and so it is our anthropogenic emissions that are truly "the largest source of CO2 of the planet." Your interpretation of the Gruber et al graphic is based on a flux from the Pacific of just 0.3Pg(C)/year.
Yet the carbon cycle shows the gross fluxes to be far higher than the net fluxes. This is not controversial.
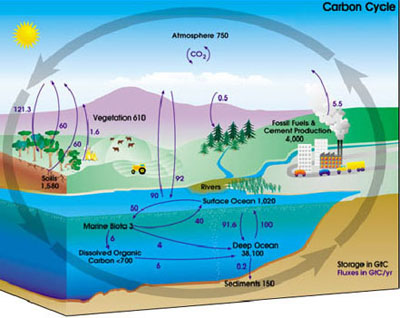
Annually, the gross flux is about 92Pg(C) flux into the ocean and 90Pg(C) out of the ocean. Any discussion of Δ18O must take account of these gross fluxes.
-
John Mason at 13:34 PM on 3 December 2016Dear Mr President-elect: a message from across the Pond
The main point Nigel - that most of us have mentioned - does not involve the next tens of thousands of years. Substantial sea level rise comes a lot quicker. Whatever follows that just rearranges the mess.
-
JWRebel at 13:24 PM on 3 December 2016Fires and drought cook Tennessee - a state represented by climate deniers
Let those kids sweat! In addition to teaching them about various aspects of climate change (physics, geology, carbon cycle, carbon isotopes, weathering chemistry, etc), double burden them with sceptics' points and how these have been debunked.
-
Andy Skuce at 12:44 PM on 3 December 2016Justin Trudeau approves two big oil sands pipeline expansions
Further to Trevor Tombe's article, here is a counterpoint by Jason MacLean
An excerpt:
Tombe’s argument is just the kind of economic thinking best left to classroom chalkboards. As a basis for Canada’s climate policy, it falls short in three ways.
First, Tombe assumes without justification that Alberta oil producers’ implied costs—purely notional costs not actually borne by anyone—are relevant to a public policy whose purpose is to reduce emissions and the very real costs we’ll all actually have to bear if we fail to stabilize our climate.
Second, the government’s estimated social cost of carbon might vastly underestimate the true cost. While most economists agree that pricing carbon is the ideal way to reduce emissions, economists also appear to agree that economic models seriously underestimate the future costs of climate change. Models of the social cost of carbon depend on modellers’ assumptions, including how much to discount future damages. Estimates vary, but many economists think the true cost is closer to $200 than Tombe’s $50.
Think of it this way: if Canada’s proposed price of $50 by 2022 were really high enough to reduce emissions and stimulate “clean growth” by sending a clear signal to the market to shift production from fossil fuels to renewable energy, we wouldn’t even be having this debate! In a world where carbon is properly priced and not substantially subsidized, building new pipelines would be economically unthinkable. Which is kind of the point.
But because $50 is almost assuredly too low, we can’t rely on it alone, no matter how economically ideal it may seem. Instead, we must pursue a mix of policies, including one Tombe agrees will work – blocking pipelines.
The Minister of the Environment and Climate Change gets this—mostly—when she explained that “some people say just have a price on carbon. If you were to do that, the price would be so high it wouldn’t make any sense. So that’s why you have to have a variety of different measures.” Minister McKenna’s absolutely right, of course, if what she means is that a full carbon price wouldn’t make sense politically.
-
One Planet Only Forever at 09:00 AM on 3 December 2016Justin Trudeau approves two big oil sands pipeline expansions
william@17, I hope that true leaders in business and politics will understand that in spite of 'legal approval' these pipelines, and their obvious boost to the success of attempts to expand an activity that needs to be rapidly curtailed, deserve to be losing bets for those who chooose to gamble on benefiting from them.
Sadly, there are many unleaders in business and politics. And those are the type of people who will declare that once something gets started it has to be allowed to be as beneficial as possible for the ones who wanted to benefit from it (the push for new and larger pipelines is because of the unjustified recent expansion of oil sands extraction operations). Those type of unleaders are the reason that future Albertan's owe $1.1 Billion to those who gambled on building new coal burners in Alberta to let Albertans in the past undeservingly get some of the cheapest electricity in North America, attempts to profit that were understood to be unacceptable at the time they were pursued and are now needing to be curtailed by 2030.
The investors in these pipelines and the extraction of tar sands that they support need to be told in no uncertain terms that real leaders will be fighting to make these activities losing propositions, with no public bail-out for the gamblers.
The real problem is the way that these things get justified.
- Some will say building a pipeline won't reduce global burning. However, they have to ignore the fact that reducing the rate of product delivered to the market definitely would help achieve that objective. And less ability to cheaply move the product for profit will knee-cap future interest in expanding these unacceptable pursuits of profit.
- Some will say pipelines are safer than rail. The truth is that the safety of pipepline or rail transport is a function of the effort put into making it safer. There is no default superiority from a safety perspective. Higher safety can be achieved in either system. THe real problem is the way that globalized competition has resulted in 'reduction of standards for safety to be comepetive with the lower standards others can get away with'. That unnecessary reduction of rail safety, allowed for reasons of competitive profitability, was the reason for the Lac Megantic tragedy, a totally avoidable rail disaster that something as simple as full-time responsible observation of the train would have kept from happening.
-
Andy Skuce at 08:29 AM on 3 December 2016Justin Trudeau approves two big oil sands pipeline expansions
Stephen, I don't really have that much argument with Tombe's economic analysis: I accept that stopping infrastructure is a blunt and expensive way of slowing production. As I said in comment#6 earlier, it is all very well to run the numbers that show that a carbon tax is the best policy, but it needs to be set at a level of $200 per tonne to be effective, but that is politically impossible, at least until Canada's trading partners start to price carbon at those levels. So, Tombe is right in theory, but his ideas fail any practical test. Economists are not strangers to failing practicality tests.
I find it frustrating that Tombe rather patronizingly calls for cooler heads on policy, all the while showing graphs that predict eternal growth in oilsands production, as if that were some ineluctible law of nature. Instead, many of us see those trends as Canada digging itself deeper into an emissions hole that we won't easily get out of. I would rather use a policy scalpel than a blunt instrument, but if that's all we have, that's what we'll have to use.
Let me repeat, Alberta is producing more oil than at any time in its history. Production is still growing due to projects under construction. That the province is suffering an economic crisis now is not because of a lack of infrastructure. It is because even projects with sunk costs are barely making money at today's commodity prices and because the provincial economy needs to keep production growing quickly just to maintain employment and balance the books. Emissions aside, this rapid growth is not sustainable. Better to adjust to the consequences of slower or zero production growth now, rather than later, when the problem will be bigger and the fall harder.
Let me say this, if Canada adopts a carbon price above $100, I promise to shut up about banning new pipelines for climate policy reasons.
-
nigelj at 07:54 AM on 3 December 2016Fires and drought cook Tennessee - a state represented by climate deniers
There could be a case for teaching some sceptical climate science ideas in schools, along with the basic consensus, but it depends how its done. School children are not dumb, they know science is very certain about some things, but is a work in progress. They will hear climate sceptic ideas from various people and cant be insulated from this.
Maybe schools should teach the basic IPCC consensus, but also include the more credible sceptical arguments, but also point out the flaws in those arguments. That is the important thing, showing the flaws. If anything it would become a lesson in the poor logic and rhetorical fallacies you get in many denialist positions. It would lead to a better educated generation.
I decided we are warming the climate after a close look at both sides of the debate. I take nothing for granted. Children in the final two years of secondary school are mature enough for this approach.
But of course the problem is getting schools to teach the flaws in sceptical climate opinions, and not promote them as equally valid alternatives. And that would not be easy, judging by the opinions of some of those legislators in the article above.
-
nigelj at 07:15 AM on 3 December 2016Dear Mr President-elect: a message from across the Pond
Chriskoz @20, sorry if I ruffled your feathers. You wont reply so I make this comment for the benefit of others: You, John Mason, Glenn Tamblyn and Michael Sweet have all given different versions of how long elevated temperatures would last, and the implications, and I have read other versions as well myself, so its hard for me to know.
While your version is compelling you yourself acknowledge uncertainties in it.
But if global warming essentially cancels the next 5 ice ages over such an extended period does this not have an upside? Ice ages are killer events. Its a valid question.
Or are uncontrolled experiments with the planet by injecting so much CO2 just uncertain and high risk?
-
william5331 at 07:13 AM on 3 December 2016Justin Trudeau approves two big oil sands pipeline expansions
I don't know what is sadder. A politician we thought would do the right thing or a politician that can't read the tea leaves sufficiently far into the future to know that oil from tar sands will be amongst the first to have to be abandoned as we make the rapid transition away from fossil fuel.
-
nigelj at 06:28 AM on 3 December 2016Trump and the GOP may be trying to kneecap climate research
"This is an invitation to a, Frank Knight type, free discussion of reasonable men to discover whatever truth emerges that we can agree upon."
Reasonable but unqualified men will be of little use. You would need a discussion of reasonable and qualified climate scientists, but haven't we done that already? At least five studies show a consensus that humans are altering the climate.
I also agree with the point that 4 years is too short to determine whats happening with the climate. As Ubrew says la nina and el nino can cause small sudden temperature changes independent of underlying longer term changes. It was a longer term change from the 1970s that got climate scientists seriously concerned that a new factor in the climate had emerged.
I also dont see how John Warner concludes that because solar changes cause a fairly immediate climate response (which is intuitively obvious) that C02 would act at the same rate. An increasing greenhouse effect is like putting on a jumper, you heat up slowly if you can excuse the rough analogy. In fact it has a lot do do with how the ocean responds.
John knows more science than the average person perhaps, but there is an old saying in computing that is relevant called "gigo".
-
Stephen Leahy at 06:07 AM on 3 December 2016Justin Trudeau approves two big oil sands pipeline expansions
Andy, you might want to weigh in on this piece by U of Calgary economist in Macleans today
Policy, not pipelines, will determine if we meet our goals
"...climate concerns around pipeline approvals should be off the table."
-
One Planet Only Forever at 03:48 AM on 3 December 2016Justin Trudeau approves two big oil sands pipeline expansions
It is clear that there is a long history of incorrect business and political decisions being made, if the advancement of humanity to a lasting better future for all is the desired result of human endeavours. These decisions are the result of the development of unjustified perceptions of prosperity and opportunity, “winning any way that can be gotten away with”.
And current leaders in democracies require popular support that is difficult to obtain by justifiably shattering the developed delusions of prosperity and opportunity. Defending unjustifiable perceptions is easier to do. Clearly, it is possible to get support through an unjustifiable excuse like 'the importance of balancing economic interests of a portion of current day humanity with consequences faced by others who will not benefit, particularly future generation'.
It is common sense that it is unacceptable for anyone to benefit in a way that creates potential negative consequences for another person, including future people. The root cause of that lack of common sense in developed and developing societies needs to be addressed. It is almost certain to be an expected consequence of systems that allow a person to get away with actions that are clearly contrary to the advancement of humanity.
And it is clear that an issue like climate change cannot be adequately addressed be 'those who choose to care' while those who deliberately try to get more benefit and any possible competitive advantage by caring less can get away with their deliberately less responsible behaviour.
There is an escalating global war on climate change. It is part of the bigger escalating global war against pursuits that are understandably not going to sustainable advance global humanity to a lasting better future for all. And an aspect of any war is the propaganda war waged by those who actually understand how unacceptable their desires and interests are, but know how to temporarily Trump-up support. And like all activities that have to rely on propaganda (because they actually are understandably unacceptable), they can be tragically disastrously successful for as long as they are able to be gotten away with.
-
Andy Skuce at 03:35 AM on 3 December 2016Justin Trudeau approves two big oil sands pipeline expansions
Economist Jeff Rubin makes arguments, similar to mine, against the economic case for the TMX project in a radio interview this morning on CBC
Part of the transcript:
One of the main selling points of the pipeline has been that it will give Canadian bitumen access to Asian markets. But according to Rubin, the economic advantage of selling oil to Asia has been over-stated.
"The reality is that Asian markets pay less, not more, for the bitumen that Canada wants to sell than U.S. refineries," he told Crowe.
Rubin pointed to Mexican Maya Crude, saying the product, which is similar to oil sands crude, sells for $8 per barrel less in Asian markets than American markets.
At such low prices, the revenue that Canadian oil sands companies would gain from selling their oil to Asia wouldn't be worth the cost of extraction, he said.
Not only is it economically unwise now, he added, but it never will be.
"There's even less of a business case in the future than there is today," he said. "Not if Canada and 170 other countries come even remotely close to living up to their pledge to hold global climate change to one-and-a-half to two degrees."
The notion of building an oil pipeline while trying to reduce greenhouse gas emissions, Rubin said, is "akin to having your foot on the brakes and the accelerator at the same time."
-
Andy Skuce at 03:22 AM on 3 December 2016Justin Trudeau approves two big oil sands pipeline expansions
Nanuk* refers indirectly ("sucking on the prairie teat") to equalisation payments. There is a myth in Alberta that the province props up the rest of Canada by transferring hard-earned cash to undeserving parasite provinces like Quebec. In fact, Albertans pay more federal income tax because they are richer. Wealthy Canadians in other provinces pay federal tax at exactly the same rates. There was a recent CBC radio segment that dealt with this myth.
All resource royalty and leasing payments stay within the province. This is one reason why Alberta has the luxury of being the only province in the nation that does not have a provincial sales tax.
Also, under the Trudeau carbon tax plan, all carbon taxes raised in a province will be retained in that province.
Albertans, it needs to be said, often exhibit an unjustified sense of victimhood, despite being (still) the wealthiest province in Canada. This is not to minimize the real economic suffering being experienced there as a result of the sudden crash in global oil prices.
*Nanuk''s comment was removed by the SkS moderator after I had written this response.
-
JohnSeers at 03:01 AM on 3 December 2016Trump and the GOP may be trying to kneecap climate research
free discussion of reasonable men to discover whatever truth emerges that we can agree upon.
I suggest that a free discussion of reasonable men to discover the truth starts with a presumption that the reasonable men have some respect for each other. Starting with accusations that the other reasonable men are lying will not lead to a free and reasonable discussion.
-
Sub-Boreal at 02:39 AM on 3 December 2016Justin Trudeau approves two big oil sands pipeline expansions
"the boom times have created a hangover, and the remedy for that should be moderation rather than more binge drinking"
Exactly. So the kindest, most responsible thing for a neighbour to do is to take away the keys, lest the serial drunk driver try to get behind the wheel again. Sorry, Alberta!
-
One Planet Only Forever at 02:39 AM on 3 December 2016Justin Trudeau approves two big oil sands pipeline expansions
Here is an interesting article referring to a report that directly addresses what needs to be done "responsibly" with potential wealth from any new or existing fossil fuel exploitation in Canada.
CBC News item "Canada's stagnant, slipping national wealth overly reliant on oil and gas: study"
It also highlights the tragedy of the failure of Canada's previous leaderhip to meanigfully advance Canada to a better future that actually has a future.
-
One Planet Only Forever at 02:34 AM on 3 December 2016Justin Trudeau approves two big oil sands pipeline expansions
nanuk@10,
Wow. I am very familiar with the history of Transfer Payments in Canada. Do some actual research regarding the history of transfer payments. Then come back and apologize for making a totally unsubstantiated claim.
-
Tom Curtis at 01:31 AM on 3 December 2016Climate Change Cluedo: Anthropogenic CO2
jlfqam @64, where you write, "This figure shows the pCO2, that is the pressure of dissolved CO2 in the ocean", you then provide the URL for a series of monthly maps of surface water partial pressure of CO2 such as this one:

I have chosen this example as it shows the highest monthly pCO2 at Mauna Loa's longitude and latitude. Never-the-less, at that longitude and latitude, the colour shown is green, verging on light blue indicating a pCO2 between 350 and 375 ppmv. In 2005, the atmospheric CO2 concentration was 380 ppmv. The lower pCO2 at Mauna Loa therefore implies a net atmosphere to ocean flux at that location, consistent with the map you showed @61 and on which I commented @63.
In your post @61, you introduced the map as indicating the waters around Mauna Loa were particularly CO2 rich. It is possible you consider the maps of pCO2 (which show highest values in the tropics), as substantiating that claim. That would be a mistake. Specifically, pCO2 is a function not only of the total amount of CO2 dissolved, but also of the temperature of the water. In fact, looking at actual dissolved CO2, we find that those regions with the highest pCO2 also have the lowest total CO2 dissolved; while the highest quantities of total CO2 are to be found in the Antarctic Ocean:
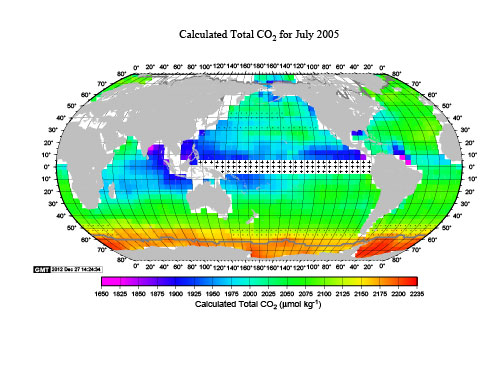
This paradoxical result is a consequence of the large temperature gradient in surface waters from poles to tropics.
In any event, not only are you trying to supplant the theories of climate scientists which they derived to explain the data they collected, and which you peruse; but you have shown a consistent pattern in misdescribing that data. It is hard enough to find a better theory for the data than that held by professional scientists, given their expertise, time, and the many person/years of cooperative research that has gone into any of those theories. Trying to do so without getting the data right is pointless.
Finally, yes there are seasonal variations in pCO2 and ocean/atmosphere CO2 flux at Mauna Loa, just as there is at Cape Grim (Tasmania) and in the waters surrounding the Antarctic (where the seasonal variations are exceptionally large). Yet seasonal variation in CO2 concentration is much reduced in the Southern Hemisphere, and virtually non-existent at the South Pole. If ocean/atmosphere flux was the cause of the measured seasonal variation at Mauna Loa, it would have the same effect at Cape Grim and the South Pole, resulting in an equally large seasonal variation at Cape Grim, and a larger one at the South Pole.
In contrast, the SH has far fewer deciduous plants than the NH, partly due to reduced land mass but also due to a greater preponderance of evergreens. The South Pole lacks deciduous plants entirely. That gives the true, primary cause of the seasonal variation on CO2 concentration - the seasonal cycle of deciduous plants.
-
michael sweet at 21:13 PM on 2 December 2016Climate Change Cluedo: Anthropogenic CO2
jlfqam,
You need to read why Mauna Loa (SkS link)was chosen by experienced scientists to measure CO2. The volcano is so high that it touches the bottom of the upper atmosphere. The CO2 is well mixed from around the world and is only slightly affected by any outgassing of the ocean. Your claim that ocean outgassing affects their measurements is incorrect. Read more, conclude less. You are reviewig very well explored material.
The entire ocean is a CO2 sink. Every year the ocean absorbs more CO2 from the atmosphere than it releases to the atmosphere. Your claim that the ocean is a source of CO2 to the atmosphere is incorrect. Perhaps you mean that the ocean flux affects the isotopic composition of the CO2 in the atmosphere but you need to be more clear what you are claiming. Read your sources more carefully.
You would be much better off if you asked questios about what you do not understand. Instead you make incorrect claims based on your own reasoning. This material has been very closely studied by others with much more experiece. You are more likely to reach an incorrect conclusion (like the two above) because you do not know as much as the experienced scientists than you are to find a mistake that they have made. If you ask questions you will be better received here than if you make incorrect claims based on your own reasoning. People are happy to help you understand the science.
Good luck.
-
ubrew12 at 21:06 PM on 2 December 2016Trump and the GOP may be trying to kneecap climate research
john warner@9 said: "Between July 2011 and April 2016... temperature went up 0.5 degrees" That 0.5 C increase is also indicated by the five surface temperature surveys graphed here:
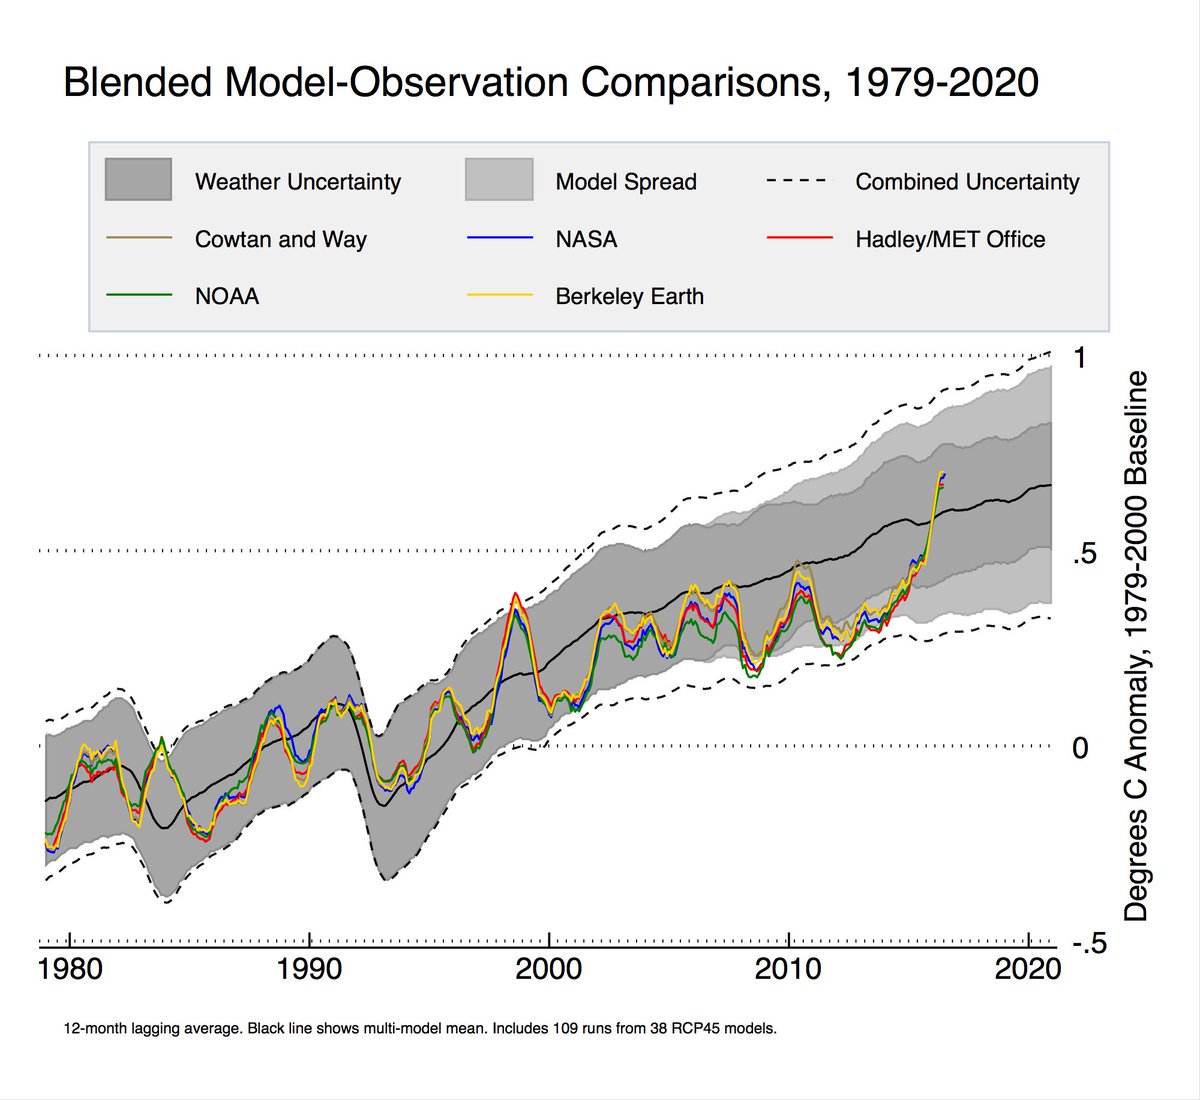
Also shown is the surface temperature from 1979 and the IPCC model predictions as well. The predictions do not match the record for the last 4.75 years, mostly because that's a ridiculously small interval of time upon which to make a climate comparison. But, more fundamentally, its because they can't. They are only models, approximations of nature, not the reality itself. This means we can't expect the models to 'beat' nature. Instead, their task is to beat you, and by 'you' I'm including the wealthiest economic sector in human history, entirely capable of producing its own climate models. But, more personally, you seem to have a well-thought-out analytical structure of how nature works to determine Earth's surface temperature, so why not extend that structure over a longer time period than the trivially inconsequential 4.75 years you've chosen? Work your math to include everything from 1979, and then see if it beats the standard models of climate science. Failing that, just pointing out that the standard models don't match the reality is moot. Those models aren't constructed to beat reality. They are constructed to beat you.
-
jlfqam at 20:31 PM on 2 December 2016Climate Change Cluedo: Anthropogenic CO2
Answer to HK 62
the color scale in the ocean surface CO2 fluxes is related to the flux of CO2 from the ocean to the atmosphere.
This figure shows the pCO2, that is the pressure of dissolved CO2 in the ocean
http://www.ldeo.columbia.edu/res/pi/CO2/carbondioxide/global_ph_maps/pco2_maps.html
This paper shows clearly the pacific ocean being the largest source of CO2 of the planet
Gruber et al
Oceanic sources, sinks, and transport of atmospheric CO2
http://ocean.mit.edu/~stephd/gruber_gbc_09.pdf

Figure 2. Comparison of the ocean inversion estimate of the contemporary sea-to-air CO2 flux with that based on the pCO2 climatology of Takahashi et al. [2008] for each of the 23 regions resolved by the ocean inversion. The zero-line crossing of each flux estimate indicates the region that this flux belongs to. Small gray numbers indicate the region number (see Table S1 for the region name). Positive fluxes indicate outgassing.
Rgarding Tom Curtis 63,
If you take a look at the seasonal variations of pCO2
http://www.ldeo.columbia.edu/res/pi/CO2/carbondioxide/pages/pco2_maps.html
you may see how the Hawaii Islands are bathed by waters with variable CO2 concentrations, which I would say fits the seasonality of the CO2 curve.
Thanks for continuing the discussion, it helps me think about new ways to reinforce the arguments in favour of a natural source for atmospheric CO2.
-
Glenn Tamblyn at 14:51 PM on 2 December 2016Dear Mr President-elect: a message from across the Pond
nijelJ
The key issue wrt the degree of permanancy is ice sheet melt. Greenland and West Antactica seem to have significantly melted and refrozen over the past glacial cycles. If the impact of anthropogenic warming doesn't exceed that magnitude then we would expect that the cycles would re-establish themselves. It may be that we defer or weaken the next expected cycle but that would be about the limit.
However, if we screw up completely and produce enough CO2 to yield sufficient warming to completely thaw all of Antarctica before CO2 levels drop, then it may take much longer for ice sheet nucleation to restart there. We well could flip into a hothouse climate for a time, maybe millions of years, and reverting back to an icehoiuse climate would be slow. Eventually that would probably happen - having a continent sitting over the south pole, isolated from everything else and surrounded by a huge ocean current is a strong driver towards an icehouse climate. -
john warner at 14:31 PM on 2 December 2016Trump and the GOP may be trying to kneecap climate research
The scientific explanation of carbon dioxide radiative forcing is easy to understand. With the analytic application of this understanding I can prove that the exaggerated claims of the global warming advocates fail the scrutiny of reason by the weight of their own silliness. The best way to access the IP addresses I am providing is to copy the address and paste it into the Browser IP address row and press enter. Then print the document for future reference. (snip) To return to the Moraleconomist Web Blog click x on the file folder you are viewing.
This is the IP address for the concentration of carbon dioxide in the atmosphere. [mod. - This is not an IP, it's a url.]
ftp://aftp.cmdl.noaa.gov/products/trends/co2/co2_annmean_mlo.txt
In 1979 NASA began using satellites to measure the earth’s average annual global air temperature. [mod. - Not exactly...] For the purpose of evaluating the validity of the global warming hypothesis [mod. - Needs a citation.] I prefer to use this period of the earth's air temperature record. The growth rate of carbon dioxide from 1979 to 2015 is 1.7892ppm per year. [mod. - Needs citation.]
This is the IP address [mod. - URL] for the Intergovernmental Panel on Climate Change, Third Assessment Report, Climate Change 2001: The Scientific Basis, Table of Contents.
http://www.grida.no/publications/other/ipcc_tar/?src=/climate/ipcc_tar/wg1/
Click on chapter 6 and scroll down to table 6.2. From the first equation C/Co, Co is 400.83 in 2015. Extrapolating the current growth rate [mod. - You can't do a straight linear projection.] to 2115 yields C equal to 579.75, (400.83+178.92= 579.75). (579.75/400.83=1.4463738) The natural log of this growth rate is 0.3690595. Multiplying the natural log times 5.35 yields 1.97wpsm. This is the most likely scientific prediction for a 100 year increase in carbon dioxide radiative forcing [mod. - No it's not. Pleaser refer to the Representative Concentration Pathways data for accurate figures.]. Before you thoughtlessly dismiss this go back to the TAR and go to table 6.1 and notice that between 1750 and 1998, 248 years, radiative forcing by carbon dioxide only increased 1.46wpsm. You can verify this with a scientific calculator by calculating the ratio of 365/278, taking the natural log and multiplying by 5.35. You can also calculate the 265 year increase in carbon dioxide radiative forcing, 1.96wpsm, by evaluating the ratio 400.83/278.
This is the IP address [mod. - URL] for NASA’s 2010 Earth Energy Budget based on the 10 year Climate and Earth Radiation System experiment.
http://science-edu.larc.nasa.gov/energy_budget/pdf/Energy_Budget_Litho_10year.pdf
The first thing to note is that there is no greenhouse gas radiative forcing quantity [mod. - Yes there is. Right there on the first page of your URL link.]. It is 17.9wpsm. This is a 33.4wpsm decrease from NASA’s 1998 Solar Energy Budget estimate of 51.3wpam. [mod. - citation needed.] The water vapor component was reduced 75%. [mod. - citation needed.] The well mixed greenhouse gases component was reduced 25%.[mod. - citation needed.] Therefore the most likely prediction is reduced to 1.48wpsm.
Notice also that the surface air temperature radiates 358.2wpsm. Google the Free Stefan-Boltzmann Law Calculator. Enter 1 for e and A. Enter 358.2 for P and x for T. Click calculate. T equals 281.93 degrees Kelvin. Adding 1.48wpsm to 358.2wpsm equals 359.68wpsm. Now enter 359.68 for P and x for T. T equals 282.22 degrees Kelvin. The difference, (282.22-281.93=0.29), is 0.29 degrees Kelvin per century. That is also 0.0029 degrees Kelvin per year.
This is the IP address [mod. - URL.] for Dr. Roy Spencer's Web Site. Click on Latest Global Temp. Anomalies.
http://www.drroyspencer.com/
This is the gold standard of temperature records [mod. - No, it's not.] for analytically evaluating the validity of the global warming hypothesis [mod. - Go chat with Roy, he'll tell you that you're wrong in your hypothesis here]. Notice the range of variability of the monthly data, 1.35 degrees Kelvin. Even more important for our purpose notice the 13 month running average temperature. Between July 2011 and April 2016 [mod. - why 13 months and not 12?.] this temperature went up 0.5 degrees Kelvin. Multiplying 4.75 years times 0.0029 degrees Kelvin per year yields 0.014 degrees Kelvin. The temperature went up 35 times more than the 4.75 years of carbon dioxide growth can explain [mod. - No one claims that CO2 and temperature are expected to operate in lockstep.]. Also notice every time the temperature goes down none of that variations is explained by carbon dioxide because [mod. - because, because, because....] annual average levels of carbon dioxide never go down [mod. - Technically wrong, but again, no one expects that CO2 and temperature will operate in lockstep.]. To credit carbon dioxide with average annual global air temperature changes is silly on its face compared to the other natural forces controlling earth’s air temperature. [mod. - Please quantify these other radiative forcings in relation to GHG forcing.]
From the IPCC Third Assessment Report [mod. - URL.] on Climate Change 2001 1st footnote from page 5 Summary for Policy Makers 1...
http://www.grida.no/publications/other/ipcc_tar/?src=/climate/ipcc_tar/wg1/fnspm.htm#1
"Climate change in IPCC usage refers to any change in climate over time, whether due to natural variability or as a result of human activity. This usage differs from that in the Framework Convention on Climate Change, where climate change refers to a change of climate that is attributed directly or indirectly to human activity that alters the composition of the global atmosphere and that is in addition to natural climate variability observed over comparable time periods.
The TAR could not prove that human activity [mod. - "proof" is a mathematical term and can't be applied to theories] caused global warming and they could not use the more ambiguous phrase, “climate change,” because of the definition adopted by the Framework Convention in 1992 [mod. - You've profoundly misinterpreted the passage you pasted above.]. In order to be semantically correct they had to redefine their definition of “climate change” to include naturally caused variability. Since the IPCC, the world’s leading scientific global warming authority[mod. - Weird claim.], secretly [mod. - Please read the terms of commenting on SkS again.] changed the definition in 2001 the global warming advocates believe they are not lying when they use, “climate change,” to refer to naturally caused climate change but the general public hears the lie that the changes are being caused by human activity. [mod. - Statements like these generally get commenters banned at SkS. You're on thin ice.]
The IP address [mod. - URL.] for the earth’s annual absolute temperature cycle [mod. - Really?.] is:
https://ghrc.nsstc.nasa.gov/amsutemps/amsutemps.pl
Scroll down until you see the colored years. Select near surface temperatures channel 4, degrees Kelvin, and year 2006. Notice that for January the temperature is 258 degrees Kelvin and for July the temperature is 261 degrees Kelvin. When the earth is closest to the sun the earth air is 3 degrees Kelvin colder.
The IP address [mod. - URL.] for Earth Orbit — Wikipedia is:
http://en.wikipedia.org/wiki/Earth%27s_orbit
Notice in the second paragraph under the heading Events in orbit the following sentence. “The changing Earth-Sun distance results in an increase of about 6.9% (footnote 8) in total solar energy reaching the Earth at perihelion relative to aphelion.” Next scroll down to the table labeled Orbital Characteristics. The earth’s aphelion is 94.51 million miles from the sun and the perihelion is 91.40 million miles from the sun. The ratio is 1.034. Because of the inverse square rule the solar radiation power per area at the perihelion is 1.069 times higher than at the aphelion. 1.034 squared equals 1.069. (0.069*340.4wpsm=23.5wpsm) The difference in solar radiative forcing between July and January is +23.5wpsm and the earth’s air is 3 degrees Kelvin colder.
The earth’s air mitigates a 23.5 watts per square meter annual solar radiative forcing cycle [mod. - citation needed.] but according to the global warming advocates theory, it can’t mitigate a 1.48 watts per square meter [mod. - citation needed.] increase in radiative forcing from a 100 year increase in carbon dioxide [mod. - citation needed.]. On January, fifth, the solar radiation on the earth is 353.75 watts per square meter. On July, fifth, the solar radiation is 330.25wpsm. When the sun’s radiation power per area is 23.5wpsm greater the earth’s air temperature is 3 degrees Kelvin colder. The global warming activists don’t care enough about science to realize that there are very powerful natural physical mechanisms that mitigate earth’s air temperature during its elliptical path around the sun [mod. - called the greenhouse effect.]. The annual increase in radiative forcing due to carbon dioxide growth is 1,588 times smaller [mod. - citation needed.] than the amplitude of the annual solar radiation power cycle, (23.5/0.0148=1,588) [mod. - citation needed.] Yet the global warming theory public policy advocates do not feel the necessity to explain why these same powerful natural physical mechanisms can’t also mitigate such a small determinant of the earth’s air temperature. These physical forces of nature are called: cloud albedo, radiating to space as a function of air temperature raised to the fourth power, reduction in conduction as the temperature difference between earth’s surface and surface air gets smaller and ocean sequestration of heat.
Another global warming lie we can expose here is that their public policy advocates say it takes 40 to 100 years for the earth’s air temperature to adjust to a change in radiative forcing due to carbon dioxide growth. But how long does it take to adjust to daily changes in solar radiative forcing. Notice that from NASA.s annual temperature cycle graph that as the earth begins to move away from the sun on January, Fifth, the earth’s air temperature begins to increase within two weeks. This means the earth’s air temperature regulating mechanisms are already increasing radiative forcing faster than the sun's radiative forcing is decreasing.
This is an invitation to a, Frank Knight type, free discussion of reasonable men to discover whatever truth emerges that we can agree upon.
[mod. - (sigh).]
Moderator Response:[RH] Skating verrry close to the edge of spam. Again, we're not here so you can advertise your climate denial blog. If we have to hit the spam button it will delete all your past and future posts. IF you are interested in a rational science based conversation on this issue you're going to have to (a) settle down, and (b) stick to the supportable science, and (c) don't spam this site ever again.
-
Magma at 14:23 PM on 2 December 2016Justin Trudeau approves two big oil sands pipeline expansions
I hope this is cynical or calculated political gamesmanship on the part of the Canadian government rather than overt hypocrisy.
In other words, it will issue permits for half or more of the pipeline projects applying for approval, let them be built with private capital if the companies behind them are willing to take the risk, and then let them sink or swim, unaided by any public funding or bail-outs, on the economics of the medium and long-term market for bitumen in a decarbonizing world economy. The effective outcome may be the same, but the expenditure of political capital less.
And while that is happening keep raising the carbon tax on all sources of GHGs, from individuals heating their homes to the largest oil sands producers.
-
ubrew12 at 13:34 PM on 2 December 2016Trump and the GOP may be trying to kneecap climate research
"Knight said the only truth he is interested in is what reasonable men can agree upon after a free discussion." If you are claiming a significant 'climate' conclusion from the last 4.75 years, you're not in the category of 'reasonable men'. 'Free' does not mean 'free' to dispense with fundamental definitions of the phenomena you are discussing. I'm not 'free' to fly off a cliff because I think gravity is a hoax; although I will admit after a 'free discussion' I might convince several 'reasonable men' to join me, by convincing them we'd arrived at 'the truth'.
-
Miguelito at 13:01 PM on 2 December 2016Justin Trudeau approves two big oil sands pipeline expansions
I'll also point out that the Ontario Liberal government is really nose diving in the polls, a lot of which is because of what's happening in electricity markets from government tinkering and micro-management. If there's a lesson in that, it might be that excessive regulation by governments could have the same high political hurdles that high carbon prices will. That may bode well for high carbon prices in the long term, especially if voters fear government mismanagement more than they worry about what a carbon tax will cost them.
-
chriskoz at 12:57 PM on 2 December 2016Dear Mr President-elect: a message from across the Pond
nigelj@19,
Given global warming will have a definite life span whether 3,000 or 100,000 years it cannot stop all future ice ages [...] . Maybe this was an off the wall thought. But clearly global warming cant stop all ice ages.
No, this is false. AGW has the potential to last longer than 100Ky and definitely stop several ice ages. Despite scaddenp request not to "dogpile", I have to respond to such false statements, that you're persitently making. Looks like my response @4 was inadequate so I elaborate in detail here.
Understand the processes of Carbon uptake from this post.
Visualise the timescale of these processes it by looking at a picture in this comment and/or by reading Archer 2007.
Note that the slug of 4000-5000Pg of C, as David points in table 4, results in the residual over 30% of that slug (coloured red in the picture) staying in atmosphere beyond 40Ky timeframe of that picture. The "reaction with igneous rocks" (also called "rock weathering") that would eventually remove that residual has 100Ky+ up to 500Ky timeframe. That's half a million years.Now, turn to Archer 2005 where David desrcibes the "trigger model" of the glaciation onsets, particularly Figure 3 therein. In the middle of it, you see the periodic signal of Milankovic forcing (i.e. summer insolation variations in the arctic) in -/+500Ky timeframe. According to the model, the onset of ice age happen when said signal falls below the horizontal green line (i.e. the Milankovic forcing is not strong enough to melt the accumulated snow resulting in ice accumulation around N Pole). You can eyeball that in the next 500Ky, the Earth could face potentially up to 10 ice ages (Milankovic signal crosses green horizontal line 10 times). The very first, in ca 60Ky is a weak one but the next one in ca 120Ky, and several next ones are a strong ones.
Now, addition of some CO2 to the atmosphere will last up to 500Ky and result in warming in the arctics, therefore the green line triggering the glatiation will be lowered (because in warmer arctic, colder Milankovic signal is required for the ice to start accumulating). Figure 3 shows two scenarios of 1000 & 5000Pg C slug added to the atmosphere. The corresponding two red lines lower the glaciation threshold of horizontal green line. You can eyeball that the red line corresponding to 1000Pg C slug (the amount we're committed to achieve and likely surpass, even with strong AGW mitigation action) just lowers the threashold to the boundary of first predicted weak glaciation. Which means, we may have already postponed the first impeding glaciation in ca 60Ky. The second red line corresponding to 5000Pg C slug, total FF reserves that we are able to add to the atmosphere, brings said threashold beyond the variability of Milankovic forcings on the figure. Which means, that such disturbance would deprive the Earth of any glacial cycles for the next 500Ky.
So, the above is the proof that your statement above is false. AGW can (and likely will with the policies boasted by the current president-elect implemented in the next 100-200y until the exhaustion of FF reserves) overturn the Pliocene glacial cycles. Homo sapiens are in charge of the Earth's climate, among other things, on such long geological timescale.I would like to add that David, like most mainstream climate scientists, prefers to err on the conservative site: e.g. his jumper & trigger models do not include feedbacks that cannot be quantified such as permafrost melting positive feedback). Given that more positive than negative such non-quatifiable feedbacks exists, the true influence of AGW on glacial cycles may be higher than stated in Archer 2005. But that's just my speculation.
Please post further questions about ice ages in the threads I linked above, I won't respond here anymore.
-
Miguelito at 12:35 PM on 2 December 2016Justin Trudeau approves two big oil sands pipeline expansions
Andy: I agree there probably needs to be a mix of carbon pricing and regulations. Carbon pricing doesn't work well to control fugitive emissions in gas production, so regulations will be needed if that share of Canada's emissions are to shrink over the long term (which we already have some commitments by Trudeau for). Renewable portfolio standards are good if done in a competetive and market savvy way.
But, I think we're going to learn that regulations and greater market intervention by governments to achieve lower emissions could end up being high hurdles to public acceptance too, because these do come with higher costs that will be evident elsewhere. All I can think of is Alberta's recent GHG commission and all the testimony that essentially said, if you do anything, don't do what Ontario did. I agree with that.
-
Andy Skuce at 12:06 PM on 2 December 2016Justin Trudeau approves two big oil sands pipeline expansions
Miguelito, Trevor Tombe has a good article on the inefficiency of blocking infrastructure to reduce emissions. I mostly agree with it, although he should have acknowledged more clearly that the carbon price required to produce the emissions cuts that the government has pledged would probably be in the range of $200/tonne CO2e. While this would be effective and efficient, I doubt that it would be politically feasible.
Mark Jaccard has a good piece on how, in practice, we will need both carbon pricing and regulations to get the mitigation job done.
-
john warner at 11:59 AM on 2 December 2016Trump and the GOP may be trying to kneecap climate research
Ubrew12 @ 4, nigelj @ 5, jdeutsch @ 6 thank you for the replies. Enthymeme is an argument where one of the premises is not stated. This is a debating trick to influence the audience. The audience has to supply the missing incorrect premise to get to the speakers false conclusion. This is emotionally gratifying to the audience because this reinforces their belief that they are functioning at the same high intellectual level as some publicly recognized authority. Now the audience has a stake in the lie because their own self esteem is involved. No conscientious CAGW critic disputes that the earth’s air temperature is rising during the last 4.75 years and is at near record high levels. But the incorrect unspoken premise is that science has proven man-made carbon dioxide is the cause. If you have statistically significant evidence for a rigorous scientific explanation that man-made carbon dioxide concentration has had a substantial effect on the earth’s average annual global air temperature show it to me now. If you can’t, I have posted a tutorial at my website. (snip) moraleconomist.wordpress.com/ I can use this argument to systematically expose the lies that the global warming advocates have used to deceive an unwary public. Frank Knight said the only truth he is interested in is what reasonable men can agree upon after a free discussion. If the moderator allows me to paste the tutorial into a comment I will be more than happy to do so.
Moderator Response:[PS] More sloganeering gone. "CAGW" is pure rhetoric with no reasonable definition. Tried reading the IPCC WG1? Use the "argument" button to find what you think is your strongest argument and comment on the thread. Offtopic gets deleted. The science position is that long term trend is mostly due to CO2, short term variations (sub decadal) are due to natural variability. If you dont agree that is the scientific consensus then show science report that say otherwise. No more strawmen.
The comments policy on site is designed to allow reasonable discussion of science without political sloganeering or rhetoric. If you are not prepared to abide this comments policy, then this is not the site for you. Read it and abide by it, or go elsewhere. It is not open for discussion.
[RH] Snipped URL. We're not your advertising firm, bubba.
-
Andy Skuce at 11:52 AM on 2 December 2016Justin Trudeau approves two big oil sands pipeline expansions
rdr95, when I argue that the country is split over these pipelines, I acknowledge that there is support as well as opposition. People who have a stake in the growth of the bitumen business, in AB/SK as well as the Atlantic provinces are certainly strongly in favour, mostly regardless of their political leanings. Perhaps I have a bias living on the BC coast, but the many people here opposed to the pipeline are very pissed off.
As I said, I know that the oil business is important to Canada and I disagree with the Leap Manifesto people who think we can quickly shut it down. However, I think that a sector that is responsible for less than 10% of GDP gets disproportionate attention.
I wish that the "conversation" could turn away from, on one hand, those who argue that a rapidly growing oil industry is essential to economic health and those who simplistically call for it to be shut down. We need to find a way to a sustainable business that gets better rather than ever bigger.
Currently, Alberta is producing more oil than ever in its history and projects under construction will add a few hundred thousand barrels more per day. An industry that is producing record volumes and that is still growing ought not to be in crisis. The problem is that the boom times have created a hangover, and the remedy for that should be moderation rather than more binge drinking.
I think it's far from certain that increased transportation will lead to more growth in today's market. To be sure, new pipeline transportation will save a few dollars per barrel over the rail transport that might have been necessary without the new infrastructure and that will help. Also, there will certainly be options for new markets, which should be worth something. Ultimately, though, the economics will be determined by world prices and nobody should expect the bitumen quality discount to vanish. Even Premier Notley said today that the new infrastructure will not lead to more production.
Prev 428 429 430 431 432 433 434 435 436 437 438 439 440 441 442 443 Next


