


 Arguments


Recent Comments
Prev 470 471 472 473 474 475 476 477 478 479 480 481 482 483 484 485 Next
Comments 23851 to 23900:
-
Mike Hillis at 12:52 PM on 12 June 2016Most of the last 10,000 years were warmer
And this says nothing about the main problem with the OP, which is the elephant in the room, namely, the claim that ice cores are only a local proxy of paleotemperature. Easterbrook correctly uses it as much more than a local proxy, as does Alley, who says in "Two Mile Time Machine"
p. 114 "Much of the world's climate is coupled to that of Greenland"
p. 121 "The surface of the north Atlantic was cold whenever Greenland was cold, and the north Atlantic surface was warm whenever Greenland was warm."
Anybody can see that Greenland is not the source of the moisture that falls on it. Furthermore, the snow that falls on Greenland is not due to condensation of water vapor, but the deposition (the opposite of sublimation) of water vapor, in other words, from the vapor state directly to the solid. Since there is no liquid phase in between, in the formation of snow, the fractionation of condensation is not relevant in snow production. Only the fractionation of freezing. And since the freezing point of water and that of 180 water are only 0.23C apart, there is very little fractionation at the precipitation site, compared to the much greater fractionation due to evaporation, because of the much greater difference in the boiling/condensation points between the two species. It follows that the temperature proxy demonstrated by the ice cores reflects temperatures at the evaporation site much more than at the deposition site.
-
Mike Hillis at 12:30 PM on 12 June 2016Most of the last 10,000 years were warmer
Easterbrook used Cuffey and Clow 1997 who I cite presently:
"In this paper, we treat our calibrated isotopic history as synonymous with temperature"
and
"We have found the calibrated d18O record to be a good proxy for environmental temperature.....with the following calibration: T = 3.05 d18O + 75.4 for t = 8,000 years,"
and 3 similar calibration equations for different levels of t, with no factors in any of the equations other than the ice isotopes d18O. No factor for any adjustments for elevation using total gas content in the bubbles, and although these were discussed in the paper, the discussion was limited to why this information could not be used. No mention of gas isotopes in the equations either, and although I appreciate your correction of your use of the word "diffraction" when you meant "fractionation" of the gas isotopes, the bubbles were still not used. As much as you stretch your arguments to the several imagined or pretended ways the bubbles were used, extending even to the citing of papers written years after Easterbrook's, they were not.
And since the bubbles were not used, the time it takes for consolidation of snow into firn and ice is not germain to the proxy used by Easterbrook.
And as much as MA Rogers tries a "gotcha" gambit by pointing to the Alley paper, claiming that he used the gas isotopes in the temperature proxy, Easterbrook used Cuffey and Clow, who never did.
In other words, the phrase in question in the OP, about how it takes decades for the snow to consolidate, should be removed. For my reasons, not yours.
-
Tom Curtis at 10:08 AM on 12 June 2016Most of the last 10,000 years were warmer
MA Rodger @82, the sentence, "The reason is straightforward enough — it takes decades for snow to consolidate into ice" is quoted from the OP, and is now shown to not be straight forward, but straight forwardly false. From the OP, the "reason" is the reason why 1855 is the terminal point of the data. If the reason for that terminal point is a smoothing of the data, that may be a sufficient reason for the 1855 terminal point, and would also be reason as to why the 1855 represents a function of actual data both prior to and after that date. From the description of the data, that is at least part of the reason as to why the terminal point in the data is 1855 rather than 1987 (the terminal point of the d18O data). There may, however, be some further reason as to why data used in the smooth was terminated prior to 1987 as well.
I am not convinced that the smooth did not us all the post 1855 data. That is because any increase in the post 1855 data is likely to have had a equivalent increase in pre 1855 data for that data point. Had data to 1987 been used, then data from 1723 would have been used in generating the smoothed 1855 data point. The lower temperatures in 1723 relative to 1855 would have approximately balanced the higher temperatures in 1987 relative to 1855.
-
Tom Curtis at 09:44 AM on 12 June 2016Most of the last 10,000 years were warmer
Mike Hillis @80, yes, "here we go again with the air bubbles". Just because you do not understand the mechanisms involved does not mean they are invalid, nor that they have not been properly explained in Alley (2000a) and (2000b), as noted @69 above.
Specifically, Alley (2000a) states:
"Temperature gradients cause gas-isotope fractionation by the process of thermal diffusion, with heavier isotopes migrating toward colder regions. Diffusion of gases through pore spaces in firn is faster than diffusion of heat, so the isotope signal reaches the bubble-trapping depth before the heat does, and the isotope anomaly is recorded as the air is trapped in the bubbles (8). The degree of enrichment reveals how big the temperature difference was, and thus the magnitude of any abrupt climate change. In addition, the number of annual layers between the record in the ice and in the bubbles of an abrupt climate change is a known function of temperature and snow accumulation; using snow-accumulation data, one can learn the absolute temperature just before the abrupt climate change (8)."
Alley (200b) states:
"New gas-isotope techniques pioneered by Severinghaus, Sowers, Brook et al., (1998) o!er this high-frequency calibration at important transitions. On cold ice sheets with little or no melting, the transformation of snow to ice takes decades to millennia, and there are tens of meters of old snow called firn above the depth at which bubbles are formed. Wind-mixing is limited to the top few meters, so tens of meters of firn exist in which gases exchange with the free atmosphere by di!usion alone.
Gravitational fractionation causes the gases trapped by bubbles forming at the bottom of the firn to be very slightly heavier than the free atmosphere, in predictable and regular ways (Sowers et al., 1989). However, following abrupt climate changes, the trapped-gas composition is also perturbed slightly by thermal di!usion."
Reference 8 in Alley (2000a) is just Severinghaus, Sowers, Brook et al., (1998), which states:
"Observations of thermal diffusion in nature have thus far been limited to gas-filled porous media such as sand dunes and firn, where advective mixing is inhibited by the small pore size such that transport is mainly by diffusion. These observations confirm that transient seasonal and geothermal temperature gradients fractionate air approximately as predicted.
After an abrupt climate warming, transient temperature gradients lasting several hundred years should arise in the upper part of the firn owing to the thermal inertia of the underlying firn and ice. The heavy gas species such as 15N 14N and 40Ar should therefore be preferentially driven downwards, towards the cold deeper firn, relative to the lighter species (14N2 and 36Ar). An important point is that gases diffuse about 10 times faster than heat in firn, so the thermally fractionated gas will penetrate to the bottom of the firn long before the temperature equilibrates, and the gas composition will closely approach a steady state with respect to the firn temperature such that equation (1) should be valid."Your gross misunderstanding of the process involved clearly shows that you did not read the linked references (which are only the scientific articles we are discussing in the first place). Your strongest argument appears to be your invincible ignorance.
By 2010 this method was sufficiently refined that Kobashi et al (2010) and Kobashi et al (2011) could use it to construct an independent GISP 2 paleo temperature record. In 2000, however, Alley only used it as a supplement to his basic d18O paleothermometer. But because he used it as a supplementary thermometer, the depth at which the nitrogen and argon isotopes can be used to effectively provide a temperature record becomes important.
I will note that I have incorrectly used the term "diffraction" when I should have used the term "fractionation". That is a massive error compared to your identifying the wrong isotopes, the wrong method, and falsely claiming the gas isotopes would equilbriate with the ice isotopes that it must obviously prove your point /sarc
Your compete befuddlement with regard to the gravitational fractionation as a paleothermometer is as nothing compared to your comments on total gas content. You are very specific that "[Cuffey and Clow] found that the elevation of the Greenland Summit did not change at all during the Holocene." This is a point you are so secure on that you make it the foundation of your claim that you had the relevant knowledge to exclude any possible elevation correction in the recent record.
It even has some basis in Cuffey and Clow, who state, "The corresponding elevation (relative to sea level)
histories show a near-constant Holocene elevation". The only problem is that the full sentence states, "The corresponding elevation (relative to sea level) histories show a near-constant Holocene elevation for AL = 50 km, and a decreasing Holocene elevation for larger retreats (Figure 2b)." (My emphasis) This relates to the discussion of three assumptions about modeling of elevation based on marginal retreats of the ice. As is clear, they are only committed to "near-constant Holocene elevation" if marginal retreats match the 50 km assumption, however they find that:"Which of these elevation curves is most reasonable? Geologic evidence indicates the Greenland Ice Sheet margin had extended about 200 km in the southwest part of the island and about 150 km eastward during the last glacial [Funder, 1989; Funder and Larsen, 1989]. At the latitude of Summit, the western margin position is not well known but was probably at least 100 km extended. Thus we expect the histories with 100 km > AL > 200 km to be most appropriate."
They go on to say:
"The GRIP data of Raynaud and colleagues likewise show a large decrease in gas content during deglaciation, and in addition show a sizable gas content increase from early to late Holocene (Raynaud et al., this issue). If elevation changes of the ice sheet are responsible for these trends, then the ice sheet surface must have been at lower elevation during the glacial, have risen during deglaciation, and have decreased elevation again through the Holocene. This pattern compares best with our elevation curves for marginal retreat distances of 100 to 150 km. However, problems with interpretation of total gas content as elevation preclude a firm conclusion at this time."
In otherwords, "[Cuffey and Clow] found that the elevation of the Greenland Summit did not change at all during the Holocene" only if you assume they found marginal retreats nearly a third less than those they actually found, and totally ignore the gass content data, which was reproduced in Vinther et al (2009):
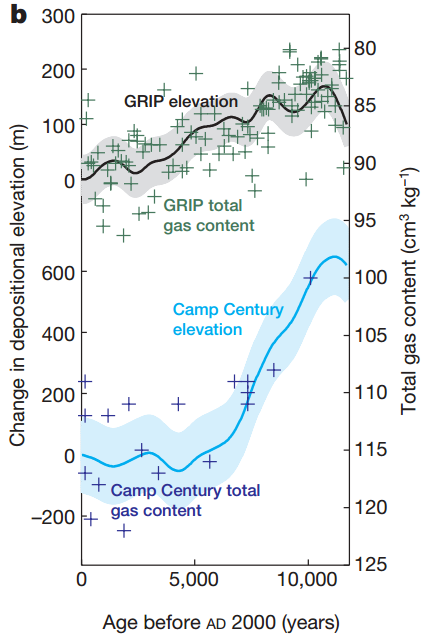
So, your defence against my claim that you certainly did not consider elevation changes is to assert that Cuffey and Clow did not find any elevation changes so that your failure to consider them was entirely justified. By that defence you prove that you did not consider elevation changes, which Cuffey and Clow found to exist, and which gas data show to have fluctuated significantly in recent times (see GRIP total gas content in the graph above). You thereby prove, not only that you are wrong about the elevation changes, but that you indeed did not consider them as I originally asserted. Your defence merely proves my assertion justified. LOL
For the record, the most recent air content data for the GRIP ice core is 169 BP (ie, 1781), and indicates an elevation at the Greenland Summit over 100 meters above current levels (as seen above).
Also for the record, I note that Mike Hillis continues to argue by mere assertion; and has now resorted to asserting findings for scientific papers that are directly contradicted by those papers. Just how much sloganeering is permissible at Sks?
-
Tom Curtis at 08:20 AM on 12 June 2016Mars is warming
Dutchwayne @49, it is difficult to take seriously a comment that says, "The biggest weakness though is on the side of the critics of Mars warming" while ignoring that the evidence put forward for Mars warming by AGW "skeptics" seems primarilly to be evidence of changing seasons. See my comments at 29, and at 31, along with HK's comment at 40.
If we consider the more serious evidence of a warming Mars, it comes in two forms. The first is the study by Fenton (2007) that showed changes in albedo on the Mars surface:

Averaged across all areas, the surfuce darkened, implying a greater absorption of sunlight. From this, Fenton deduced a global warming on Mars of surface by approximately 0.6 C. Note that we do not possess independent measurements of Global Mean Surface Temperature of Mars of sufficient duration to independently confirm the magnitude of that increase. Rather, from a change in albedo, we deduce a change in GMST for Mars.
This immediately suggests a problem with your claim that we use Mars as "a cleaner way to determine the true solar radiation impact on Earth". The GMST of Mars is not effected by incoming sunlight alone, as you claim, but also by changes in albedo. Worse, while we know of the changes in albedo, we do not know the value of the change in GMST on Mars in any event in order to make your indirect measure.
There is some direct, but inconclusive evidence of warming on Mars. Specifically there have been reductions in the amount of CO2 ice at the South Pole, shown here:

This evidence does show that there is polar warming at the South Pole of Mars, but does not show conclusively a reduction of martian GMST, as it may be matched by cooling elsewhere (particularly tropical regions, in some of which there are significant increases in albedo). However, it also shows an increase in CO2 in the martian atmosphere - and consequently an increase in the martian greenhouse effect. This introduces a second confounding factor to the martian GMST proxy of changes in insolation, measurements of which we do not have in any event.
Given these two confounding factors (changes in martian albedo, and changes in martian atmospheric CO2) and the lack of long term temperture measurements on Mars, perhaps (as Eclectic sugggests @50) we should relly on the satellite record of Total Solar Irradiance. That record, of course, shows an overall decline in TSI since the 1980s:

-
MA Rodger at 18:15 PM on 11 June 2016Most of the last 10,000 years were warmer
Correction @82 - (ie the Alley (2004) rise 1750-1855 of 0.4ºC is too small given the full data).
-
MA Rodger at 18:11 PM on 11 June 2016Most of the last 10,000 years were warmer
Tom Curtis @79,
I agree that the Alley (2004) data is almost certain to have used post-AD1855 data and that such data (indeed even the measurements at AD1855) would not be from layers that had by the time of their sampling been truly 'consolidated into ice'. Yet I do not believe that the data used by Alley (2004) included all the data up to that measured at AD1987. That is why I hedge my bet @76 & suggest the post 'may not be strictly correct'.
Note too that the "reason" which is described as being "straightforward enough" concerns either (1) why the data that Easterbrook was "not from the top of the core" or (2) why it comes "from layers dated to 1855." Which it is? That is not clear.
The one circumstance that would make this "reason" wrong in any circumstance would be if the reason was wholly a need to smooth the data. That is if all the data was used up to "the top layer" but this resulted in the latest data point being AD1855, then the length of time for 'consolidation into ice' is an irrelevance & the "reason" given by the post would be incorrect.
My reasons for believing that some data has not been used from the most recent layers is that plots of the Alley (2004) data and a smoothed plot of the d18O data to 1987 appears to show that the AD1855 data point would have given a higher value if all the post-AD1855 data was used (ie the Alley (2004) rise 1970-1855 of 0.4ºC is too small given the full data). I suspect that up to 100 years may have been shorn from the measurements and their absence is preventing temperature calculations for years later than AD1855. Also, one worrying feature of the latest data is the increase in inferred annual temperature cycle, an increase that starts to show itself for measurements from the 1890s. And other calibration data which relies on ice formation will become more raggedy as the layers of consolidated ice are left behind.
Such "reasons" would amply explain why the 'top of the core' was not used (as (1) above). I consider however that it is not semantically true for (2) as the "layers" are not dated to AD1855 but rather it is the average of the usable layers (that have been adequately consolidated) that date to AD1855. Add in a discomforting amount of supposition in this discourse, and the matter does require a mention.
Mind, I would not consider the audience of Mike Hillis as approporiate for this matter. He may feel he has hit the target but in truth he tramples the target. As stated @79, his reasoning is invalid.
For him, the point to mention is that his interpretation of this ice core data surely shows that the four warmest summers of the years for which we have adequate data (the last 1,000 years) apparently occurred in the last 10 years of GISP2 ice/snow data with half the top 30 warmest summers occuring since 1950. So would he be happy proposing such a hockey-stick-like finding? Or would he wish to revise his position?
-
jonb at 13:42 PM on 11 June 2016Climate scientists have warned us of coral bleaching for years. It's here
Nice article but the comment that the Great Barrier Reef is (or was recently) "close to pristine" is completely wrong. At best one might say the northern quarter was relatively pristine (and unfortunately this experienced the worst bleaching) but the southern three quarters was already heavily degraded with more than 50% of the coral lost, dugong populations in severe decline, seagrass in episodic die-offs, and other issues. I can't believe this statement came from John Bruno who published some of the earliest papers showing the state of decline of the coral on the GBR. So I assume it came from elsewhere but should be corrected.
-
sidd at 12:58 PM on 11 June 2016Greenland’s Melt Season Started Nearly Two Months Early
" ... sees the graph shoot way up from the current minimal levels ... "check the nsidc link, june spike is here
-
Eclectic at 10:09 AM on 11 June 2016Mars is warming
Dutchwayne @49 - you are certainly correct that Mars is a far simpler climate system. But given the very great differences between it and Earth, it is therefore a much poorer comparison to Earth's system. So therefore what useful information can be gained in the comparison, which could not be better obtained elsewhere?
For instance: solar activity is better measured directly by Earth satellite, rather than by observation of its effects on a planet which is (varyingly) 60 million to 400 million Km from Earth.
-
dvaytw at 00:13 AM on 11 June 2016Extreme weather isn't caused by global warming
Well said, Eclectic. And this person isn't my friend.
-
Dutchwayne at 00:10 AM on 11 June 2016Mars is warming
The problem with a lot of these arguments on Mars heating is there is no clear effort to account for the distance greater distance and size of the orbit. Yes mars wobbles and it has an impact, but the orbit is longer and the changes happen slower. The thinner atmosphere works both ways in the argument as does the smaller planet size. The intensity of the solar radiation is also less. I have looked over the reports and I do not see any real attempt to make this an apples to apples comparison that actually proves either case decisively. The biggest weakness though is on the side of the critics of Mars warming. The simple truth is mars has a solid core and no magnetic field worth mentioning. There is little heat being generated in the planet unlike Earth and therefore virtually all the thermal impact comes from only one driver: Solar radiance. the thin atmosphere eliminates the green house effect meaning there is little to temper the solar variations. by logic, Mars is in fact a better indicator of Solar activity variation than Earth and that is a critical point. It is a simpler problem to study with less variables and close enough to the Earth to have real value. There is some indication in the report the authors are working toward that conclusion. However, the outright assault on their idea by the factions supporting man made global warming are clearly based on neutralizing the argument. Their objections are not based on data nor are they refuting the evidence. The logical approach should be to ask for clarification and specific results and a clear definition of the relationship between the effects on Mars and the Earth. Instead, it is a "shut up it doesn't matter" approach normally seen in politics,not science. It is pretty clear the problem is difficult to solve on Earth which is a far more complex system than Mars. Mars offers us a cleaner way to determine the true solar radiation impact on Earth. Rejecting the idea is foolish. -
KR at 23:15 PM on 10 June 2016Most of the last 10,000 years were warmer
Mike Hillis - I've looked over this thread a couple of times, and I one major question for you:
What is your point?
The archived and published temperature data for Alley 2000, using "...ice-isotopic ratios, borehole temperatures, and gas-isotopic ratios" (emphasis added), indeed starts at 1855 and goes back, entirely appropriate for examining the Younger Dryas cold period - the entire point of the Alley 2000 paper.
Gas-isotopic ratios aren't usable until the firn packs, borehole temps near the surface become increasingly noisy due to local weather, and most of all, Alley wasn't using paleo data for the last few hundred years of temperatures. Whether or not it's possible to extract paleotemperatures from the top few meters of recent snow is simply immaterial - you don't need paleotemperatures when there's an existing instrumental record, and Tom Curtis and others have correctly pointed out that recent years aren't in the published data from that ice core. Easterbrook, Monckton, and others (mis)using the Alley 2000 and GISP2 data made fundamental dating errors in their arguments, local temps aren't global temps, and so the myth discussed in the OP is, indeed, busted.
IMO you made some extremely strong and unsupported claims against the OP in your first post ("this fabrication"), and have since been dancing around the corrections provided to you; trying to retain some kind of issue to be "shocked" about. As far as I can see there is no issue with the OP, and you are now arguing about (possible) data of no interest to Alley 2000, data that wasn't collected or published, data irrelevant to either the paper or to the dating errors made by (among others) Easterbrook and Monckton.
Arguing about the number of angels that could dance on the head of a pin would be just as relevant to the opening post. If you have an actual issue with the OP, please state it - otherwise, you're just making noise.
-
Eclectic at 21:03 PM on 10 June 2016Extreme weather isn't caused by global warming
Dvaytw, it is interesting that your "friend" demands that climate change should have an "all or zero" effect on extreme weather events, and that extreme weather events themselves be "all or zero" extreme/non-extreme, with no fuzziness of inbetween status.
Your "friend" is playing word-games to deceive you and/or himself. Some things can be defined precisely, but some (just as valid in concept) can only be defined with fuzzy logic.
When is sunset exactly - when the sun first touches the horizon / when it is halfway below the horizon / or when the final bright limb of the sun is occluded by the horizon? And mean sea-level horizon? : viewed from what altitude? Five-foot or fifty-foot eye-point?
When does full night start? At sunset, or after the "civil" twilight finishes - or after the "astronomical" twilight? It is all rather arbitrary and imprecise, to a greater or lesser degree. Fuzzy. But it is crazy to deny the real usefulness of concepts such as sunset and twilight.
Does your "friend" think that men and women are separate concepts? Can he tell them apart? Always? How precisely does he define the difference? Appearance is sometimes confusing or deceptive. Sometimes in rare cases for a newborn, the expert paediatricians can be perplexed in making the male/female decision - even with the closest examination of the genitals. Blood hormonal levels can be indecisive. Even when the genome is clearly XX or XY, the outcome can sometimes be apparently "wrong".
Or does your "friend" maintain there is no difference between man and woman?
-
dvaytw at 18:47 PM on 10 June 2016Extreme weather isn't caused by global warming
Hey SkS'ers. I've been engaging in my guilty hobby of debating denialist trolls again. Have been having a pretty lengthy one on Quora. Basically the only point he continues to give me trouble on is on the question of definitions. He claims that in "real science", terms are defined precisely. He then goes on to say that this doesn't happen in climatology; he uses the example of "extreme weather". If one goes to SREX, 3.1.2., one gets the following definition:
This report defines an ‘extreme climate or weather event’ or ‘climate extreme’ as “the occurrence of a value of a weather or climate variable above (or below) a threshold value near the upper (or lower) ends of the range of observed values of the variable”
It goes on to explain a lot of issues, advantages, disadvantages etc with the different methods of determining threshold values. His argument is that with such a broad definition (he refuses to even call it a definition), they can basically call anything they want "extreme weather".
I have responded that the IPCC isn't dictating definitions to scientists; further that the broadness of the definition isn't a problem with the science but a feature of reality that scientists must deal with. He claims that it should be easy to come up with a clear and precise definition (he suggests the standard deviation of the index). He asks me how, for example, the IPCC can give a probability that ACC is affecting extreme precipitation when they can't even precisely define what extreme precipitation is.
Can anyone offer help on this? An example in another science where a definition is range migh be very helpful, or anything else y'all can offer.
-
jobel at 17:45 PM on 10 June 2016There's no empirical evidence
Maybe I miss something but there seems to be something wrong with the line of argument.
First argument “we’re raising CO2 levels” seems plausible, there is a clear exponential rise of CO2 that correlates to the increase in population.
Second argument “CO2 traps heat”: that is probably true but irrelevant for the reasoning before we have established that there is a phenomenon that we need to explain.
Third argument: “The planet is accumulating heat”: yes, the diagram clearly shows a drastic increase. But the time period starts 1960, if you instead look from 1880 you get a slightly different picture: the temperature has increased during the 20 century but in more of a linear fashion. If the heating of the planet was caused by human action then the smoking gun would be a correlation between CO2 levels and temperature but there is none. the number of people and emission of greenhouse gases are increasing exponentially, air and sea temperatures are increasing linearly.
I don’t have a personal opinion in this, but from a purely logical standpoint there seems not to be any evidence that climate change is man made.Moderator Response:[PS] What theory would predict, is that climate moves in response to NET forcings, not just CO2. Please these articles here and here for further discussion. You might also like to review basic, laboratory-based physics in a textbook to review your assessment that CO2 trapping heat is only "probable".
-
denisaf at 15:44 PM on 10 June 2016Trump and global warming: Americans are failing risk management
Despite all the contrary views, irreversible rapid climate disruption and ocean acidification is under way due largely tothe emissions from fossil fuel usage. That is the stark reality.The most society can do is adopt as rapidly as physically possible measures that will reduce the rate of greenhouse gas emissions, so slow down what is happening in the atmosphere and oceans, while adopting measures to cope as far as it may be possible with such consequences as sae level rise and additional storms. Thta will have to be done even as the services provided by the existing aging infrastructure declines as the natural resources it uses runs out.
-
Mike Hillis at 13:58 PM on 10 June 2016Most of the last 10,000 years were warmer
Here we go again with the air bubbles. We are measuring the oxygen isotopes in the ice crystals, the O in the H2O, not in the O2 of the air bubbles. Nobody cares about the air bubble entrapment when measuring the isotopes in the ice. You keep talking about the isotopes in the gas bubbles. Do you think that air passing in and around snowflakes and uncompacted firn somehow changes the isotope contant of the snow? Are you suggesting the 18O and 16O in the ice diffuse differently into the air during sublimation of the ice? Not going to happen. Or maybe the 18O and 16O in the oxygen of the air diffuse into the ice somehow, and differently for the two species? I doubt it, but so what if they did? The isotope content of the O2 in the atmosphere has been stable for millions of year, and any change it effects on the 18O/16O ratio of the ice would be the same for every age of ice, and it would make no difference whether the air was trapped or not. Gravitational diffraction of isotopes? You can diffract light, how the heck can you diffract an isotope? I think you made that up. It's not a typo because you said it twice. You can't diffract an isotope with gravity. Makes no sense.
If what you are talking about is dating the air bubbles trapped in the ice, or analyzing the atmospheric gas content over time, via those bubbles, that's one thing, and yes the air in the ice is newer that the snow it's trapped in, because of diffusion, but this is not related to paleothermometry. To get a temperature proxy, isotopes are measured by taking ice, firn, or snow from the cores, and melting them, and testing the isotopes in the water. Nothing is done with the air during that test. The oxygen is passed to CO2 and bombarded with electrons so they have a charge, and the charged CO2 is accelerated past a magnet which bends the path, and the CO2 with 18O goes one way and the regular CO2 goes the other way.
As for measuring the total gas content of the ice related to altitude, that's another thing, which I never mentioned, purposely. Here's how it works anyway...The atmosphere is thinner with altitude so less air will be trapped in high altitude snow, so Cuffey and Clow measured total gas content released from the ice as it melted (not pressure of the air bubbles, as you say. Pressure? Nobody measures pressure of gas bubbles in ice. They melt the ice.) They found that the elevation of the Greenland Summit did not change at all during the Holocene. So why would they use total gas content of the ice (not pressure) to adjust for elevation? I will quote you now:
"Evidently no such correction can have been made for the most recent data in the record, but Mike Hillis certainly did not know that"
Really? I certainly did not know that? I did not know they would never adjust for elevation that did not change? Hmmmm.
-
Tom Curtis at 08:56 AM on 10 June 2016Scientists: 2016 likely to be hottest year on record despite looming La Niña
william @3, the amount of CO2 that can be drawn down into surface waters of the ocean reduces with increased temperatures, all else being equal. That means that on a subdecadal scale, change in CO2 content from year to year is as much a function of changes in Global Mean Surface Temperature as of net emissions. The decadal trend is still a function of emissions. Consequently, the record hot April just experienced will have resulted in a near record increase in atmospheric CO2, even with no increase in, or even slightly declining CO2 emissions. However, this will be countered by much reduced atmospheric increase with essentially the same emissions next april, which is likely to be effected by a La Nina.
There is no indication that, and it is certainly too little data to conclude that, there has been a shut down of any carbon sink beyond the temperature dependence of absorption of excess emissons that has been observed since 1850.
-
Tom Curtis at 08:50 AM on 10 June 2016Most of the last 10,000 years were warmer
MA Rodger @78, I have done some further investigation and found out that Mike Hillis is correct on one key point. Specifically, when comparing the Alley (2004) data to the Washington University measured samples data, it becomes evident that the first few samples in the Alley data are at approximately:
- 51.39 meters
- 55 meters
- 57 meters
- 58 meters
- 58 meters
- 61 meters
- 62 meters
- 64 meters
- 66 meters
- 68 meters
- 68 meters
- 70 meters
- 72 meters
- 74 meters
(All values other than the first rounded to the nearest meter.)
The issue here is that while all values are well inside the diffusion zone (below the first 20 meters of firn) where diffusive and gravitational diffraction of isotopes occurs, it is not until the 14th (or possibly 13th) value that we find a value below the close off depth at which the firn closes to form bubbles in the ice (specified as 72 meters fo GISP 2 in table 1 of Schwander et al (1997)). Arguable the 8th through 13th values come from the non-diffusive zone of the firn, where "air is not able to equilibriate with the overlying diffusive zone because of the tortuous nature of the firn" (Schander et al 1997), and hence where included air is effectively sealed from the atmosphere even thought not yet enclosed in ice bubbles. It remains that the first seven values are from the diffusive zone where air content is essentially modern, though with some diffraction of heavier isotopes. Ergo it is not possible that the explanation given in the OP (and by myself @ 53) for the 1855 terminal data of the Alley (2004) record as related to the closure of the firn is correct, even in principle.
Of even greater concern is that the Alley values do not allign precisely with the "measured values". Given that Alley (2000a) and (2000b) (of which Alley (2004) is the data record) are derived from Cuffey and Clow (1997), who derive their oxygen isotope data from Grootes et al (1993) of which the "measured values" are the record. It may be that this is because the measured data has been updated for some of the later studies of which it represents the cached data. However, annually resolved oxygen isotope data were available as early as 1995 (indeed, earlier given time from submission to publication), so that is unlikely to be the reason.
The discrepancy is more likely to be due to the fact that in Alley (2004) "Data are smoothed from original measurements published by Cuffey and Clow (1997)" (my emphasis). That being the case, the 1855 terminal data point may include data from later than 1855, as well as earlier. I say "may" because at that point at that time in the "measured values" there are several values per annum so that the smoothed values may come from entirely within 1855, and are unlikely to include values earlier than 1861 (based on the interval to the next value). Regardless, I think the nature of the smooth, and if possible the original data values need to be clarrified with Richard Alley, and the OP corrected to account for that information. This is even more necessary than the need to delete the straight forwardly erronious claim that "The reason is straightforward enough — it takes decades for snow to consolidate into ice".
While I don't mind admitting errors, I must admit some chagrin to discover that Mike Hillis has made true claim based on invalid reasoning (ie, the assumption that only oxygen isotope data goes into the temperature determination). In particular, air pressure in enclosed ice was used to confirm the altitude correction in Cuffey and Clow (1997), for which the relevant data clearly does not come up to the present (see Raynaud et al (1997) figure 1). Evidently no such correction can have been made for the most recent data in the record, but Mike Hillis certainly did not know that.
In passing, my discussion above presents evidence that shows a couple of his more recent claims to be false. His claim @75 that "the core study at the University of Washington was started around 1997" is shown to be egregiously in error, given that the first published paper from that core study was in 1993. His explanation that "Alley stopped his temperature data at 1855 in his paper on the Younger Dryas, not because that's the latest data he had, but more likely because he was writing about an event at the beginning of the Holocene and anything after 1855 was not relevant to the Younger Dryas" is also shown to be false. Alley (2004) does not represent just the data for Alley (2000b), which discusses the younger Dryas, but also Alley (2000a), and more importantly Cuffey and Clow (1997) which discusses the temperature record from the GISP 2 ice core, and which therefore had every reason to be brought as close to the present as possible.
-
william5331 at 08:46 AM on 10 June 2016Scientists: 2016 likely to be hottest year on record despite looming La Niña
Something else rather curious is happening. If you look at the Mana Loa Carbon dioxide readings from April, the increase from the previous April is 4.16ppm. If you look at the series starting from December they are 2.91, 2.56, 3.76, 3.31, 4.16 and May to May, 3.76. Is this some effect of El Nino (less biological activity off the West Coast of South America), the shut down of a carbon sink or two or something else entirely.
-
ubrew12 at 06:10 AM on 10 June 2016Trump and global warming: Americans are failing risk management
Tom Curtis@3: Regarding Duterte, I think John Oliver said it best: "When you don't know how many people you've killed, it's 'Too Many' !"
-
Tom Curtis at 00:20 AM on 10 June 2016Trump and global warming: Americans are failing risk management
Jaimesaid @4, the IPCC defines "climate", saying:
"Climate in a narrow sense is usually defined as the average weather, or more rigorously, as the statistical description in terms of the mean and variability of relevant quantities over a period of time ranging from months to thousands or millions of years. The classical period for averaging these variables is 30 years, as defined by the World Meteorological Organization. The relevant quantities are most often surface variables such as temperature, precipitation and wind. Climate in a wider sense is the state, including a statistical description, of the climate system."
That is clear and concise, but if you want a more concise gloss on that definition, "Climate is the 30 year mean, and distribution of all meteorological values." If follows from that definition of "climate" that if the 30 year mean and/or distribution exhibit a statistically significant change, the climate has changed. From that you have a clear and precise definition of "climate change".
You can assert there is a problem with the definitions here, but that represents a rhetorical stance, not a rational one.
-
climatehawk1 at 23:38 PM on 9 June 2016Trump and global warming: Americans are failing risk management
Worth noting: thought I would poke around yesterday and see who was hyping the Arctic sea ice "recovery" in 2014. I came across this comment from Judith Curry (who is featured in the cartoon): "The relative recovery of the Arctic sea ice last September has pretty much put the kibosh on forecasts of an imminent ‘spiral of death’ for the Arctic sea ice." https://judithcurry.com/2014/06/17/what-can-we-expect-for-this-years-arctic-sea-ice/
-
Jaimesald at 22:46 PM on 9 June 2016Trump and global warming: Americans are failing risk management
There is the problem that there is no unique/unambiguous understanding/definitions for the concepts of Climate and Climate Change, not even for IPCC/UNFCCC.
-
Tom Curtis at 14:34 PM on 9 June 2016Trump and global warming: Americans are failing risk management
chriskoz @2, as bad as a President Trump would be (and he would certainly be inimical to the USA's national interest, and even more so for the demographic that most supports him) he cannot be considered as bad as the current president elect of the Phillipines, Rodrigo Duturte. Against that, Duturte will be disasterous for the Phillipines, but for no other nation while a President Trump would be a disaster for the western world. That is not, however, a measure of relative incompetencies, but of the relative power and economic significance of the USA.
-
chriskoz at 13:13 PM on 9 June 2016Trump and global warming: Americans are failing risk management
John Hartz@1,
Thank you for bringing this piece of evidence here. I want to follow up with further evidence I found referenced therein.
It only confirms that Trump does not care about veracity of his comments and the consitency of his positions on any issue facing Americans, that he should be nominally concerned as a presidential candidate. That applies not only to climate change mitigation but any policy imaginable.
With respect to the climate change policy, in Feb 2010, just two months after having signed the open leter to Obama you're quoting here, Trump told members of the Trump National Golf Club that Al Gore should be stripped of his Nobel Prize because that winter had been cold.
“With the coldest winter ever recorded, with snow setting record levels up and down the coast, the Nobel committee should take the Nobel Prize back from Al Gore”
Such self-contradiction signifies at least childish-like irresponsibility. We've seen similar contradictions over and over. It's hard to imagine a presidential candidate who could rival him in his inaptitude as a leader of any country, needless to say the most powerful country in the world. If he'd been elected in November, it'd have been an unprecedented paradox in the history of humanity.
-
John Hartz at 09:12 AM on 9 June 2016Trump and global warming: Americans are failing risk management
Prior to pandering to the extreme right-wing nuts in the US, Donald Trump (and three of his children) sang a different song about manmade climate change...
As negotiators headed to Copenhagen in December 2009 to forge a global climate pact, concerned U.S. business leaders and liberal luminaries took out a full-page ad in the New York Times calling for aggressive climate action. In an open letter to President Obama and the U.S. Congress, they declared: “If we fail to act now, it is scientifically irrefutable that there will be catastrophic and irreversible consequences for humanity and our planet.”
One of the signatories of that letter: Donald Trump.
Also signed by Trump’s three adult children, the letter called for passage of U.S. climate legislation, investment in the clean energy economy, and leadership to inspire the rest of the world to join the fight against climate change.
“We support your effort to ensure meaningful and effective measures to control climate change, an immediate challenge facing the United States and the world today,” the letter tells the president and Congress. “Please allow us, the United States of America, to serve in modeling the change necessary to protect humanity and our planet.”
Donald Trump once backed urgent climate action. Wait, what? by Ben Adler and Rebecca Leber, Grist, June 8, 2016
-
villabolo at 04:17 AM on 9 June 2016Scientists: 2016 likely to be hottest year on record despite looming La Niña
From basic rebuttal #49. UAH temperature chart showing the jump up in both El Niños (Pink lines) and La Niñas (Green lines) post 1997. Unfortunately our dear Skeptic Spencer has revised his chart which eliminates the actual trend seen in this previous version.

-
MA Rodger at 03:48 AM on 9 June 2016Most of the last 10,000 years were warmer
Mike Hillis @77.
As I demonstrated @70, your input onto this thread has been remarkable in its content. The one significant contention you had not eventually retracted prior to #70 was there challenged and you have thus far failed to present any meaningful response to that challenge.
I was generous @76 in conceding that your complaint did include pointing to an explanation within the OP that to my eyes "may not be strictly correct" but I do not @76 concede that that explanation is "wrong." If you still consider that it is "wrong" or "utterly wrong," you really should present reasons for considering it so and not resort to unsubstantiated assertions. That is what the SkS comments policy requires of you. "If you think our debunking of one of those myths is in error, you are welcome to discuss that on the relevant thread, provided you give substantial reasons for believing the debunking is in error." (My bold)
-
Mike Hillis at 02:20 AM on 9 June 2016Most of the last 10,000 years were warmer
Wrong and utterly wrong are the same thing. Remove it. And thank me for pointing out the error net time, instead of gish galloping.
Moderator Response:[RH] Please improve your tone of commenting. As pointed out before, neither Tom nor MA are gish-galloping. They're merely explaining the relevant science.
-
MA Rodger at 00:18 AM on 9 June 2016Most of the last 10,000 years were warmer
Mike Hillis @74.
You are claiming that "the OP claims that there is no isotope proxy after 1855 because of this reason (ie that "it takes decades for snow to consolidate into ice."), which is utterly wrong."
The OP does assert this reason but specifically saying "the first data point in the temperature series (is) from layers dated to 1855." Thus your "isotope proxy" must mean a 'temperature series' and we are specifically discussing such a series that is also δ18O-based. I contend there is no such temperature series presenting post-AD1855 data and challenged you @70 to show there was one.
You claim @74 to have already shown such a data series @58 above.
But do you not see the problem? That data presents GISP2 δ18O data. It is titled "GISP2 Oxygen Isotope Data." It does not present a temperature series.
The reason it is not GISP2 Temperature Series Data is because it is no simple job to convert that GISP2 δ18O data into temperature data. Calibration using borehole temperatures & gas analysis and the data smoothing used through the ice core would become highly problematic if somebody wished to make use of the δ18O data within the firn & snow layers.
And I cannot take seriously your suggestion that AD1855 is some form of limit of interest for a study of the Younger-Dryas event. Perhaps in Alley (2000) you can see some reference to data more recent than 10,000yBP. Myself, I cannot.
While the reason for the Alley (2004) data ending in AD1855 is not greatly significant to the error of Easterbrook addressed by the OP, the reason given for AD1855 being the end-date may not be strictly correct but it is in no way "utterly wrong."
-
denisaf at 15:16 PM on 8 June 2016Climate change and the value of daring
No doubt there will be many organisations that will do their utmost to encourage measures to cope with what is happening. Irreversible rapid climate change and ocean acidification and warming are largely the unintended consequences of using fosssil fules in industrialzation. Practical reduction in the rate of usage of these fuels can only slow this process down slightly. The main emphasis should be on adaption to such predicaments as sea level rise.
-
Mike Hillis at 14:12 PM on 8 June 2016Most of the last 10,000 years were warmer
If it's helpful, the core study at the University of Washington was started around 1997 when Kurt Cuffey was a grad student there, and completed in 1999 after he got his doctorate and went to Berkeley. Also, one of his professors at Penn State during his undergrad years was, guess who.
-
Mike Hillis at 13:01 PM on 8 June 2016Most of the last 10,000 years were warmer
MA Rodger said @70:
[Is it truly a "basic error with the OP" to state that "it takes decades for snow to consolidate into ice"? The OP statement quoted here is correct in itself. Further it does explain why Alley (2004) stopped his temperature reconstruction in 1855 which is a fundamental part of the post. I do not see here any "basic error."]
It's not an error to say it takes time to consolidate snow to ice, but it's misleading, because the snow does not need to consolidate to measure the 18O isotopes, and because this is long before the Argon/Nitrogen bubble study there is no reason to consider the entrapment of bubbles in the ice via consolidation. The OP claims that there is no isotope proxy after 1855 because of this reason, which is utterly wrong.
MA Rodger said @70:
[Perhaps a challenge should be set for Mike Hillis. Isotope data can be and is taken from snow and this data can be and is dated and added to ice core isotope data. But where is this data published authoritatively as a temperature series? Alley (2004) provides such a temperature series but only to 1855. Is there an ice core/snow temperature series that continues to a later date?]
I already gave a link to this data series in posts 58 and 59. Those measurements were done on the ice cores by the University of Washington, after they had been moved to the US (Alley et. al. made their measurements in a sheltered laboratory in Greenland.) I see Tom Curtis links to that study in @73.
Alley stopped his temperature data at 1855 in his paper on the Younger Dryas, not because that's the latest data he had, but more likely because he was writing about an event at the beginning of the Holocene and anything after 1855 was not relevant to the Younger Dryas. I'm sure that Alley had at his disposal, all the data after 1855, and I'm sure he also was aware of the 1999 University of Washington measurements on the same cores.
-
BBHY at 12:02 PM on 8 June 2016Scientists: 2016 likely to be hottest year on record despite looming La Niña
I think it is important to note that our "cool" La Nina years of the 21st century are still hotter than most of the hot El Nino years of the previous century., with the one exception being the monster El Nino of 1998. Just compare 2008 to all of the years of the 1900's.
That is the state of the climate in this century; a "cool" year in these times would have, not very long ago, been considered an extremely, outrageously hot year. Then our hot years are extermely, outrageously hot even beyond that.
-
Tom Curtis at 11:52 AM on 8 June 2016Most of the last 10,000 years were warmer
MA Rodger @72, I am guessing Alley and Koci (1990) is also not what you are after, as it reconstructs GISP 2 temperatures from measured temperatures in the bore hole. It is still informative:

I have added a line indicating 1855 for easy comparison, and it can be seen that 1855 is about 1.5 C cooler than modern temperatures. As Alley and Koci (1990) was referenced in Alley (2000b), it is further reason as to why Easterbrook should not have made his "mistake".
I have not been able to find dO18 based temperature reconstruction brought up to the late 20th century, but the dO18 values to 1987 are available online. I have used the temperature relationship specified in the University of Washington's annual dataset, along with the temperature relationship specified in Cuffey and Clow (1997), specifically T=(2.15 x dO18) + 43.4. I have compared the running decadal mean to that for the BEST Greenland data:
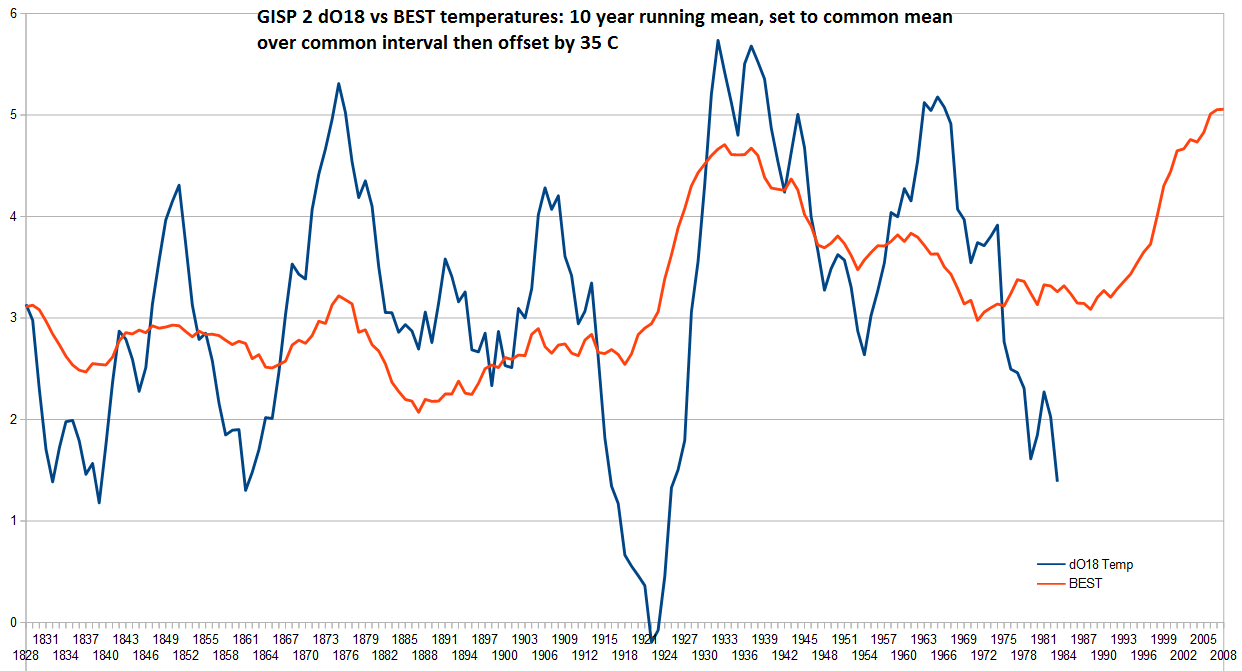
Just to be clear, the initial decade is 1823-1832. The final decade is 1978-1987 for the dO18 and 2003-2012 for BEST. The greater variability of the dO18 record is probably due to a combination of altitude changes, changes in the source moisture for preciptation, along with the fact that the record is from a single site. The temperature difference between 1850-1859 and 2003-2012 is 1.41 C on the BEST record, and is likely to have been similar in the dO18 record, had it been continued to the present. In any event, regardless of the method used (graviational defraction, borehole temperaures, dO18, or regional thermometers) the 1855 temperature is well below modern values.
-
MA Rodger at 04:05 AM on 8 June 2016Most of the last 10,000 years were warmer
Tom Curtis @71,
Kobashi et al (2011) wasn't actually what I had in mind (although it does fit the description I presented @70). The method of Kobashi et al. is to use nitrogen & argon isotope ratios in the air bubbles. So this does not fit with the Mike Hillis assertion that the oxygen isotopes from H2O in snow layers provide a temperature proxy that can be seemlessly affixed to the ice isotope data, that it is effectively the same data series.
Kobashi et al. (2009) describes the method they use for their most recent proxy data thus:-
"Our latest data for isotopes is 1950 C.E. as the air occlusion process is not completed for recent decades. For the period 1950-1993, the surface temperature is estimated heuristically by a forward model (Goujon et al. 2003) running various surface temperature scenarios to find the best fit with the borehole temperature record."
-
Tom Curtis at 23:02 PM on 7 June 2016Most of the last 10,000 years were warmer
MA Rodger @70: "Is there an ice core/snow temperature series that continues to a later date?"
Kobashi et al (2011), discussed here, is probably what you are looking for. There reconstruction spans the last 4000 years (2000 BCE to 2000 CE), but terminates in 1993:

They find that 74 of the 400 decades (18.5%) were as warm as, or warmer than the decade from 2001-2010. That means that not less than 31.6% of decades over the last 10,000 years were cooler than the 2001-2010 average.
-
MA Rodger at 21:53 PM on 7 June 2016Most of the last 10,000 years were warmer
I find it all quite amusing to see folk bashing on regardless of the trail of nonsense they leave behind them up-thread although it is rather cruel to let them continue without comment.
Mike Hillis @68.
You appear on this thread @52 with all guns blazing & accusations of "fabrication" because, you tell us, (A) Alley (2000) uses data that does not end in 1855 & (B) Alley (2000) does not use 1855 as any sort of "present" & (C) that you can get usable isotope measurements from firn & snow.
Yet @57 you roll back the (A) accusation on 1855 being the latest data used by Alley (2000) & (B) that 95ybp = 1855 but (C) insist the isotope data does exist for later years.
(Note this already provides what the Moderator Response was asking for @68.)
As this position didn't appear to constitute a "fabrication" any more, and "fabrication" being such a strong position, you were asked & did restate your position @63, but an entirely different one, a whole new ball game. (D) It is a fabriation to assert that Easterbrook & Mad Lord Monckton have perpetrated a lie about holocene temperatures being mainly warmer than today. (E) The bulk of the holocene was warmer than today, but you then present a graphic of holocene temperatures which amusingly shows the exact opposite.
Now @68 we find Easterbrook is pshawed so persumably we can consider (D) & (E) to be retracted but (C), unmentioned since your comment @60, is restated @68.
Is it truly a "basic error with the OP" to state that "it takes decades for snow to consolidate into ice"? The OP statement quoted here is correct in itself. Further it does explain why Alley (2004) stopped his temperature reconstruction in 1855 which is a fundamental part of the post. I do not see here any "basic error."
Perhaps a challenge should be set for Mike Hillis. Isotope data can be and is taken from snow and this data can be and is dated and added to ice core isotope data. But where is this data published authoritatively as a temperature series? Alley (2004) provides such a temperature series but only to 1855. Is there an ice core/snow temperature series that continues to a later date?
Moderator Response:[RH] Missed that. Moderation retracted @68.
(edit) At this point, it's unclear what Mike Hillis' complaint about the OP actually is. Perhaps he will endeavor to better clarify.
-
Tom Curtis at 14:19 PM on 7 June 2016A Rough Guide to the Jet Stream: what it is, how it works and how it is responding to enhanced Arctic warming
Nylo @86, you are correct, and obviously I did not think that through enough in my response.
As it happens, the greater temperature variability in the NH winter is not caused by the change in temperature gradient. Rather, it is caused by a large change in the position of the polar jet stream between summer and winter:

The more southerly polar jet stream in winter means the variability associated with its change of position moves further south and effects more territory. The contrast can be very stark in that air north of the polar front comes from the Arctic, while south of the polar front it comes from tropical and sub-tropical regions. What is more, as tropical temperatures show little seasonal variation, that means air from the south drawn north in the summer also shows little variation. In contrast, due to the low greenhouse effect at the poles, along with the fact that air temperature varies rapidly over the poles, there is a much larger seasonal contrast.
-
Tom Curtis at 13:41 PM on 7 June 2016Most of the last 10,000 years were warmer
Mike Hillis @68, a gish gallop is "...the fallacious debating tactic of drowning an opponent in such a torrent of small arguments that the opponent cannot possibly rebut each one in real time". Unlike you, who included five falsehoods or misrepresentations in just your first sentence @63, I discussed each point in detail, with evidence. Further, each of my points was a rebutal of just one of your falsehoods or misrepresentations. There is therefore, no doubt as to who employed a gish gallop in this discussion. Thoroughly rebutted, you are not even able to muster a tu quoque, but rely instead of the barstardized play ground version, "No, you are...".
If that is not enough, the key feature of a gish gallop is final point:
"And if even one argument in the Gish Gallop is untouched or insufficiently rebutted, the Galloper will claim victory — an abuse of the one single proof fallacy."
Again, you do not have the class to pull even that of. Instead your claim of victory relies on a claim you did not even make @63, but rather earlier in the discussion - and which was refuted earlier in the discussion in any event.
What you do not seem able to get through your thick head is that neither Alley (2000a) and (2000b), nor Cuffey and Clow (1997), rely solely on a dO18 paleothermometer. Among other things Cuffey and Clow rely on a correction based on changes in the sites altitude over time, the later being determined by included gas composition (as discussed above). Alley (2000a) and (2000b) also rely on the temperature dependent gravitational difraction of heavier gases as it diffuses through the firn as a secondary paleothermometer, to that obtained from Cuffey and Clow. As both of these additional thermometers rely on included gas, it is quite appropriate for Alley to extend his data no further than the closure of the firn, even though the dO18 extended to 1987.
Unless you explicitly address these points in any further response, I will regard your further responses as mere sloganeering (which, truth be told, is all you have contributed to date) and not bother responding.
-
Mike Hillis at 07:36 AM on 7 June 2016Most of the last 10,000 years were warmer
Tom, it is you who are guilty of gish galloping. None of your rapid-fire arguments changes the basic error with the OP that I pointed out, namely, the following quote from the OP:
"it takes decades for snow to consolidate into ice."
I pointed out that there is no need for snow to pack down into ice before the isotope temperature proxy can be measured, and in fact, it can be done with freshly fallen snow. You made a mistake when you made a comment about the air bubbles in the ice being a factor, and I showed how nobody measures the isotopes in the bubbles, but in the water itself, whether it be snow, firn, or ice. This basic error invalidates the comment I quoted in the OP, and in the interest in scientific accuracy, the OP needs to be edited and corrected on that point. This is no gisg gallop, this is one very valid point.
I find fault with Easterbrook for not showing the warming of the past century, though. It certainly does not pass the scientific accuracy test. Pshaw on him.
Moderator Response:[RH] In order for this conversation to move forward you first need to acknowledge that your original statement was incorrect where you say, "I read this thread and am shocked by what I'm reading. The data that Richard Alley uses does not end in 1855, nor does it use 1855 as any sort of 'present'."
The data being presented in the OP absolutely does end at 95 years before 1950, where 1950 represents "present." Thus, the data and graphs being discussed do end in 1855.
Moderation retracted
-
Nylo at 03:01 AM on 7 June 2016A Rough Guide to the Jet Stream: what it is, how it works and how it is responding to enhanced Arctic warming
Tom Curtis @85, if, like you say, the NH temperate zone winter temperatures show "by far greater variability" than summer temperatures, and this is a time when the equator to pole gradient is at its maximum, doesn't that suggest the opposite of what the article claims? Wouldn't a reduction of the gradient (making it closer to the summer one) bring a more stable climate in the NH temperate zone, like we have in summer?
The article postulates that lower gradient means more chaotic climate. For this to have any chance of being close to the truth, we would have to see way more chaotic climate in summer than in winter, given the big reduction in the gradient of temperature arctic-tropics between winter and summer. You seem to be saying that the opposite is true, i.e. that the chaotic weather happens more in winter.
-
Glenn Tamblyn at 23:57 PM on 6 June 2016How do we know CO2 is causing warming?
nodeniro.
Since WAG is probaly long since moved on - it was 7 years ago, perhaps you would like to open a conversation on a current issue? -
Glenn Tamblyn at 23:37 PM on 6 June 2016Donald Trump wants to build a wall – to save his golf course from global warming
Personally, I think that the sense of how much damage Trump could overtly do is over-stated. The government has a lot of formal checks.
But the informal checks available to the system to stymie a truly bad presient are enormous. 'Yes Mr President, we have the executive order, but SEAL TEAM 5 en-route to the target zone had to abort due to smoke in the cockpit (from some toilet paper they lit because I told them to)"If Trump tried to do many of the things he talks about, the phrase 'It's lonely at the top' may take on a whole new meaning.
Because at the end of the day, Trump isn't Putin. If Trump's behaviour suggested he was a cold-hearted, dead-fish scary bastard like Putin who also could work a crowd, then be very afraid. But he isn't Putin.
The Donald knows how to close the deal. He knows f@c&-All about what to do after that - as his business track-record shows.
The real threat Trump poses is what damage his paralysis, failure, and emotive ineptitude in office might cause.
His overt actions don't count - the intitutions of America, formal and informal are too strong for that.
But the incidental consequences of his floundering around. Oh My God.
Hilary Clinton may be struggling to match The Donald as a cheap carney salesmanperson. But she, and many others, will give him a master-class in how to use systems to rip someones heart out after he is in office. Parts of the Republican machine know how to do this. The Donald is ignoring them. -
erich at 16:26 PM on 6 June 2016In-depth: Experts assess the feasibility of ‘negative emissions’
Soil Biology is our only way to rapidly and massively draw down CO2 from the air to offset our ongoing and past carbon emissions, It Can safely and naturally restore the hydrological cycles by increasing biogenic aerosols and cloud albedo that can readily cool the planet by the 3 watts/m2 needed to offset the now locked in greenhouse warming effects and avoid the Storms of Our Grandchildren.
The French have lead the way recognizing Soil Carbons' value and committing to build Soil Carbon by 0.40% annually. Putting them on the road to Carbon Negativity before any industrialized country. 25 nations have signed on to 4p1000. 100 of the 196 countries in Paris submitted plans to reduce CO2 via agriculture, forestry and replacing soil carbon into their programmes.
http://4p1000.org/understandA combination of Best Management Practices, (BMPs), for Agriculture, Grazing & Forestry with bioenergy systems which build soil carbon can deliver the giga-tons of carbon necessary into the soil sink bank.
Ag BMPs; 1 GtC, New Forest & BMPs; 1 GtC
Pyrolitic Bioenergy, Cooking Stoves; nearly 1/2 GtC
Industrial Pyrolitic Bioenergy; 2 GtC
Holistic Grazing; 2+ GtCOver 6 GtC,
So soils & biota can do more than half the 10 GtC reduction job, feeding carbon to life instead of death.Carbon Sequestration Cascade;
Each Black Carbon gram (biochar & humus) can increase Water Retention by 8 grams, and can support 10 grams of Green Carbon, which each can feed up to 10 more grams of fungal mycelium White Carbon growthCarbon has been fundamental to life since the birth of our planet. It’s the source of all wealth and the conduit of all joy. Carbon cycles among and between billions of interconnected earthlings, whose fates teeter on the element’s return trip to the soil. Only the generous reciprocity inherent to life macrocycles can restore abundance and harmony to the planet of the living. May we celebrate a happy Intended Anthropocene, anointed in water & Soil rather than Oil and Blood.
Soil-C Farming of Oz
"The Cat's Cradle"
Improving Agricultural Productivity and Economic Viability through Improved Understanding of Natural Systems
http://biochar.us.com/584/cats-cradleClean Biomass cooking is no small thing.
The World Bank Study;
Biochar Systems for Smallholders in Developing Countries:
Leveraging Current Knowledge and Exploring Future Potential for Climate-Smart Agriculture
http://fb.me/38njVu2qz -
Haze at 15:23 PM on 6 June 2016Donald Trump wants to build a wall – to save his golf course from global warming
KR @25 Fair enough but if I did that someone could and likely would, accuse me of selective editing. I agree there is a lot there but although it is not climate change orientated it does believable commentary on what is driving many US voters into the arms of a man who is no friend of those who are supporters of action to address climate change.
-
KR at 12:55 PM on 6 June 2016Donald Trump wants to build a wall – to save his golf course from global warming
Haze - You might consider highlighting the important points you see in such articles, rather than block copying entire articles without any interpretation. TL;DR.
Yes, there is considerable dissatisfaction with current US politics; the current Legislature is gridlocked, the Tea Party represents the worst of manufactured movements intended to prevent legislation, and the amount of money going into elections is by itself a corrupting influence. But that doesn't change the fact that the common elementins Trump supporters are liking simplistic authoritarian statements promising no change, with woe to those who disagree.
-
Haze at 11:37 AM on 6 June 2016Donald Trump wants to build a wall – to save his golf course from global warming
My apologies. I have just read a piece in yesterday's Australian Financial Review (paywalled) by T J Pempel Professor of Political Science at University of California Berkeley. In this piece, writtten for an audience in Asia' He does address the question for which I have been trying to elicit answers.
He commences "Virtually every Asian academic, business leader, policymaker or taxi driver I have encountered in the past six months has, within minutes, pummelled me for answers to the Trump question.
They are flabbergasted that a man so bereft of political experience, foreign policy know-how and macroeconomic basics, who radiates disdain for foreigners, women and the disabled, has come to dominate the American political dialogue. Bemused befuddlement at a self-aggrandising buffoon has given way to ripening anxiety that he may well become the next occupant of the Oval Office, unleashing disastrous consequences for economic and security relations across the Asia-Pacific.
There are four points that Asians must understand about the Trump phenomenon."
"First Driving American voters today is a toxic cocktail of anger at what appears to be a rigged economic system serviced by a self-serving political class. Fraudulent financiers crashed the economy in 2008 but got huge bonuses instead of jail cells. Corporations and top executives offshored the manufacturing jobs that once provided stable middle-class lifestyles for swaths of the American public. The social safety net is frayed, infrastructure is collapsing and costly education provides little guarantee of upward mobility. Meanwhile, Washington politicians serve wealthy donors while the government spends trillions of dollars on losing wars in Afghanistan, Syria and Iraq."
"Second, Trump is the logical consequence of decades of Republican Party actions. Richard Nixon's "Southern strategy" drew in white voters upset about programs that enhanced minority electoral and social power or challenged the views of evangelical Christians. Since then, the Republican Party has gained voter support by promising to reverse what many see as the erosion of traditional American values."
"The third point is that Trump could win. America's punditry has not been short of predictions about how the Trump campaign is certain to go down in flames. The Republican establishment is split. The party's support level has plummeted. The Democratic Party has a built-in Electoral College advantage that will be bolstered by bipartisan waves of voters appalled at the prospect of a Trump presidency. Such claims certainly make a powerful case for Trump's defeat.
Yet the pundits now predicting a Trump thumping are the same ones who argued that he could not get more than 10 per cent of the Republican primary vote, that the Republican establishment would not "allow" a Trump nomination or that media exposition of his inconsistencies would doom his candidacy. All such predictions have proven hollow."
"Finally, a Trump presidency would be catastrophic for Asia. His campaign is bereft of foreign policy expertise and numerous experienced Republican operatives have declared their unabashed opposition to him. Would some of them join a Trump administration? Quite possibly, but hardly in the numbers needed to offset Trump's "America first" prioritisation.
Economic relationships from regional trade pacts to multilateral institutions are likely to become fodder for Trump's self-proclaimed expertise as a deal maker. So too are decades-long alliances, America's longstanding commitment to nuclear non-proliferation, its nuanced efforts to balance engagement with hedging in China policy and the determination to balance US military muscularity with diplomatic sensitivity"
The author does not cmment on Climate Change
Prev 470 471 472 473 474 475 476 477 478 479 480 481 482 483 484 485 Next


