


 Arguments


Recent Comments
Prev 629 630 631 632 633 634 635 636 637 638 639 640 641 642 643 644 Next
Comments 31801 to 31850:
-
Tom Curtis at 13:10 PM on 15 January 2015CO2 lags temperature
 :
:And here is the CO2 reconstruction we should be using:

The immediate thing to notice is that the CO2 rises by 20 ppmv from 260 ppmv, leading to an expected temperature increase of 0.3 C. Instead we get a temperature decrease of about the same amount. Why?
Well, here is the temperatures over the last 800,000 years:

You will notice that after each large peak, the temperatures plummet rapidly, as we would expect with the rapidly declining NH summer insolation (which drives the timing of glacials). There is one exception, that doesn't fall rapidly, that that is the last 10 thousand years.
It is a natural supposition that the rise in CO2 levels (itself something we would not expect naturally) has counteracted the natural fall in temperatures we would expect from the declining NH summer insolation and greatly reduced the natural decline in temperatures.
-
chriskoz at 13:08 PM on 15 January 2015The Antarctic ice sheet is a sleeping giant, beginning to stir
michael sweet,
Your question about gravitational rebound (+centrifugal forces of Earth rotation) on regional SLR from Greenland IS was answered by Jerry Mitrovica here. In the embeded video, from 16:00 on, Jerry explains the results of his simulation of 1m SLRe instantanous GIS melt.
As you can see on the picture, SL would fall (effect negative) in Scotland, Scandinavia and Labrador while SL would be up to 1.2m (120%) around SAtlantic (SAmerica) and Equatorial-Northern Pacific.
In US (your particular interest) the effect ranges widely on E coast (from ~50% in NY to some 80% in Miami. On the W coast the effect seems to be uniform 100%.
-
scaddenp at 12:45 PM on 15 January 2015CO2 lags temperature
Well anything from climate4you is likely.misinformation. This is discussed here and here.
You might like to put "humlum" into the search box to see other stuff.
-
dvaytw at 12:38 PM on 15 January 2015Examining Dr. John Christy's Global Warming Skepticism
Thanks for understanding my mangled sentence there, guys. Glad to have the jump on the talking point for a change.
-
dvaytw at 12:30 PM on 15 January 2015CO2 lags temperature
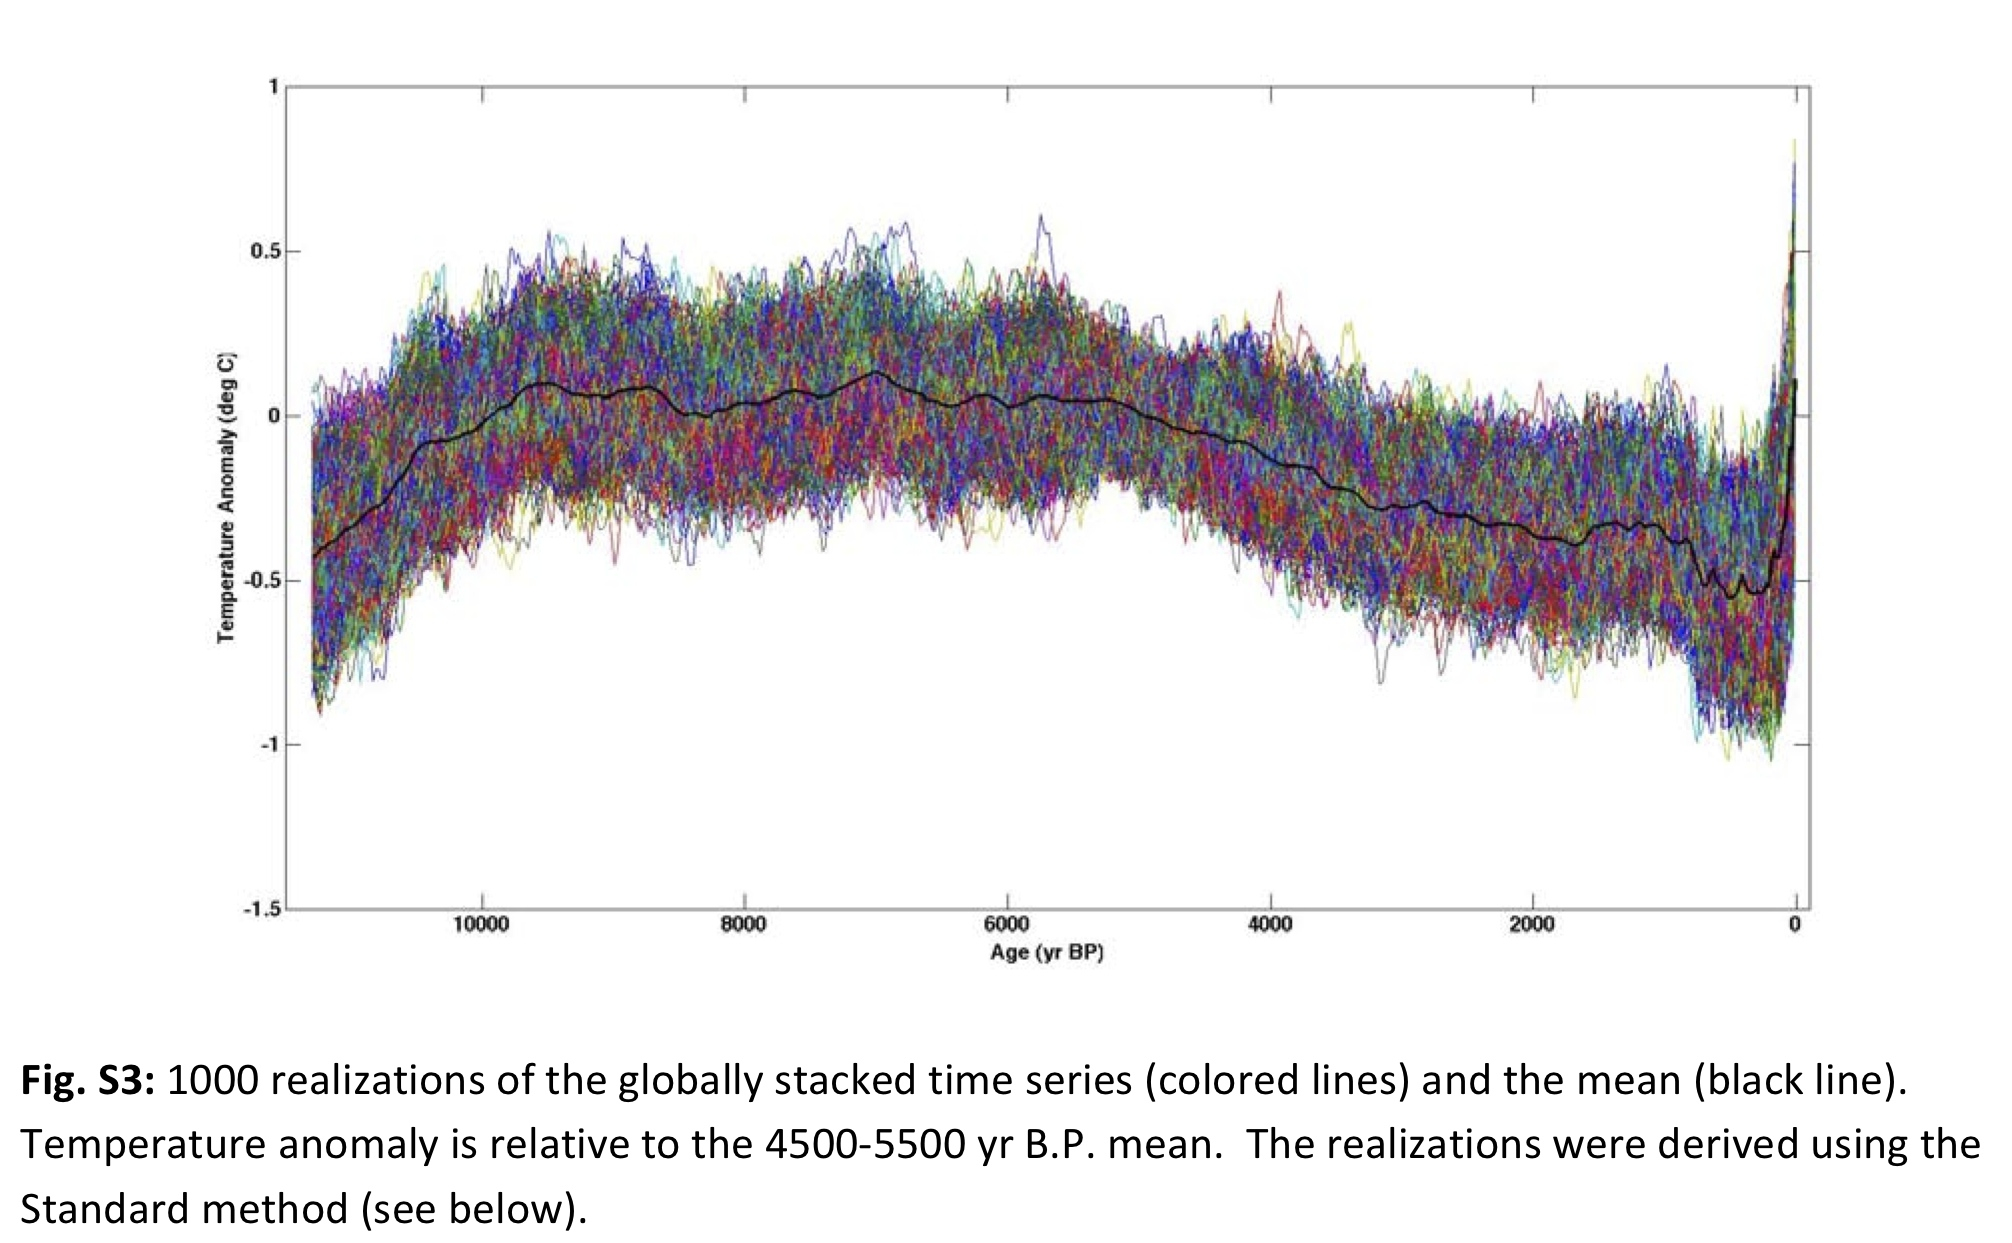
This one is isn't specifically related to "lags temperature", but it's another "CO2 / temperature - no correlation" graph, ostensibly from Doctor Richard Alley, showing the past 11,000 years from Greenhouse ice core data.
My knowledge-free guess" effects from the sun are in the driver's seat here... am I somewhat right on that? The "discussion" as it were is happening here:
How to Talk to a Climate Change Denier
Moderator Response:[RH] shortened link.
-
Jim Eager at 11:49 AM on 15 January 2015Climate Deniers Employ Predatory Tactics in Fight Against Facts: Scientist
William, this is way past petty and tiresome. Just suck it up and stay on topic.
-
Mike Hillis at 10:11 AM on 15 January 2015CO2 effect is saturated
I think what Digby fails to realize is that the radiation along the side wings of the CO2 band do come from the troposphere, yet are radiated and/or absorbed by CO2. If you study Toms graph in post 376, you see that along the sides of the CO2 band, around 650/cm and on the other side at around 750/cm., the radiation matches up with 240 K or even 250 K, which correspond with temperatures in the troposphere. Adding CO2 to the atmosphere would push those jagged edges downward on the graph and closer to 220K, which is colder.
Digby is partially correct by saying the bulk of the CO2 band radiates from 220 K which is the lower stratosphere, which does not get colder with altitude, and he is also corect that the bulk of the radiation from the troposhere is well outside the region of the spectrum which is affected by CO2, but he fails to note that the wings of the CO2 band would be pushed slightly downward on the graph, and into colder regions on the graph (because, in the real world outside the graph, radiation of those 650 and 750 wave numbers would have to travel higher up in the atmosphere to get around all the extra CO2 molecules).
-
Tom Curtis at 09:08 AM on 15 January 2015Climate Deniers Employ Predatory Tactics in Fight Against Facts: Scientist
Rob Honeycutt @46, for a very long time before I seriously studied at university, I took "sic" from context to mean roughly "look how superior I am". I think in most usage it still has that implication. In fact, with the exception of pointing out original typos, which as you point out is neither necessary nor desirable, "sic" is entirely redundant for any word within quotation marks - unless, of course, the quoter is pointing out that they are in the habit of misquotation, but this time restrained themselves.
-
Rob Honeycutt at 08:57 AM on 15 January 2015Climate Deniers Employ Predatory Tactics in Fight Against Facts: Scientist
William... One quick nuance of written style that you may not be aware of: The use of "(sic)" normally is not used to correct typos. It's used where confusion might come into play for the reader. It's to indicate that it is reproduced as written. Simple typos (according to the AP style guide, if I remember correctly) can be merely corrected without reference or indication. In fact, it's considered polite to do so.
-
JohnMashey at 08:43 AM on 15 January 2015Just when did humans first start affecting the climate?
shoyemore: yes, P, P & P is cheaper and people will get the idea, but the new book is more than a supplement, as a lot of research has happened over the last decade, and I think many issues have been resolved pretty well. People might also try Bill's Tyndall Lecture @ AGU2013
https://www.youtube.com/watch?v=1TOTsmqgmL8
-
Tom Curtis at 06:36 AM on 15 January 2015Climate Deniers Employ Predatory Tactics in Fight Against Facts: Scientist
william @44, if you read that you probably also read the related discussion that pointed out that moderation complaints are always off topic and therefore prohibited by the comments policy. Further, it has been standard practise that moderation complaints have been prohibited at SkS for as long as I have been reading the site. If I remember correctly, that was explicitly stated in the original comments policy and the failure to explicitly state it in the updated comments policy is simply an oversight. It think that oversight should be quickly corrected but whether it is or not has no bearing on whether or not the long standing practise of moderation on this site prohibits moderation complaints.
Moderator Response:[JH] Thank you.
-
michael sweet at 06:06 AM on 15 January 2015The Antarctic ice sheet is a sleeping giant, beginning to stir
After reading the paper I read this reference which estimates the sea level rise in the USA as about 1.3 times the global average from melting in the WAIS. Affects from Greenland are also not uniform and might be lower in the USA since Greenland is close to the USA.
-
william11409 at 05:19 AM on 15 January 2015Climate Deniers Employ Predatory Tactics in Fight Against Facts: Scientist
JH at 43. I seem to recall you made this point "BTW, moderation complaints are prohibited by the SkS Comments Policy. Therefore, you are now skating on a new area of thn (sic) ice". to some one else and later admitted at that time no such prohibition exists. As a consequence I read the policy and also cannot find the prohibition to which you refer. Clearly I must be mistaken as no doubt that prohibition is now in place will you assist?
Moderator Response:[JH] See Tom Curtis's response to your querry. He saw your post before I did.
-
Jim Eager at 05:16 AM on 15 January 2015The Antarctic ice sheet is a sleeping giant, beginning to stir
Wili, from the paper (free download):
"The time to reach this collapsed state is 200 to 500 years. This may be further accelerated if calving-face instability is a factor in the retreat. "
However, it is my understanding that once the calving face recedes back behind the grounding line and over the retrograde bedrock slope beyond, thus exposing the underside of the ice sheet to intrusion by the sea, then complete collapse will be inevitable, as it would take a reduction in global mean temperature well below pre-industrial level to halt it.
-
michael sweet at 05:01 AM on 15 January 2015The Antarctic ice sheet is a sleeping giant, beginning to stir
Dr. Abraham,
Thank you for your update on this interesting topic. This is the first I have heard that the uneven distribution of melt water may be significant to planning.
If there was say 1 meter of sea level rise globally from melting in the great ice sheets, approximately how much extra might there be in the Northern Hemisphere? 5 cm? 10 cm? 25cm? Obviously it depends on a lot of factors but can you suggest a ballpark figure. Can you suggest a paper I could read that reviews this topic?
-
MA Rodger at 04:23 AM on 15 January 2015Examining Dr. John Christy's Global Warming Skepticism
Christy also cherry-picks the period 2002-2014 for his trend analysis. Any start date 1999-2006 yields a higher central figure. They only deceipt Christy managed to resist is rounding the trend (0.047ºC/decade) down and more correctly rounds it properly up to a "rate of 0.05 degrees Celsius per decade."
-
ubrew12 at 03:30 AM on 15 January 2015The Antarctic ice sheet is a sleeping giant, beginning to stir
wili@1: I don't envy the problem glaciologists have before them. As I point out to people, the reason communities set explosives to cause avalanches in the Spring in the Alps and Rockies is not because the resulting avalanche will do less damage, but simply because it gives them the chance to predict when the avalanche will occur, so they can warn people. Otherwise they pretty much have no idea. A similar problem awaits those trying to predict the kinetics of ice flow at the WAIS and in Greenland.
-
wili at 02:14 AM on 15 January 2015The Antarctic ice sheet is a sleeping giant, beginning to stir
"no further acceleration of climate change and only modest extrapolations of the current increasing mass loss rate are necessary for the system to eventually collapse ... resulting in 1-3 m of sea-level rise"
Wow. Is that eventually, or in this century. I note that the original paper's abstract includes the point: "sea-level rise above the ∼1 m expected by 2100 is possible if ice sheet response begins to exceed present rates"
And is there ANY chance that the ice sheet response will NOT exceed present rates? Isn't it CERTAIN to accelerate?
-
howardlee at 02:04 AM on 15 January 2015Just when did humans first start affecting the climate?
Joel - I stand corrected! Thanks for pointing that out.
-
Joel_Huberman at 01:43 AM on 15 January 2015Just when did humans first start affecting the climate?
This is a fascinating essay. Thanks! I have one correction to make, however. The sentence, "That methane is gradually oxidized to CO2 at rates of about 540 million tonnes per year", is misleading. The rate of methane oxidation is proportional to the concentration of methane and is best expressed in terms of methane molecular half-life in the atmosphere (about 12 years, I believe) rather than in tonnes of atmospheric methane oxidized per year. The figure you quote comes from a discussion of current atmospheric methane levels, which are more than twice those shown in the ice core measurements for the current interglacial (third figure in the essay). Consequently, the figure you quote is probably more than twice the rate at which methane oxidation was occurring during the pre-industrial era.
-
Tom Curtis at 00:46 AM on 15 January 2015Examining Dr. John Christy's Global Warming Skepticism
dvaytw @96, interesting link.
It tells me that NewsMax (which I had never heard of before) is an unabashed propoganda site. Quoting Monckton, and using his propaganda terms ("the great pause") as though they were a common term among scientists (as opposed to never having been used by scientists, SFAIK) makes that clear. It also manages to suggest that a measurement of the average across the lower tropopheric temperatures (sort of) refutes the results of surface measurements - as though humans actually live floating two or three kilometers in the air rather than with their feet firmly on the ground.
Roy Spencer's blog post is better, both because it avoids the propaganda excesses of the NewsMax piece, and because it is clear that they are talking about the Satellite record only (although they do not bother to clariffy what that means). It remains disappointing, however, for it fails to mention the ovious fact that lower tropospheric temperatures are far more strongly influenced by ENSO than are surface temperatures. Therefore it is not surprising that while the ENSO neutral 2014 topped the El Nino influenced 1998 and 2010 in the surface record, it did not do so in the sattelite record. Disappointingly it trys to suggest an El Nino influence on the 2014 temperatures due to ENSO features durring December, entirely failing to mention the 6 month lag between ENSO events and their peak temperature influence.
Finally, Christy and Spencer make a big point about the close values of 2014 with 2005 (4th warmest) and 2013 (5th warmest). The clearly mention that there is only a 0.01 C difference between 2005 and 2014, and a 0.02 C difference between 2013 and 2014. The odd thing is that on their own figures, the later is actually a 0.03 C difference. Worse, the actual annual mean for 2014 using their monthly figures is 0.275, which should have been rounded up, not down as they do. The actual differences, rounded to three significant figures are 0.013 C for 2005, and 0.039 C for 2013. Via a non-standard rounding and a simple reporting error, they have virtually halved the reported difference between 2013 and 2014. I suspect that as a result, 2014 is statistically warmer than 2013. Unfortunately I do not know their stated measurement error.
Moderator Response:[JH] NewsMax is the Fox News of wire service jounalism.
-
dvaytw at 20:46 PM on 14 January 2015Examining Dr. John Christy's Global Warming Skepticism
Surprise surprise, Christy is saying bucking the trend on 2014 as the warmest year:
-
MA Rodger at 20:32 PM on 14 January 2015It's not us
Further to #80.
There is no Figure 9 in the Trenberth et al (2009) as linked in the advanced level rebuttal. There is a Figure 9 in Treberth et al (2013) "Earth's Energy Imbalance." This figure (presently eluding me on line) plots but a wiggly line 2000-to date showing incoming, outgoing and net radiation, this last compared with El Nino. So the important bit of that Figure 9 is the net value as per the graph below (as shown at the SkS post that this discussion initially began) but with a more recent wobble added on to the end of the trace.
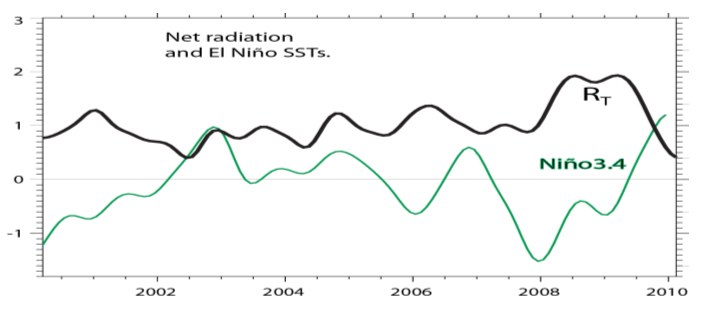
Sadly dvaytw, there is no "clincher" here as the data only starts in 2000. (Mind, OHC does a good job of clinching the "AGW has paused" delusion.)
Which brings me to a follow-on. If the Hansen Figure 1C uses OHC to 'create' a graph 1880-date as could be interpreted from the advanced level post, is that any more strange than Trenberth using satellite data to 'create' such a graph - both are achronistical. Of course Hansen et al uses land temperature for the earliest part of his analysis and adds in SST there after (as the caption says). Trenberth et al (2013) presents a similar graph 1850-to-date (their Figure 1) and both papers then compare these results with OHC data.
-
chriskoz at 20:01 PM on 14 January 20152015 SkS Weekly News Roundup #3A
Ralph Keeling could have been more precise about 400 milestone on his curve (inherited from Charles). Notably, that the mean value (running average - second last column on this data) is just about to reach 400 (between Jan & Feb 2015). So, we can now officially say that MaunaLoa has breached 400, biosphere breathing cycles not withstanding.
It follows that at least next 1/2y (until and including July 2015) will be above 400. Aug 2015 may yet drop below 400 as the last august in history. With the d-ppm rate of 2.1/y, we will witness Sept 2016 being the last month at or just a fraction below 400 (see this picture). Thereafter, 399.99 number is just a history never to return (for us, mortals). So, if you visit Hawai this or next northern winter, you still have a chance to get an ampule of "pre-Anthropocene air" (they are likely to define 400 limit as symbolic separation of Anthropocene from past Holocene), it's going to have big collector's value.
Ralph of course knows those numbers and trends better than I do.
-
dvaytw at 18:16 PM on 14 January 2015It's not us
I scanned to find a remark on this issue in the comments, but so far haven't seen any. Unless I'm mis-reading something, in the advanced version of this article, the graph labeled thus:
"Figure 9: TOA Radiation (Trenberth 2009)"
Should actually be:
"Figure 1c from Hansen et al (2005) "Earth’s Energy Imbalance: Confirmation and Implications".
The caption for Figure 1 in that paper runs as follows:-
Fig. 1. (A) Forcings used to drive global climate simulations. (B) Simulated and observed temperature change. Before 1900, the observed curve is based on observations at meteorological stations and the model is sampled at the same points, whereas after 1900 the observations include sea surface temperatures for the ocean area, and the model is the true global mean. (C) Net radiation at the top of the atmosphere in the climate simulations. Five climate simulations are carried out that differ only in initial conditions.
This information was provided to me by MA Rodger in another thread.
-
dvaytw at 17:44 PM on 14 January 2015Trenberth on Tracking Earth’s energy: A key to climate variability and change
MA Rodger, thanks. But it seems there's some mis-labeling (or else mis-reading on my part) in "The Human Fingerprint in Global Warming", then, as that graph is labeled:
"Figure 9: TOA Radiation (Trenberth 2009)"
I also wonder if there is a nice graph for the satellite data from the top of the atmosphere. This point (satellite confirmation of heat accumulation) has always seemed like a clincher to me because it clearly belies the "pause" talking-point in a way that all the nuanced responses about oceans and aerosols and volcanic eruptions and inadequate temperature arrays doesn't. For that reason, a nice visual would be nice in underscoring it, but I can't find anything but charts incomprehensible to the climate-challenged such as myself in Trenberth 2009.
-
wili at 10:58 AM on 14 January 2015Just when did humans first start affecting the climate?
"about 37 billion tons of carbon was captured and sequestered from the atmosphere at that time"
Isn't that about what we emitted last year...in one year?
-
wili at 09:28 AM on 14 January 2015Just when did humans first start affecting the climate?
Well, we've learned one thing: How to kill a vibrant planet in just a few decades.
-
scaddenp at 08:12 AM on 14 January 2015Climate Deniers Employ Predatory Tactics in Fight Against Facts: Scientist
William, I would note that your understanding of the rights to Free speech and what would constitute a violation seem a little exagerratedbut XKCD says it best.
Are you still claiming Drapela and Carter (for example) misinformation is "putting it out for discussion"?
Got examples of deniers expressing their arguments to fellow climate scientists at a conference?
-
Tom Curtis at 06:24 AM on 14 January 2015It's the sun
TonyMo @1093 says:
"The key to the truth is a characteristic of the temperature graph, which can be seen in any temperature record from around the world, and that is the falling temperature from the late 40’s to the early 80’s, which, according to the IPCC, was due to post WW” industrial pollution pumping tons of aerosols into the atmosphere, probably augmented by the hundreds of atmospheric tests of nuclear devices carried out during the same period."
(My emphasis)
Really? Any temperature record at all?

The Australian temperature seems to have risen more or less continuously since the 1930s. Perhaps we use a different sun donw under?
Indeed, speaking of "down under" more generally, ie, the Southern Hemisphere, it is interesting to compare the running thirty year trends of temperature with the running 30 year trends of TSI (normalized to show the same overal variance):

The year shown is the start year of each thirty year trend. From that we can see that while the trend was just negative in the years 1937 to 1939, from 1940 it goes positive and rises sharply to a peak prior to 1970. It does not show the pattern TonyMo claims at all.
It is even more informative to compare the temperature trends with the TSI trends. They in fact show almost no correlations (R squared = 0.027), both because of the timing of change in overall trends differ and because of the residual solar cycle (due to using a 30 year rather than a 33 year mean). That of course raises the question as to why is the temperature response to much larger variation in the solar cycle so small when the variations in mean TSI is supposed to have driven the large temperature increase over the twentieth century.
Of course, one of the interesting things about using the SH is that aerosol pollution has a regionaly effect, and is primarilly produced in the NH. That is, SH temperature variation has a relatively reduced impact from sulfates compared to the NH.
In summary, the data cleary refutes TonyMo's claims, both in detail and as to his general conclusions. It only remains to see if he has the integrity to admit that, and to admit that the Sun is not a major driver of twentieth century temperature changes.
-
shoyemore at 05:38 AM on 14 January 2015Just when did humans first start affecting the climate?
Plows, Plagues and Petroleum by William Ruddiman is an earlier version of his work, and it is worth searching for some of his Scientific American articles (at least one!) on Google.
I am sure the above book supplants his earlier work, but it is still pricey, and P, P & P is available on Kindle.
-
MA Rodger at 02:26 AM on 14 January 2015Trenberth on Tracking Earth’s energy: A key to climate variability and change
dvaytw @268.
You present Figure 1c from Hansen et al (2005) "Earth’s Energy Imbalance: Confirmation and Implications". (Trenberth did not co-author.) The caption for Figure 1 in that paper runs as follows:-
Fig. 1. (A) Forcings used to drive global climate simulations. (B) Simulated and observed temperature change. Before 1900, the observed curve is based on observations at meteorological stations and the model is sampled at the same points, whereas after 1900 the observations include sea surface temperatures for the ocean area, and the model is the true global mean. (C) Net radiation at the top of the atmosphere in the climate simulations. Five climate simulations are carried out that differ only in initial conditions.
-
dvaytw at 01:18 AM on 14 January 2015Trenberth on Tracking Earth’s energy: A key to climate variability and change
Can anyone briefly explain to me how Trenberth's graph goes back to the late 19th century, if he's using satellite measurements from the TOA that have only been taken in recent decades:

-
Ochiudo at 01:03 AM on 14 January 2015The Debunking Handbook: now freely available for download
Great resource! It's a pity that it's only available in PDF format, an .epub or .mobi version would be greatly appreciated!
-
billthefrog at 23:04 PM on 13 January 2015Corrosive Seawater, Not Low pH, Implicated As Cause of Oyster Deaths
Rob,
In your moderator response to Stephen Baines and Doug Mackie (#37) on the recent pHraud thread, you wrote a comment (dated 11th Jan) stating that
" ... you (and Stephen) make a good point that either manner of calcification is impeded by the decline in carbonate ion abundance. Still, it gives me a opportunity to write about coral calcification & OA."
So the obvious question is "what the hell took you so long?" ;)
More seriously, in your "before and after" photo in Fig 1, would I be correct in thinking that the "after" exhibit is possessed of the characteristic reduced C13 ratio associated with a biogenic carbon burp?
Cheers Bill F
-
Ger at 20:51 PM on 13 January 2015Not pHraud but pHoolishness
@18, The trick of Chemistry is called entropy. Which reaction will occur depends on the entropy of the mixture, its temperature but will always strive to get S>0.
Would that help as an answer why some reactions are "preferred" over others?
-
Nick Stokes at 17:22 PM on 13 January 2015Corrosive Seawater, Not Low pH, Implicated As Cause of Oyster Deaths
I see I didn't use the right method for links. The acidification calculator is here
-
Nick Stokes at 17:15 PM on 13 January 2015Corrosive Seawater, Not Low pH, Implicated As Cause of Oyster Deaths
I don't think the headline here helps. The sea-water isn't corrosive, it just has reduced carbonate, which makes it harder to gain and hold solid CaCO3. But the paper seems to attack strawmen. I don't think anyone thought pH or CO2 were the direct agents. But in normal seawater, both are directly linked to carbonate. There are just two dof in the equilibrium. One thing that remains fixed as CO2 is added is total alkalinity, and so adding CO2 necessarily reduces pH and CO2.
You might be able to separate the link by varying TA artificially, but I can't see the point.
There is a gadget to demonstrate the linkage here.
Moderator Response:(Rob P) - As the Barton et al (2012) paper linked to in the blog post states:
"We report results from an oyster hatchery on the Oregon coast, where intake waters experienced variable carbonate chemistry (aragonite saturation state , 0.8 to . 3.2; pH , 7.6 to . 8.2) in the early summer of 2009."
So the hatcheries were, at times, taking in seawater that was undersaturated with respect to aragonite and therefore physically corrosive to the larval oyster. The changing seawater chemistry would likely have had detrimental effects on the oyster larvae well before the water became corrosive to them.
I don't understand your claim about the paper attacking strawmen. The only way to disentangle the physical mechanisms through which marine calcification is affected by ocean acidification is to conduct experiments to elucidate these details. Relying on general, untested, assumptions isn't science.
-
william11409 at 16:31 PM on 13 January 2015Climate Deniers Employ Predatory Tactics in Fight Against Facts: Scientist
billthefrog. Unfortunately I may well be banned if I reply to your comment as you can see from the Moderator's conmment at 40. I'm not sure why my replying to comments is viewed as "skating on thin ice for stating my position multiple times" as my replies necessitate a re-statement of what I said previously. I would however point out to you that I gave a reference to the BBC in my reply at 32.
Moderator Response:[JH] This discussion has been exhausted and exhausting for everyone particpating in it. Please move on.
BTW, moderation complaints are prohibited by the SkS Comments Policy. Therefore, you are now skating on a new area of thn ice.
-
billthefrog at 10:31 AM on 13 January 2015Climate Deniers Employ Predatory Tactics in Fight Against Facts: Scientist
@ William
The Telegraph blog by Brendan O’Neill that you linked in #24 appears to be little more than a blatant attempt at misdirection. Should anyone care to look, the Green Party has Climate Change located very prominently in their Values Statement. (Near the top RHS of the linked page, if it isn't prominent enough for some. ;))
As action on Climate Change is so central to their core values, someone reporting the fact that, given the opportunity, the Greens would wish to remove obstacles to this agenda is tantamount to making a statement of the bleedin' obvious. In fact, it would have been seriously noteworthy if the Green Party did NOT have a statement to this effect. (The clue, afterall, is in the name of the party!)
In his blog, O'Neill correctly states that this understandable wish to remove Climate Change deniers from positions of influence in Government is contained within the Green's 10 point flood response action plan. For whatever reason, O'Neill chooses to characterise this as follows..." at the very top of the plan is the proposal that all senior advisers who do not accept the “findings of climate scientists” should be ditched, thrown out of office, expelled from public life effectively. "
Some people (no names, no pack drill) will obviously accept anything they read in a blog such as O'Neill's as Holy Scripture, just as long as it agrees with their own prejudices. However, as anyone prepared to exercise a modicum of genuine scepticism can easily see (here), the statement of intent to remove deniers from positions wherein they can block progress is actually number 3 on the 10 point list - not "at the very top". Leaving aside O'Neill's hollow rhetoric, unless the numbering in the action plan has recently been revised, it would appear that he finds counting all the way to 3 somewhat challenging. (Point number 9 is also worth looking at, as it is in a similar vein.)
With an unwitting irony that will be apparent to many SkS readers, O'Neill proceeds to make comparisons with McCarthyism. Considering that Michael Mann is central to the OP (and is mentioned by name no fewer than 4 times in William's comments) this presents a serendipitous symmetry. Whilst he was still Attorney General in Virginia, Ken Cuccinelli attracted just such a comparison with his politically motivated witch hunt of Michael Mann.
Perhaps William may care to share his views on Cuccinelli's tactics viz-a-viz Mann's period at the University of Virginia? -
DSL at 07:35 AM on 13 January 2015Things I thought were obvious!
Indeed, if you're willing to ask a question like that, then you should ask, "How many people are alive today as a result of the development of a fossil energy-based economy, an economy that is inherently unsustainable?"
Moderator Response:[PS] fixed text
-
DSL at 07:33 AM on 13 January 2015Things I thought were obvious!
Adrian, probably a tiny fraction of the amount of food that is wasted by middle class culture that has blossomed as a result of the cheap, widely-available, and heavily-subsidized emergence of fossil energy.
-
adrian smits at 06:54 AM on 13 January 2015Things I thought were obvious!
I wonder how many people on earth are alive today because of the extra carbon dioxide in the air causing increases in crop yeilds and thereby less famine?
Moderator Response:[JH] Please cite the source of your sweeping claim that extra carbon dioxide in the air has caused increases in crop yield and thereby less famine.
[PS] And any further discussion of this claim should be done on the "CO2 is plant food" myth article
-
John Hartz at 06:54 AM on 13 January 2015Climate Deniers Employ Predatory Tactics in Fight Against Facts: Scientist
Moderator's Comment
William:
You have stated your points multiple times on this comment thread. You are therefore skating on the thin ice of excessive repetition which is prohibited the SkS Comments Policy. If you wish to keep this dialogue moving forward. it's time for you to move on to new points.
-
Tom Dayton at 06:34 AM on 13 January 2015It's the sun
TonyMo, at the top of this page, click the "Intermediate" tab. After you read that tabbed pane, click the "Advanced" tab and read that tabbed pane.
Several researchers have tried different durations of lag between solar input to Earth and Earth's temperature, and they all have found nothing like what you claim.
In addition, there are other aspects of warming that are incompatible with your assertion. For example, in the Advanced tabbed pane, read the sections "Inability to Explain Empirical Observations" and "Conservation of Energy."
-
scaddenp at 06:30 AM on 13 January 2015It's the sun
TonyMo. Your description of TSI reconstruction doesnt match the graph above nor more recent reconstructions (more). "began oscillating"?? Solar physics and sunspot observation would suggest the 11 yr oscillation has persisted much much longer than that. Perhaps you should provide a link to the graph that you are looking at?
-
Daniel Bailey at 05:50 AM on 13 January 2015It's the sun
@ TonyMo
What part of "the CEAMT is not a global record" is not understood by you? -
william11409 at 02:56 AM on 13 January 2015Climate Deniers Employ Predatory Tactics in Fight Against Facts: Scientist
One Planet Only Forever@37 and 38. Not entirely sure why you comment on Professional and Trade Certification. However if, as it seems, you are applying it to politicians, as far as I know there is no certification saying they are qualifiied politicians. Certainly many Ministers are not qualified in the areas their Ministry covers. And as there isn't a special qualification for politicians, the views and likes and dislikes of UK Greens politicians are no more valid and deserve no more attention than those of politicians in any other party except, of course, the party that is in power.
Moderator Am I allowed to ask if you are you able and/or willing to advise what happened to my comment at 34?
Moderator Response:[JH] Your comment was deleted by another moderator. He has not yet specified the reason for doing so. I presume he will do so when he sees this exchange.
-
One Planet Only Forever at 01:11 AM on 13 January 2015Climate Deniers Employ Predatory Tactics in Fight Against Facts: Scientist
William, I forgot to include that Professions and Trades actually have an initial period of training and evaluation that must be successfully completed before a person is considered to be eligible to do the work. All that the Green Party seem to be doing is trying to at least have some minimal assessment of competence of a leader in an important role. The popularity of 'arguments against requiring people in positions of leadership to be legitmately evaluated regarding their competency' needs some serious evaluation. Nothing good can be expected to develop if that type of thinking can be popular.
-
One Planet Only Forever at 01:03 AM on 13 January 2015Climate Deniers Employ Predatory Tactics in Fight Against Facts: Scientist
William,
Your position would appear to extend to a belief that there is no need for any Professional certification or Trade Skill certrification. That would be patently absurd, yet it does appear to be what you are arguing to defend, the freedom of people to do important things regardless of any legitimate assessment of their ability to responsibly and competently do those tasks. Professions and Trades workers are constantly monitored regarding how competentaly and responsibly they are doing their work. And anyone found to be lacking is helped to do better. And anyone unable to or reluctant to be helped to do the work well has their certification credentials cancelled.
Prev 629 630 631 632 633 634 635 636 637 638 639 640 641 642 643 644 Next


