


 Arguments


Recent Comments
Prev 641 642 643 644 645 646 647 648 649 650 651 652 653 654 655 656 Next
Comments 32401 to 32450:
-
wili at 13:43 PM on 5 December 2014Drought and Deforestation in Brazil
Thanks, Alexandre and vonMackwitz. Do either of you (or anyone else) have a clear idea what the main reasons for deforestation are in that particular region?
-
Tom Dayton at 12:17 PM on 5 December 2014It hasn't warmed since 1998
Excellent new post about the pause/hiatus (not) at RealClimate.
-
vonMackwitz at 11:58 AM on 5 December 2014Drought and Deforestation in Brazil
I sure hope that deforestation in Brazil will finally stop. If the deforestation really is contributing to draughts (which I think is likely), Brazil people will have to learn the hard way that reforestation is easier said than done.
-
CO2 effect is saturated
Anne Hyzer - In the troposphere convective overturning dominates, with the atmosphere warmed from below, under a state of constant inversion. Once past the GHG effective radiating altitude (where more than ~50% of upward emission for the wavelength in question is escaping to space without further absorption) and into the stratosphere, the dominant influence is UV warming from the sun, which is strongest at higher altitudes. And since the stratosphere is thermally stable, warmer at the top, convective overturning doesn't occur there.
-
Alexandre at 09:38 AM on 5 December 2014Drought and Deforestation in Brazil
Hi wili,Here in Brazil we've had some coverage of the (possible) link between drought and deforestation in the mainstream media (like this one, in a major news/entertainment Sunday show). The denialist lobby is not as strong here as it is in the US.Of course, nothing seems to suggest that public opinion will demand any action so far... -
Tom Curtis at 08:49 AM on 5 December 2014Volcanoes may be responsible for most of the global surface warming slowdown
rkrolph @6, it is an often neglected subtlety of climate change that the duration it takes to reach the full equilibrium response to a change in forcing is approximately equal to the duration required for the CO2 partial pressures of the atmosphere and ocean to equalize. That means, in the 100 plus years it will take to from current temperatues to the approximately 2 C Equilibrium Climate Response to 400 ppmv of CO2, the CO2 concentration of the atmosphere would have reduced to 340 ppmv. That means with the immediate cessation of all emissions, we are very unlikely to reach the 2 C limit. This only applies with the cessation of all emissions. Even continuing emissions at 10% of the current rate will sustain CO2 levels at a near constant level making it near 50/50 that we will exceed the 2 C limit at some time in the next century.
Unfortunately the IPCC tends to focus only on events in this century, and consider another 150 ppmv of CO2 in the atmosphere to be the limit compatible with having a 50/50 chance of avoiding the 2 C limit as of 2080-2100. As a matter of practical policy that is probably correct, but it does commit us to future sequestrtion of CO2 from the atmosphere.
-
Tom Curtis at 08:37 AM on 5 December 2014CO2 effect is saturated
Anne Hyzer @375, you are correct about the stratosphere increasing in temperature with altitude. Most IR radiation from the atmosphere comes from the tropospheresphere, however, so the above explanation is a reasonable simplification.
For a more detailed explanation, considering the following spectrum of outgoing IR radiation from an unknown (by me) location:

The spectrum has conveniently placed black body curves for particular temperatures (dashed lines). From that you can see that the chief absorption band for CO2 (centered at 650 cm^-1) has a broad flat base at approximately 220 K. That flat base represents the tropopause, where temperatures are unchanging with altitude for several kilometers (see temperature profile below). At the center of that flat base are two peaks, one much larger than the other. That represents radiation from the stratosphere. Also, and very importantly, on either side of the broad absorption band, at about 240 K, and againg at 250 K temperature, you will see notches in the wall, with the former being deeper and the latter broader. These are notches are from local peaks in absorption (emission) which are located within the troposphere.
As CO2 concentration increases, emissions at all wavenumbers in the CO2 brand will come from higher altitudes. That will have several effects. First, the broad plateau at 220 K will become wider emissions from the upper troposphere move into the tropopause. Second, the notches at 240 and 250 K will become wider and deeper as the emissions causing them move higher in the stratosphere. Also, the small notch at 800 cm^-1 will also deepen and widen (that notch also being due to CO2). Against this, the two peaks at the center will grow higher and widen. The combination of the other effects, however, will result in a greater reduction in IR radiation than will the increase due to increased emission from the stratosphere. As an added nuance, the increased CO2 will cool the stratosphere, which will tend to limit the increase in height and bredth of the central peak.
So, overall, outgoing IR emissions will decrease with increasing CO2, and that decrease will be entirely due to higher emission in the troposphere as indicated in the original post. The increase will be only partly offset by an increase in radiation from the stratosphere. All of this is included in determinations of CO2 forcing from standard radation models and Global Circulation Models, although arguably it was neglected prior to the correction to the basic formular for CO2 forcing by Myrhe et al, 1998.
-
Tom Curtis at 08:05 AM on 5 December 2014Volcanoes may be responsible for most of the global surface warming slowdown
MarkR @5, you have the essentials correct except that the blueness of the sky (and redness of sunsets) is due to Rayleigh Scattering, something that requires particles sizes about a tenth or less of the wavelength of light, it 38 to 75 billionth of a meter. Sulfate aerosols typically have sizes from 100 billionth to 5 millionth of a meter, and hence are scattered primarilly by Mie Scattering, which does not discriminate by wavelength. Because aerosol sizes have a size distribution, a small proportion of aerosols are small enough for Rayleigh scattering and will contribute to reder sunsets. Further, the wavelength of thermal radiation from the Earth is sufficiently large that scattering by aerosols is restricted to Rayleigh scattering, and is hence less efficient as you note. For a mathematical treatment, these lecture notes may be useful.
In addition to the scattering effect (the aerosol direct effect), aerosols form condensation nuclei for clouds, resulting in the aerosol indirect effect. The more condensation nuclei, the more water droplets in a given cloud, and the smaller the droplet size. That in turn results in a higher albedo in the cloud. This is seen in the phenomon of ship tracks, where clouds are thicker and more reflective over the paths of ships (as seen below):
For reference, here is one of the early papers on the effects of aerosols.
-
wili at 07:57 AM on 5 December 2014Volcanoes may be responsible for most of the global surface warming slowdown
1) "I am assuming that the 2 deg on the y-axis is the 2 degree value we always hear discussed as the point we want to avoid exceeding"
No. The chart set its "0 degree" mark at the average for the last half of the 20th century, specifically 1961 - 1990. Whereas the 2 degree C limit dicussed in treaties is from a "0 degree" mark from the 1800s, iirc.
2) "Is there a delay effect such that even if we stopped emissions completely today that we might still reach the 2 degree point?"
Yes...well, probably. But in any case, we are not going to 100% stop emissions this year. So it's a moot point. Continued emissions at anything like todays levels for the next few years makes it pretty much impossible to stay below 2 degrees, as I understand it.
If you have a few moments, look at this from one of the top climatologists in the UK: Kevin Anderson 'Rhetoric to Reality'
If you have more than a few minutes, try this:
Real clothes for the Emperor: Facing the challenges of climate change
-
wili at 07:06 AM on 5 December 2014Drought and Deforestation in Brazil
Thanks for covering this important story in such a thoughtful, big-picture way. If only we saw more coverage like this from other, more main stream, media!
-
Anne Hyzer at 06:18 AM on 5 December 2014CO2 effect is saturated
I have a question. This debunking depends on the fact that stratospheric temperatures decrease with increasing elevation, so the CO2 gets colder as you gp higher, and radiates less. But I was always told that the stratosphere does not decrease in temperature with increased height. Please explain.
-
rkrolph at 04:50 AM on 5 December 2014Volcanoes may be responsible for most of the global surface warming slowdown
Can someone explain in a quick summary why the big swings in projected ranges from FAR to SAR, and then TAR? Also, I am assuming that the 2 deg on the y-axis is the 2 degree value we always hear discussed as the point we want to avoid exceeding. Is there a delay effect such that even if we stopped emissions completely today that we might still reach the 2 degree point?
-
MarkR at 03:17 AM on 5 December 2014Volcanoes may be responsible for most of the global surface warming slowdown
MThompson: iirc, aerosols have a cooling effect because they scatter light.
Scattering by atmospheric molecules explains some of the blueness of the sky. Scattering is stronger when the wavelength is shorter, and blue light has a shorter wavelength so it's scattered more strongly. Instead of passing through the sky above our heads, more of it is scattered down and we see it.
Visible light has a shorter wavelength than infrared light, so it is much more strongly scattered by aerosols. This means that they bounce back more light from the Sun than they do from the Earth, so they have a net cooling effect.
I think this is a reasonable summary of what's going on. There's more detail to it as well: in reality it's related to the size parameter rather than the wavelength alone, aerosols have other effects (like helping to form bigger particles), while black carbon and soot helps to absorb more light so has a warming effect. There is also the 'phase function', which determines the direction of scattering... but all of this is accounted for and the result is that volcanic aerosols cool the surface.
-
longjohn119 at 17:09 PM on 4 December 201497 Hours - the Turkish edition
Climate Change is a global problem that can only be solved by global cooperation
Thanks for providing a positive example of how this can work
-
Tristan at 16:13 PM on 4 December 2014Volcanoes may be responsible for most of the global surface warming slowdown
Ahh, thanks Rob :)
-
Rob Honeycutt at 15:11 PM on 4 December 2014Volcanoes may be responsible for most of the global surface warming slowdown
Tristan... Try the second paper that Dana links to.
-
Tristan at 15:07 PM on 4 December 2014Volcanoes may be responsible for most of the global surface warming slowdown
If there is a volcanism related 'slowdown' over the period of 1999-2014 , that requires those years to have been unusually volcanically active compared the previous 30, which included Pinutabo and St Helens.
Is that demonstrated in the paper? It doesn't give enough detail in the abstract.
-
MThompson at 14:10 PM on 4 December 2014Volcanoes may be responsible for most of the global surface warming slowdown
Maybe someone can help me understand the part about sulfur aerosol particulates blocking sunlight. Are these particulates highly reflective in any of the more abundant solar wavelenths?
-
Tom Curtis at 08:13 AM on 4 December 2014Models are unreliable
SDK @784, what you are looking for was in fact provided in the draft version of the recent IPCC report:

In this graph, the range of the projections are given as the range between the mean projections for two different but plausible bau scenarios. To that is appended the grey zone representing the reasonable range of annual variability due to short term factors such as ENSO. The graph was ammended in the final report, mostly because of a fake controversy (see here and here)generated by ignoring that fact (which was not sufficiently emphasized by defenders of climate science, myself included). The graph does have some flaws, including an inappropriate baselining on a single year and the fact that the grey zone, out of graphic necessity, is drawn from the upper or lower limit of all projections. Therefore caution should be used in presenting that graph, which should not be presented without the disclaimers regarding its flaws, in links to rebutals of the trumped up controversy.
For these reasons, I prefer my own graph which plots observations against all model runs for AR4:

Doing so allows the actual model variability to define the expected annual variability, thereby eliminating the false perception of smoothness sometimes generated by showing only ensemble means for projections. The test for those claiming the models failed to project the current temperatures is to pick out the observations from the projections. If they cannot do so easilly, then the model projections have correctly captured both the trends (see below) and the range of annual variability.

-
SDK at 03:04 AM on 4 December 2014Models are unreliable
Long time reader of SkS, but not a poster. I was explained the basics of AGW and modelling in the 90s by a crazy Swedish mathematician / scientist, and as a data modeler I took it to heart. My main academic field is Philosophy, but you gotta earn a buck as well I guess…
Question I have though is with regard to the IPCC year-by-year model results. As I understand it, most “skeptics” infer that the farther away observations stray from the ensemble mean, the more wrong you are. As if the ensemble boundaries are error bars of sorts.
But that’s far from being the case of course. In fact, today the models are actually correct when hugging the lower boundaries, given the downward pressure of volcanic activity, short-term solar cycles and a net negative pseudo-ENSO cycle since 1998.
Just wondering then if the IPCC should perhaps offer some qualified projection-scenarios? Like, explaining in 2000 that a possible future La Nina-dominated decade would in fact produce a flatter curve? Certainly would help explain things to my right-wing friends… And the larger public as well. I understand that the ensemble mean does not include natural variability, but lots of people don't...
-
jimlj at 15:15 PM on 3 December 2014Mercury Rising: 2014 Likely to Surpass 2010 as Warmest Year on Record
The UAH November satellite data is out. It shows a 0.33C anomaly from the 1981-2010 period. If that translates to other temperature records, then November will be one of the warmest on record, and pretty much nail down a calendar record.
-
One Planet Only Forever at 00:08 AM on 3 December 2014The Skeptical Science temperature trend calculator
Kevin C. ignore my @ 63. This would only matter when looking at short sets of data so it is not relaly relevant.
-
dvaytw at 19:19 PM on 2 December 2014Mann Fights Back Against Denialist Abuse
Thanks for all the input, everyone. In the future I will do exactly that (link to where the discussion is happening).
Moderator Response:[JH] Thank you.
-
One Planet Only Forever at 13:15 PM on 2 December 2014Mercury Rising: 2014 Likely to Surpass 2010 as Warmest Year on Record
Tom Curtis @ 19,
I have also noticed a degree of success by delayers (a term I prefer because the smart ones know they can't sustain the delusions they try to prolong), in making-up their definition of the 'hiatus' reference in the IPCC report. The hiatus was clearly intended to indicate a temporary slowing of the rate of increase, not that it had ended. The word-spin-masters created the easy to accept claim that hiatus meant 'no more warming has occurred and the scientists said so themselves, so the science is wrong and can continue to be ignored'. The main audience of the delayers is people who are not really interested in checking things out for themselves. Many people look for what they prefer to hear and are willing to accept whatever sounds believable and agreeable to them (exactly like sports fans who ignore the bad facts about their favorite team and accept the unsubstantiated criticisms of the teams they do not like). That is a tough group to motivate to better understand what is going on, because that better understanding is likely contrary to their preferences and interests.
-
One Planet Only Forever at 13:04 PM on 2 December 2014Mercury Rising: 2014 Likely to Surpass 2010 as Warmest Year on Record
RE: My Comment @15,
My mistake. I forgot to enter 2015 as the end year to get the 2014 data.
-
One Planet Only Forever at 13:02 PM on 2 December 2014The Skeptical Science temperature trend calculator
Kevin C,
Ignore @ 62. I had forgotten to input 2015 as the end year to get the latest data.
-
Tom Curtis at 11:53 AM on 2 December 2014Mann Fights Back Against Denialist Abuse
KR @49, please read the comment linked in my post @48. It is very clear from it that dvaytw is exactly as he presents himself, a person who accepts the science and comes to SkS for help with issues he has not seen before. Clearly any misunderstandings in the past were exactly that, and it would behove use to pay more attention to our contribution to such misunderstandings rather than direct the blame solely at dvaytw.
Having said that, I agree with your suggestion of links to off site discussions when advise is being sought.
-
Tom Curtis at 10:07 AM on 2 December 2014Mercury Rising: 2014 Likely to Surpass 2010 as Warmest Year on Record
Yvan Dutil, the trends from 1995.0 to 2007.93 are:
GISS 0.198+/-0.18 C/Decade
NOAA 0.17 +/- 0.17 C/Decade
HadCRUT4 0.198 +/- 0.181 C/Decade
BEST 0.219 +/- 0.173 C/Decade
Cowtan & Way Krig 0.237 +/- 0.185 C/Decade
Cowtan & Way Hybrid 0.238 +/- 0.197 C/Decade
That is, all surface temperature records show a statistically significant warming from 1995 to the end of 2007. That clearly shows the purported "pause" in global temperature increase is in fact just a decline in average temperatures over the past six years. Further, in that six year period a new record for annual global mean surface temperatures was set in 2010, with apparently a new record about to be set. That shows starkly that the "pause" really just comes down to the effect of two strong La Nina events, one of which included the strongest La Nina configuration in 137 years of record:

It remains a tribute to the skills of deniers at persuasive definition that many people continue to believe there has actually been a cessation of global warming.
-
Mann Fights Back Against Denialist Abuse
dvaytw - As per earlier discussions where exactly the same thing happened (you presented a denial viewpoint asking for refutation, but did not clearly show that it _wasn't_ concern trolling, leading to predictable reactions from the moderators), it would be exceedingly helpful if you would link where these off SkS discussions were occurring.
Context matters. You are again failing to provide any.
Moderator Response:[JH] I concur.
-
Paul W at 09:38 AM on 2 December 2014Mercury Rising: 2014 Likely to Surpass 2010 as Warmest Year on Record
My take on this is that we are currently held captive culturally in the west to the "sporting" sub set with their minds held captive by "Limited News" and their sports focus. They are the big undecided. They dont "back" losers or nerds.
I see it as a challege to get in their heads to find a way to communicate the science (the real deal) so we can reduce the political strength of the denier lobby.
Others have talked about "the race" for the warmest year and I think a race is what we have. To have the views of science take policial power and still be left with a chance of keeping an advanced culture moving into the future. Alternative has been well shown by "Mad Max". A hot dry angry world in decay. A Jock distopia.
So I suspect the race analogy is a worthy mind set to reach/bring along parts of the population more interested in the race than the topic.
-
Tom Curtis at 07:39 AM on 2 December 2014Mann Fights Back Against Denialist Abuse
JH, if you want independent confirmation that dvaytw is on the level, you might like his ringing endorsement of SkS at Scientific American. Also, rather than asking him (or others seeking informed advise) not to apologize, it may be better to ask them to link back to the discussion on which they are seeking advice (if it is online). That way we can check the context of the claims, directly participate if we think it would be helpful, and coincidentally confirm for ourselve the bona fides of the person asking questions on SkS.
Moderator Response:[JH] Thank you for the reference and your suggestion.
-
Yvan Dutil at 02:49 AM on 2 December 2014Mercury Rising: 2014 Likely to Surpass 2010 as Warmest Year on Record
Actually, if you extend the autocorrelation period to 2014, many dataset are significant even from 1996. With HADCRUT4 hybrid v2, I manage do to it starting in 1999.5!
-
Yvan Dutil at 02:39 AM on 2 December 2014Mercury Rising: 2014 Likely to Surpass 2010 as Warmest Year on Record
I have juste checked. It is now updated to october!
No growth detected at 2 sigma to since 1996 still valid. However, it is detected at two sigmas since 1995 ;) -
dvaytw at 02:25 AM on 2 December 2014Mann Fights Back Against Denialist Abuse
Yes it occurred to me that you might think that, and given my experience with such people, I totally understand why you would! And thanks again to the responders above... man did I just make one very smug fellow look bad!
-
Tom Dayton at 02:07 AM on 2 December 2014It's too hard
New estimate of electricity generated if every roof and parking lot were covered with solar panels: 100 times consumption in the U.S.
-
dvaytw at 00:59 AM on 2 December 2014Mann Fights Back Against Denialist Abuse
Dear JH. Please accept my apologies. I waste a lot of my time trying to slap down denier arguments in various forums and comments sections under articles. In this case everything that came up in Google was mirrored from a denier blog, and noting pertinent was found in your search engine . Usually I can get an answer here in lightning fast time (as with this case). Honestly, if I don't do that, I'll probably just have to concede some points because it certainly isn't worth spending a whole heap of time looking such things up.
If such lazy inquiries aren't welcome here, can anyone recommend another place where they can be made effectively?
Finally, I fully understand if you want to delete my inquiries in this thread, and will try to refrain in the future. Also, point taken about quoting and linking to the article.Moderator Response:[JH] I purposely prodded you to make sure that you were not engaging in an elaborate ruse in order to spread denier poppycock on this site. I am now staisfied that you are not doing so. Please do continue to seek expert advice on this website. However, please do not apologize every time you do so.
-
Lomax at 00:57 AM on 2 December 20142nd law of thermodynamics contradicts greenhouse theory
@CBDunkerson: Great, many thanks for clarifying; I guess that summary was just poorly written - as was my post, on second read-through :) I'm relieved to hear that my understanding of thermal equilibrium was basically correct and that the greenhouse effect works the way I thought (though I'm not sure relieved is the correct word here). Indeed it does sound worrying that the feedback from reduced albedo and increased water vapour levels might be greater than previously thought - let's hope they are proven wrong!
-
CBDunkerson at 00:51 AM on 2 December 20142014 SkS Weekly Digest #48
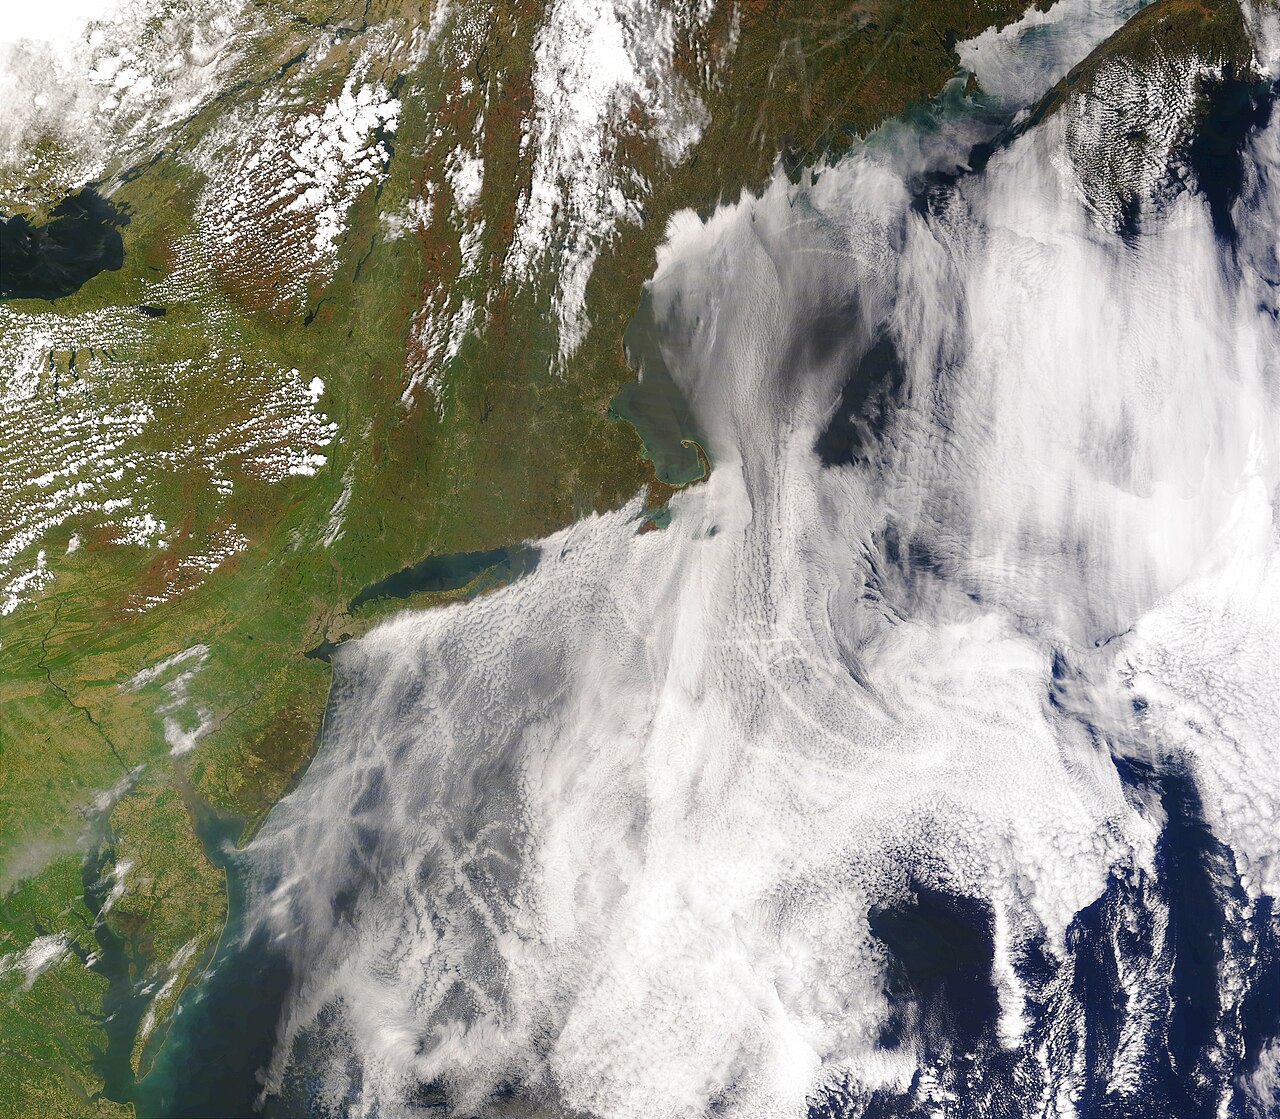
wili, wow. That's a great graphic. If you search on 'Omega block' you should find a few stories from a couple weeks ago about the phenomenon responsible. Example.
-
wili at 00:40 AM on 2 December 20142014 SkS Weekly Digest #48
It looks like the polar vortex has basically split in two. I believe that is rather...uncommon. Are there any news stories about it?
http://earth.nullschool.net/#current/wind/isobaric/70hPa/orthographic=-15.56,74.65,282
-
CBDunkerson at 00:35 AM on 2 December 2014Mann Fights Back Against Denialist Abuse
dvaytw. as Tom has pointed out, the entire 'Tim Ball victory' story was a bizarre bit of fiction. I can't believe deniers are still managing to live in that alternate reality months after the fact.
Information about the data for the 'hockey stick' can be found here;
Of course, the fact that the National Academy of Sciences and numerous individuals (including 'sceptics' like McIntyre) have reviewed this data makes the continued claims that it isn't available right up there with Tim Ball's amazing non-existent court victory in the category of 'evidence that these people are mentally ill'.
Moderator Response:[RH] Sorry, your link was breaking the page format by just a smidgen.
-
dvaytw at 00:33 AM on 2 December 2014Mann Fights Back Against Denialist Abuse
Tom, as nutty as a lot of denialist blogs are, I'm finding this hard to believe. You mean that website is totally fabricating the claim that Mann's lawsuit has been dismissed?!? (or Ball is, and they are parroting his claim)
That is nuts. Everyone and anyone will be able to check and refute this. Does anyone know more about this? I haven't been able to find a single reputable news source saying anything about it - but of course lots of denialist blogs posted it.
Moderator Response:[JH] "Reliable news sources" do not typically pay attention to what is being posted on the websites of known crackpots.
-
CBDunkerson at 00:06 AM on 2 December 20142nd law of thermodynamics contradicts greenhouse theory
Lomax, when the first quotation says, "...within about a decade the effect of adding the thicker blanket has been cancelled by the warmer body emitting more energy", the 'effect' in question is the amount of outgoing long wave radiation. The planet (i.e. "the warmer body") is still hotter... it is just that the increased heat eventually leads to the radiation flows in and out equalizing. The planet isn't going to "return to its earlier temperature" as you say... just to it's earlier OLR rate, which is happening precisely because the temperature has increased.
"This just doesn't make any sense to me; if CO2 is able to "trap" long-wave radiation, surely if you keep increasing the CO2 level, the "trapping" ability will also continue to increase?"
Yes, but as you 'trap' more long wave radiation within the climate system that causes/is heat buildup... which causes/is even more long wave radiation emission, until eventually the extra amount being emitted equals the extra amount being trapped and the total output returns to its original level.
Think of it as a lake with one stream flowing in and three streams flowing out. If you block off one of the outflow streams (i.e. add CO2 to reduce OLR) then the amount coming in from the inflow stream (i.e. radiation from the Sun) now exceeds the amount going out and the water level rises (i.e. the Earth gets hotter). However, as the water level rises that causes it to flow out the two remaining outflow streams faster (i.e. the amount of longwave radiation increases) and eventually the lake water level stops rising when the inflow and outflow rates are again in balance (i.e. the temperature stops increasing when incoming and outgoing radiation again match).
For the record, none of that is actually the 'result' found by this study... that's all basic global warming. What this study is arguing that is 'new' is that the warming effect of increasing CO2 will very quickly be overwhelmed by the feedback warming effect of a darkening planetary surface (e.g. from melting snow and ice). I'm not sure I buy that, for one thing it's a model result which doesn't seem to jibe with paleoclimate studies, but if anything it actually suggests that warming will be much greater than expected.
-
Tom Curtis at 22:55 PM on 1 December 2014Mann Fights Back Against Denialist Abuse
dvaytw @42, those allegations were made on Feb 21 of this year. On Feb 22, Michael Mann responded by posting a letter from his lawyer on face book:
"Response from my lawyer in response to latest claims by #TimBall (more info on him here: http://www.desmogblog.com/timothy-f-ball-tim-ball) & #JohnOSullivan (more inf on him here: http://www.desmogblog.com/affidavits-michael-mann-libel-sui… ):
The review of Tim Ball’s new book by Hans Schreuder and John O’Sullivan makes preposterous statements concerning Dr. Michael Mann’s lawsuit in the British Columbia Supreme Court against Tim Ball and other defendants. The Mann lawsuit is currently in the discovery phase, with further examinations for discovery (depositions) of the defendants to be scheduled shortly, following which I will either set the action for trial by jury in the usual manner, or bring a summary trial application on behalf of Dr. Mann for damages and injunctive relief.
Dr. Ball has not set the matter for trial and there is no motion by Ball currently before the Court. The allegation by Schreuder and O’Sullivan that Dr. Mann has refused to show his metadata and calculations in open court is not true.
Their assertion that Dr. Mann faces possible bankruptcy is nonsense. Dr. Mann’s lawsuit against Dr. Ball and other defendants is proceeding through the normal stages prescribed by the BC Supreme Court Civil Rules and Dr. Mann looks forward to judicial vindication at the conclusion of this process.
February 22, 2014
Roger D. McConchie
Barrister and Solicitor
Legal Counsel to Dr. Michael Mann" -
Paul W at 20:15 PM on 1 December 2014Our short film on the One-Two Punch of Climate Change
I was up at Heron Island earlier this year diving but was not able to see the experiments. The results so far I did get to here about were very clear from the tour I went on of the experimental station.
It's a very good to see the video with so much in so little time. Well done! The pictures tell the story. BAU holds no good news for the GBR.
With the Keeling Curve showing an accelleration of CO2 emissions and the portion of CO2 staying in the air staying about constant, ocean acidification is a fact of simple physical chemistry. To see what that does to the reef is clear enough.
The need to change course now with all the resources we can muster and to say so in three minutes is impressive.
-
dvaytw at 18:49 PM on 1 December 2014Mann Fights Back Against Denialist Abuse
PS The reason my question is relevant to this thread is that deniers are using the recent win of Tim Ball against Mann in Canadian court as evidence that he won't provide his data:
The fact Mann refused to disclose his ‘hockey stick’ graph metadata in the British Columbia Supreme Court, as he is required to do under Canadian civil rules of procedure, constituted a fatal omission to comply, rendering his lawsuit unwinnable. As such, Dr Ball, by default, has substantiated his now famous assertion that Mann belongs "in the state pen, not Penn. State." In short, Mann failed to show he did not fake his tree ring proxy data for the past 1,000 years, so Ball’s assessment stands as fair comment. Moreover, many hundreds of papers in the field of paleoclimate temperature reconstructions that cite Mann’s work are likewise tainted, heaping more misery on the discredited UN’s Intergovernmental Panel for Climate Change (IPCC) which has a knack of relying on such sub prime science.
MICHAEL MANN FACES BANKRUPTCY AS HIS COURTROOM CLIMATE CAPERS COLLAPSE
Moderator Response:[JH] Please refrain from posting quotes from climate denier websites — especially statements that are patently false.
-
chriskoz at 18:32 PM on 1 December 20142014 SkS Weekly Digest #48
jimlj@1,
I've read a bit about Flat Earth Society and their arguments supporting "the alternative thinking" in hope of finding some novel idea they could be proud of. Sadly I found nothing but logical mistakes and non-sequitur reasoning in general.
So I disagree, the comparison of climarte science deniers logic to FES logic is quite accurate with respect of number and gravity of their logical falacies.
But interestingly, many climate science models are well compatible with FES model. The layered 1D greenhouse gas absorption model is a chief example. Even the most orthodox flat earther can easily accept it while we know that many climate ecience deniers reject it. In fact, given the precision of input data (e.g. the volume of glacial melt), we simply calcutate the SLR by dividing said volume by the area of the oceans, just like flat earthers. Because the sperical shape of the Earth (or even the water spilling into some low lying parts of continents) does not matter for the resulting numbers.
So for the practical purposes we can say, that climate deniers are even bigger science deniers than flat earthers.
-
dvaytw at 18:25 PM on 1 December 2014Mann Fights Back Against Denialist Abuse
I'm sorry to be lazy again, but I'm looking for the quickest possible response to the denier claim that Michael Mann "has refused consistently and insistently to supply the basic data used behind these constructions".
I tried phrasing my querry various ways in the search engine, but didn't come up with anything useful.
Moderator Response:[JH] Perhaps you need to devote more time to doing your own research. Your stream of apologies for being lazy is beginning to wear thin.
-
wili at 14:13 PM on 1 December 20142014 SkS Weekly Digest #48
RealClimate is covering a recent article on El Nino:
-
td3 at 13:38 PM on 1 December 2014The latest global warming bill and the Republican conundrum
I would not say this bill qualifies under the definition of revenue neutral. It would be hard enough to get a bill passed that just says: "All revenue shall be paid out in reduced earned income and Soc. Security tax." Instead this bill has all sorts of other provisions: Page 24 of the pdf at http://www.whitehouse.senate.gov/download/?id=5a0a5234-a651-4e50-a4b5-2b15a7e57d3a&download=1 says the funds can be paid out in various ways. Only (b) and (i) are clearly revenue neutral. (a), (d), (e), (g), and (h) are clearly payouts to special interests and are by definition not revenue neutral.
‘‘(A) Providing economic assistance to low income households or households in regions 5 with disproportionately high energy costs.
‘‘(B) Transfers to the general fund of the Treasury to offset tax cuts.
‘‘(C) Transfers to the Federal Old-Age and Survivors Trust Fund and the Federal Disability Insurance Trust Fund established under section 201 of the Social Security Act to provide supplemental funding for increases in Social Security benefits.
‘‘(D) Providing tuition assistance for higher education or alleviating federal student loan debt.
‘‘(E) Investing in improvements to the infrastructure of the United States.
‘‘(F) Providing dividends directly to individuals and families.
‘‘(G) Providing transition assistance to workers and businesses in energy intensive and fossil fuel industries.
‘‘(H) Investing in mitigation and adaptation measures that promote national security, protect public health, conserve natural resources, or fulfill international climate commitments made by the United Nations Framework Convention on Climate Change.
‘‘(I) Reducing the debt of the United States.
-
Zeboo at 10:44 AM on 1 December 2014It's the sun
Zhao and Feng have now published their paper in Journal of Atmospheric and Solar-Terrestrial Physics: Correlation between solar activity and the local temperature of Antarctica during the past 11,000 years
Would be great to get som updated comments since this is making the denier blog round
Prev 641 642 643 644 645 646 647 648 649 650 651 652 653 654 655 656 Next


