


 Arguments


Recent Comments
Prev 648 649 650 651 652 653 654 655 656 657 658 659 660 661 662 663 Next
Comments 32751 to 32800:
-
Tom Curtis at 10:20 AM on 16 November 2014CO2 effect is saturated
As the discussion has turned to Hottel Emissivity, graphs, here are two, one for CO2 and the other for H2O:

And another with metric units for pressure length, but degrees Rankine for temperatures, CO2 alone:
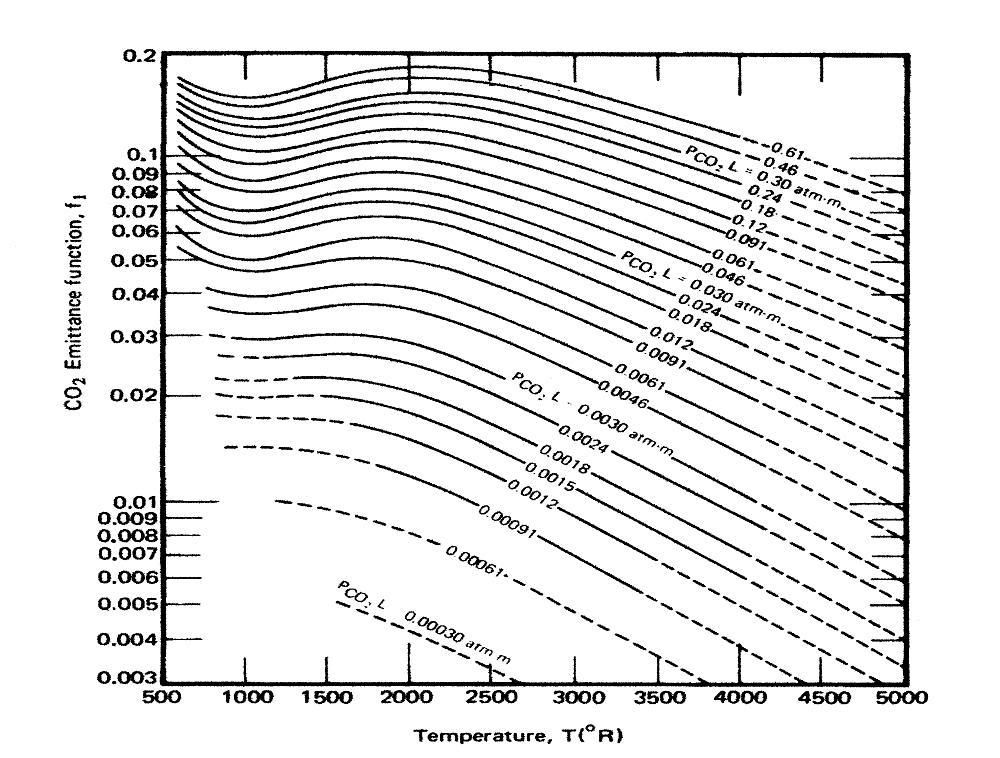
I have been unable to find graphs with metric units both for pressure-length, and temperature (or Imperial units for both). The second comes from a comment by DeWitt Payne on Science of Doom.
Elsewhere DeWitt Payne has two comments on how to interpret, and use such graphs. In the first, he attempts to clariffy a misconception about how to use the charts:
"It’s only low for a short path length. I’ve had this discussion before. If the path length is 1 m and the partial pressure is 0.00038 atmospheres then the Hottel emissivity curve to use is the one for 0.00038 atm m. If the path length is 10 km, then the mass path length is 3.8 atm m, which is well above the range of the Hottel charts I’ve seen, but puts the emissivity value for CO2 at ~0.2."
That clarrifies the relevance of the units of the curves, ie, the pressure-length, atmospheres per meter in the graph shown by DeWitt Payne (ie, the second graph above). That is, to determine the emissivity of CO2 at a given temperature, you determine the atmosphere-length by multiplying the partial pressure of the CO2 in atmospheres by the path length in meters. If the path length is 10 horizontal kilometers, and the partial pressure is 0.0004 atmospheres, the atmosphere-length is 4 atmosphere-meters (and hence well of the charts above). In an earlier post (@322) Satoh referred to "...the fact that at normal pressures and temperatures CO2′s emissivity is somewhere around 0.0019". The lowest line on the second graph above shows a atmosphere-length of 0.0003 amtmosphere meters (ie, about 300 ppmv over one meter). At 1500 Rankine (560 C), its lowest temperature value it shows an emissivity of 0.005, or about 2.5 times that quoted by Satoh. I presume the chart Satoh used had a shorter unit than a meter. Regardless he is clearly making the error DeWitt Payne attempts to correct in his discussion on SOD.
Having said that, DeWitt Payne's estimate of a 0.2 emisivity at standard pressures and temperatures for the full height of the atmospheric column is probably fairly close. That is because the emissivity is the total irradiated energy divided by the total irradiated energy of a black body with the same temperature. (See DeWitt Payne's worked example.) The consequence of this is that as temperature rises, total emission of a black body rises with the fourth power of temperature. Total emission of CO2 as a thermal emitter will also rise, but in bandwidths in which it already radiates strongly, at a far lower rate than with the fourth power of temperature. The result is a general decline in emissivity even while emissions at every wavelength in which emissions exist actually increase. The general decline is not absolute. If a potential emitting wavelength comes within the range of thermal radiation, it will initially increase its emissions at faster than the 4th power of temperature resulting a temporary rise in emissivity with temperature, as can be seen on the CO2 charts for temperatures between 1000 and 2000 Rankine (280-840 C).
The upshot of all this is that emission at a given wavelength for thermal emission always increases with increased temperature. When Satoh claims that "We all know, 200 K is very cold. If the elevation of this emitting layer of CO2 climbs higher, and therefore becomes colder, it makes the temperature closer to 200K and therefore the emission would be STRONGER, not weaker" (@320, refuted @321) he is simply wrong, and is not supported by the Hottel charts in that conclusion. On the other hand, when he says, as @334, "... the emissivity of CO2 goes up as the temperature goes down", he is (in general) correct, but it does not have the consequences he assumes. Put simply, emission is not emissivity. Satoh incorrectly assumes they are.
This diversion has not been without benefit, however. Contrary to his claim @337, his reference is a good one, showing Hotel charts for H2O alone (Figure 2) and CO2 alone (Figure 3) as well as both combined in other figures. I also claims that the Exponential Wide Band Model (EWBM) as well as Narrow Band Models (NBM) perform well, with accuracy primarilly limited only by the accuracy of the original spectral absorption lines in such databases as Hitran. Satoh, apparently, did not notice the endorsement, and that he has cited in his argument against the results of NBMs a paper that endorses them.
-
michael sweet at 09:12 AM on 16 November 2014CO2 effect is saturated
Satoh,
While I am not expert in IR spectroscopy, it flys in the face of reason for the total emmisivity to increase as the temperature decreases. The percent of emmisivity at a single wavelength could increase, but if the total emmisivity increased than a colder body would heat a nearby hotter body. That violates the first law of thermodymanics. Perhaps you need to review your posts and ensure you are not accidently claiming total emmisivity is increasing when you really mean relative emmisivity is increasing. But perhaps I misunderstand emmisivity since I am not an expert.
-
michael sweet at 09:01 AM on 16 November 2014CO2 effect is saturated
Satoh,
In general, in a scientific argument you must provide citations for any claim you make that is in dispute. If you say that Tom's claim is a "Brazen Bluster" you must provide support for your claim, which you have not done. Tom provided data to support his claims. If you fail to provide support (as you have done so far for all of your arguments), I presume that the support does not exist.
The unsupported claim of a random internet guy is not worth anything in a scientific discussion. When you finally provide a citation and it is the incorrect graph that does not make you look very well informed. I am not expert in IR spectroscopy, but I can read and understand the references. You must provide those references to support your claims to be taken seriously. It is not my job to Google all your claims.
-
Satoh at 08:28 AM on 16 November 2014CO2 effect is saturated
OK I checked my reference, those charts were for a mixture of H2O and CO2, with an emissivity 10 times higher than that of CO2 alone. I'll try to find a link to the Hottel charts. Otherwise, if you need citations, can you please tell me what information you need a citation for? I don't know what needs references and what is "widely known" and/or can easily be googled or wikipedia'd
-
Satoh at 08:06 AM on 16 November 2014CO2 effect is saturated
Michael, the classic reference that CO2 emissivity increases with decreasing temperatures is the Hottel charts, in use for at least 50 years and still the benchmark. I think this has them on page 552 of this old gem:
Moderator Response:[RH] Fixed link that was breaking page format. Please check out the link feature on the second formatting tab above the text box.
-
michael sweet at 07:56 AM on 16 November 2014CO2 effect is saturated
Satoh,
If you could provide some citations to support your claims it would be helpful. Tom has provided copius graphs and citations to support his claims. You have only your unsupported word. If you provided citations to support your claims it would be easier to judge them.
-
Satoh at 03:09 AM on 16 November 2014CO2 effect is saturated
Brazen bluster is saying that 80% transmission in the N band doesn't matter because sometimes it's cloudy, and making the straw man "when it's cloudy, transmission through the N band is essentially zero". Is there anybody who doesn't know about clouds? Since clouds cover around half the sky, that cuts it from 80% to 40% but it does the same to all other radiation. It's a complete straw man, tin man, and cowardly lion in one swell foop, and you can throw in the man behind the curtain.
Brazen bluster is claiming that CO2 is a grey body. Emissivity of a perfect black body is 1.0 (no units), so anything slightly less than that is a grey body. What shade of grey is 0.009 (no units). There are 50 shades of gray and that one wasn't in the book. Claiming CO2 acts like a bb radiator at the top of the atmosphere is brazen bluster, especially since the emissivity of CO2 goes up as the temperature goes down.
Moderator Response:[RH] Please ratchet the tone down a few notches.
-
Stephen Leahy at 02:00 AM on 16 November 2014Fact check: China pledged bigger climate action than the USA; Republican leaders wrong
Neither the US or China are global leaders on energy effeciency or carbon cuts but they could be if they wanted to.
An analysis by European climate science institutes:
Good Twins or Evil Twins? U.S., China Could Tip the Climate Balance
-
One Planet Only Forever at 00:55 AM on 16 November 2014Fact check: China pledged bigger climate action than the USA; Republican leaders wrong
wili,
The range of interpretation of the term 'low carbon' is indeed what I was highlighting. That term has traditionally been used to refer to an entire socioeconomic system implying that less carbon is emitted. Even in that context it is open to interpretation. A better use of the term is in reference to the direction of development, such as developing to a lower carbon emissions impact way of doing things.
However, I must clarify that questioning the intent of the term in relation to China's commitments is not meant to seriously diminish the significance of the commitment made by China. I just wanted to point out the need to clarify points that can be 'open to misleading claims'. China has clearly stated they will be capping their impacts by 2030 which is significant. However, in the full presentation of the details of the commitment which will be part of the 2015 formal commitments I wold want to see that the maximum per-capita level of China's impacts will be lower than the levels the USA developed to.
My main point was about the irrefutable fact that the USA and a few other countries increased their emissions after globally admitting that already well developed nations doing so was unacceptable, after agreeing hat those alreday well developed nations would be the leaders and needed to show leadership. The actions of those nations to further increase their unaccepable impacts over the for 15 years after declaring how unacceptable it would be to do such a thing provides an irrefutable basis for the likes of China and India to thumb their noses at requests for them to cap their emissions before their nations reach the level of development that the USA had reached by 1990.
The fact that the likes of the Repubican Leadership have tried to claim the USA should not be reducing its emissions unless nations like China and India also have caps set at lower per-capita emissions than the USA developed to in 2005 is incredibly galling since these are people fully aware of all the facts and very aware of the claiims they make. Their behaviour on this issue indicates that the USA has the potentially stopped being a global leader toward a better future for all, and maybe that end of USA global leadership pre-dates 1990. Maybe the USA never was leading toward the development of a sustainable better future for all. And as seen in the chart in the article China will be setting a 2030 per-capita cap on their emissions that is signficantly lower than the level the USA was at in 1990. The USA 5000 Mtonnes (6127 Mtonnes GHG equiv), for 250 million matched matched by China's current population of 1400 million would be 28,000 Mtonnes CO2 (34,000 Mtonnes GHG equiv), and China will not be near that number by 2030. As indicated in the chart in the article the BAU expected emissions in China by 2030 would be about 16,000 Mtonnes CO2 which would be 40% less than the USA per-capita impacts in 1990. So China is showing more global leadership than the USA commitment.
p.s. I have presented information on a per-capita basis which I know raises challenges that global population growth is 'the problem'. While there are many things affected by global population growth the CO2 emissions problem is caused by the people with high per-capita impacts. And what is clearly indicated is a need for a global maximum cap on total accumulated emissions in the near term with a low total global allowance per year after that time for humanity to sustainably develop a beter future for all.
-
wili at 22:08 PM on 15 November 2014Fact check: China pledged bigger climate action than the USA; Republican leaders wrong
I assumed "low carbon sources" meant essentially all non-fossil fuel sources--hydro and nukes as well as wind, solar and other renewables. But perhaps the openness of the term does leave them some wiggle room for interpretation.
-
MA Rodger at 20:11 PM on 15 November 2014More research confirming large methane leakage from shale boom
Moderator Response @21.
The document rather confusingly has the title "Introduction", it being Chapter 1 of IPCC AR5 WG1. I am at a loss as to the relevance of the point the commenter Russ R. is attempting to make. The IPCC themselves describe in that reference that estimates for as-then future CH4 emissions in AR4 were too low. Russ R. presents this as the IPCC being "wrong," saying "methane is turning out to be not as big a climate issue as we were told it would be." Yet I fail to see any "big climate issue" that has been mis-described. Whatever the point he attempts to make, the "issue" Russ R. describes can only amount to an underestimation in climate forcing of some 0.02Wm^-2 which is not what anybody would call "big" in climate terms.
Moderator Response:[JH] Thank you for identifying the document. Not all of our readers are climate science-wonks who would recognize the document by merely viewing its content.
Re Russ R's modus operandi: As noted by gws @22, he/she seems to be fishing for red herrings. Some might call that trolling which is prohibited by the SkS Comments Policy.
-
Tom Curtis at 17:31 PM on 15 November 2014CO2 effect is saturated
Satoh @332:
"The newer ambient temperature microbolometers are sensitive to the entire range of CO2′s emission wavelengths and they work perfectly, due to the fact that at normal pressures and temperatures CO2′s emissivity is somewhere around 0.0019."
We have long passed the point where Satoh is ready to say any absurd thing to defend his clearly mistaken original claims. One of those original claims was, in support of a merely distracting (and confusing if adopted) terminological preference, that "the 15 micron IR band radiates from earth's surface and is absorbed to extinction by CO2 in the lowest level of the atmosphere (the elevation of extinction is around 500 feet)". As the 15 micron bandwidth is significant for any near room temperature thermal emission, this contradicts his claim about the emissivity of CO2 "at normal pressures and temperatures". He may be misleadingly citing CO2's emissivity across all wavelengths rather than relative to wavelengths with significant thermal emissions at room temperatures, but then his claim is misleadingly phrased (at the least).
More to the point, IR microbolometers typically are tuned to the 7.5-14 micron bandwidth (ie, the atmospheric window as shown in the graph at 329). This is claimed to be the case by wikipedia, by Laser Focus World, and by Optics.org. While micro-bolometers can be, and have been tuned to other wavelengths, I have not found a single example tuned to dominant wavelengths for room temperature thermal emission which was not also tuned to the atmospheric window. Unless Satoh can provide citations with wavelengths specified in microns to at least one decimal place (or equivalently accurately specified frequencies), I have to suspect his claim is bogus.
"Your argument where you discount the N band because some days are cloudy is what we all know of as straw man argument. We obviously are not talking about cloud."
As we are discussing globally averaged emissions to space, the claim that clouds are a "straw man argument" can be dismissed as rather brazen bluster. That is, unless Satoh is going to seriously argue either that the Earth has no clouds, or that clouds no not absorb IR radiation ;)
-
Satoh at 16:13 PM on 15 November 2014CO2 effect is saturated
I suggest you familiarize yourself with all the bands. J, K and N are not the only ones. The newer microbolometers don't operate in the J or K band anyway, the energy consumed by the cryogenic cooling system proved prohibitive, even if you cool with liquid helium the weight would not permit use on drones. The newer ambient temperature microbolometers are sensitive to the entire range of CO2′s emission wavelengths and they work perfectly, due to the fact that at normal pressures and temperatures CO2′s emissivity is somewhere around 0.0019. The only thing operators ever worry about is water vapor, and never breathe a word about CO2, because the relative contribution of CO2 to skyglow is nill compared to H2O. Your argument where you discount the N band because some days are cloudy is what we all know of as straw man argument. We obviously are not talking about cloud.
-
One Planet Only Forever at 11:13 AM on 15 November 2014Fact check: China pledged bigger climate action than the USA; Republican leaders wrong
Another point to keep in mind about the planned USA emissions reductions is the choice by the US to talk about reductions relative to 2005 levels. Though European emissions in 2005 were not significantly lower than they were in 2005, the US emissions in 2005 were about 17% higher than 1990. So the US reductions of 17% by 2020 and 27% by 2025 may seem comparable to the EU reduction of 40% relative to 1990 levels by 2030, but it really isn't. The use of 1990 as the basis for reporting emissions does not 'suit the interests of the USA' since it deliberately increased its activity to benefit from burning the stuff after admitting such activity was unacceptable.
Canada behaved even worse. In 2005 Canada's emissions were more than 25% higher than they were in 1990. And Canada isn't even close to meeting the commitment made by its Conservative government, 17% reduction by 2020. And Canada's Conservative Government has not only failed to reduce Canada's emissions, they are pushing the sale of buried hydrocarbons from Canada to other places to be burned.
I am also a little suspicious that the agreement says China will have 20% of its energy from 'low carbon' sources. Why does that mean? Why does it not say '20% of its energy from sources that do burn fossil fuels'? Burning natural gas still produces half the CO2 impact of burning coal. But is 50% of the impact of coal, which really is still creating significant impact, what they mean by 'low carbon'?.
-
gws at 10:39 AM on 15 November 2014More research confirming large methane leakage from shale boom
Russ, you made a point, but your comments remain pushing a red herring.
While the natural sources in the global budget dominate, they are less constrained than the man-made sources. The review paper I suggested reading, which was published after the IPCC AR5 report, shows that the global wetland source is the one typically overestimated. Since the projections can only rely on the bottom-up models, and those are overestimating emissions mostly due to the natural wetland source, the projections are too high (models assume the wetland source to increase with increasing T).
The projection for the man-made sources was also slightly overestimated in the past, while the estimate for fossil fuel related emissions remained nearly constant (and the source was likely near constant in teh last 30 years), and one can speculate about why pre-AR5 projections did not take that into account (one reason is that most of this is very new research, not available before 2008). But that is irrelevant with respect to the renewed increase.
Using the fallacy of harking on a point at best remotely related to this article, you are seen as attempting to distract from the facts I outlined above. I consider that trolling and thus will not respond further to that line of "argument".
-
Tom Curtis at 09:46 AM on 15 November 2014Hansen's 1988 prediction was wrong
TallDave @24:
1)
"Emissions (especially of CO2) rose like Scenario A."
Not according to Gavin Schmidt at Real Climate:

Or Tamino at Open Mind:
Or Steve McIntyre at Climate Audit:
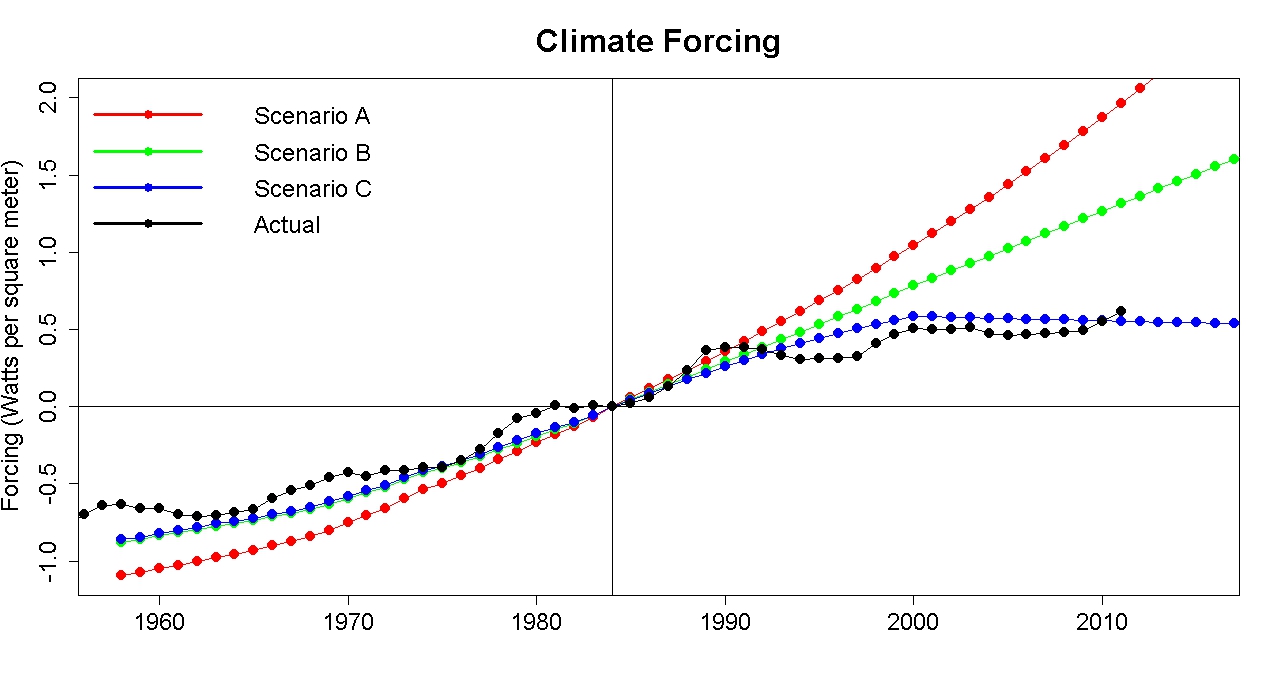
What distinguishes all four from TallDave is that they have actually consulted the concentration data for the three scenarios, and done the calculations and compared them to observed changes in radiative forcing. All show actual forcings due to greenhouse gases slightly less than that for Scenario B, with the exception of Tamino who compares to all forcings (except volcanic) and finds the result slightly less than scenario C. (Note: he is not in disagreement with the others, he merely makes a different comparison.)
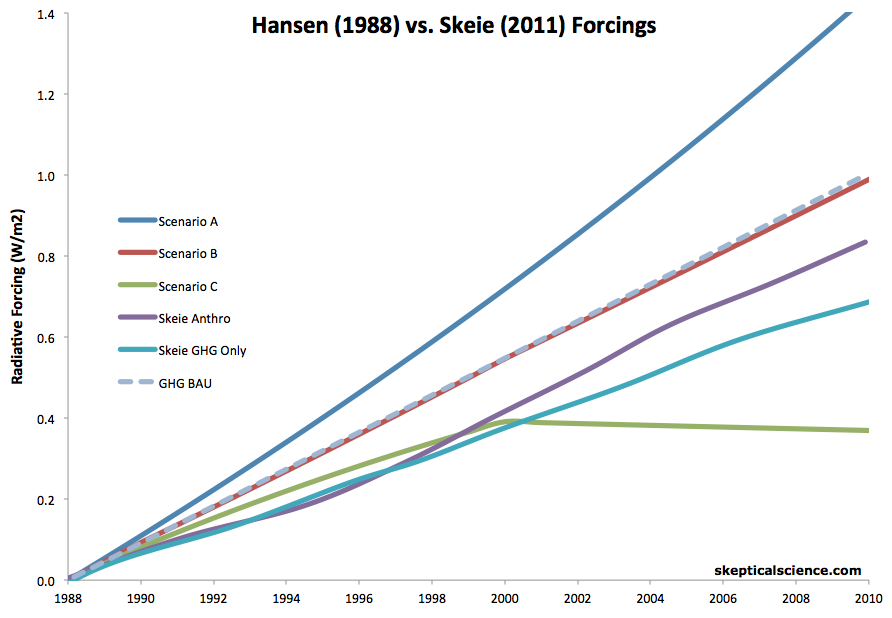
As can be seen from Steve McIntyre's graph, and in the following graph from Dana, while growth in CO2 (and NO2) was close to that predicted in Scenario A, growth in other greenhouse gases was way below that predicted for scenario A so that the total forcing was significantly less than that in Scenario A.
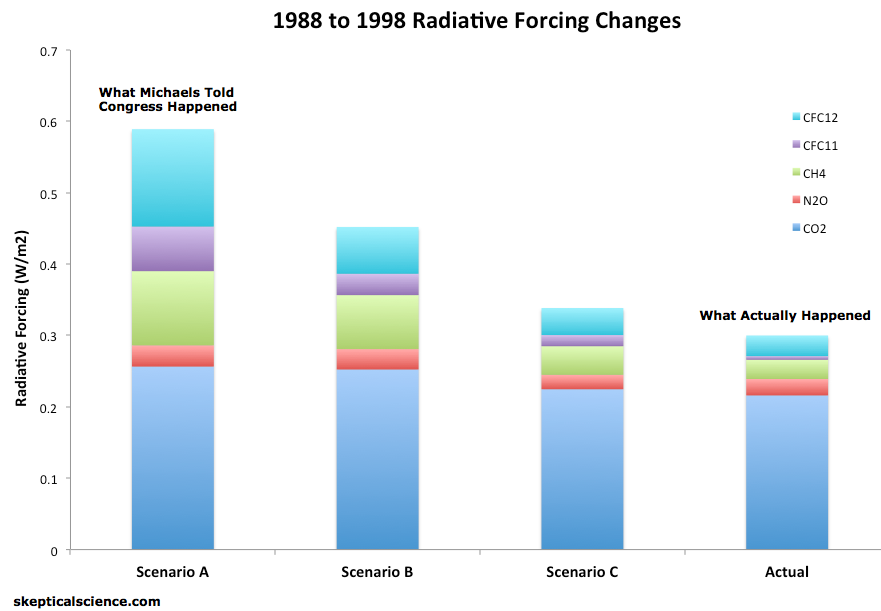
(Note with respect to Dana's graph: Hansen 1988 included the value of a host of minor greenhouse gases by the expedient of doubling the concentration of CFC 11 and CFC 12. Because Dana compares to the actual values of CFC 11 and 12, he leaves out these other minor gases. The actual growth in GHG radiative forcing is slightly greater than shown in Dana's graph.)
The growth in CO2 concentration is close, but not the same as that in Hansen's scenario A. Specifically, throughout the 1990s growth in CO2 was less than projected in scenario C. Since then, the growth rate has exceeded that in Scenario A so that concentrations have recently risen to about the scenario A level (and will soon exeed it if it has not already) - a pattern that can be seen in the EPA graph. The lower initial growth results in a lower initial radiative forcing, and hence a lower initial temperature growth that will not be eliminated for several years due to the thermal inertia of the ocean.
This is one of many topics in climate science where the common pseudo-skeptical opinion (as presented by Dave) cannot be honestly sustained except by the expedient of not checking the data. Comments such as Dave's are therefore always either insincere, or misinformed. Given the copious sources of information to the contrary, if misinformed by somebody who maintains some knowledge on the topic (as TallDave clearly does), then they are negligently misinformed.
2) TallDave quotes a small portion of the congressional testimony from a section of which I have already quoted at length. It comes just before the section I bolded, a section which makes quite clear that the the purpose in mentioning the scenarios was simply to explain the features of the graph, not to draw any conclusions from it. In other words, in response to my extensive quotation, TallDave's only response is a small out of context quotation that fails to address any of the points I raised. Therefore it requires no further refutation.
His rhetorical question regarding Scenaro C is shown to be less than candid by the fact that the common opinion of those who have analysed the data is that the observed GHG forcings most closely match scenario B.
3)
"Obviously because they're the only ones that can be tested on any meaningful time scale. Contra this site, the ability of a model to hindcast a highly complex phenemonen gives little confidence in its forecast (something painfully well-known in other fields)."
Contrary to TallDave's missinformed epistemology, there is no logical difference between forecasting and hindcasting. The only additional epistemic support to be obtained from successfull forecasting is forecasting is by its nature immune to overfitting the data. With GCMs, the number of parameters is very small relative to the number of predicted variables. That is not the case if you only pay attention to GMST, which is why pseudo-skeptics only consider GMST (plus a few other cherry picked data) for comparison to models, whereas climate scientists validate models against a large range of observed data. That is also, by the way why there is an approximately 15% mismatch between hindcast GMST model and observed trends over the last thirty years. The models are not fitted to obtain that result (for if they were, they could get a better match), but obtain that near match anyway.
Moderator Response:[PS] To all commentators on this thread. Please note the comments policy:
"No profanity or inflammatory tone. Again, constructive discussion is difficult when overheated rhetoric or profanity is flying around."
The tone in this thread is getting heated. Please step back, concentrate on the science and avoid throwing accusations around. This will ensure noone oversteps the mark.
-
Stephen Baines at 08:43 AM on 15 November 2014Hansen's 1988 prediction was wrong
"Stephen — Of course emissions are central to his testimony. Without the assignment of emissions scenarios, A B and C are just random points on a graph, chosen for no particular reason, with no relevance to policy."
Not if his main point, As Tom C points out, was establishing the role of humans in climate change to that point, and not on the future projections. TC has deliberated on the testimony itself. You should address his points, not simply make an assumption based on your impression of the role the graph must have played based on what is in it. I'm not saying that his presentation was not intended to get congress to act on emissions, mind you, just that his testimony focused on whether the observed temp change was human caused, and not on those scenarios.
"Exactly my point, thank you. Hansen made predictions about things he could not know."
As KR points out, he used what-if scenarios precisely because he could not predict future GHG development. That is the whole point of scenarios, and lack of certainty about the future is implicit in their use. Tell me, what would you do in this situation? Assume no change? That would be highly unlikely.
BTW...one scenario he didn't have involved a management decision (the Montreal protocol) that he himself would have approved of because of his model results. Does that mean he didn't think it was a good idea, or he didn't believe that such an action would have no effect on GHG forcing? Of course not. That would be akin to saying that because the model was right the model was wrong. Scenarios can't be thought of in that way.
-
Glenn Tamblyn at 07:42 AM on 15 November 2014CO2 effect is saturated
Satoh
The N Band is the only one relevent. J & K bands are at wavelengths too small to have any meaningful impact. They are used in Infrared Astronomy because they are studying stars. These obviously have surface temperatures much higher than the Earth so their Planck curves are shifted to lower wavelengths and the J&K bands then sit above regions of the planck curve where the intensity of radiation is significant. However at the Earth's temperature the amount of energy being radiated in those bands is utterly negligible. Look at the graphs Tom showed from SOD. 2.5 μm for one of those bads would be a wave number of 4000 - of the right of the graph where the intensity is utterly negligible.
Where I think you are perhaps tripping yourself up is just thinking about transmittance. What also has to be considered is how much energy is available at each wavelength. J & K bands allow 60-80% transmission; 60-80% of virtually nothing.
Also, even within the N band window, that still only allows 80% transmission in clear sky conditions. Under cloudy skies, clouds absorb across the entire spectrum and contribute to the GH effect. Clouds are estimated to contribute 25% to the GH effect. When there are clouds present transmission through the N band is essentially zero. Again what then escapes through the N bamd is reradiation from the clouds.
-
Russ R. at 07:41 AM on 15 November 2014More research confirming large methane leakage from shale boom
JH,
"Because at the time the scenarios were developed (e.g., the SRES scenarios were developed in 2000), it was thought that past trends would continue, the scenarios used and the resulting model projections assumed in FAR through AR4 all show larger increases than those observed (Figure 1.6)."
Projections > Observations.
Wrong.
Moderator Response:[JH] You link to the pdf of a report that does not include a title page. What is the title of the report and when was it published?
-
Hansen's 1988 prediction was wrong
TallDave - You appear to have rather completely misunderstood my comment and the graph therein (not putting the graph in this comment, as it's right up there in @22). Concentrations of GHGs are well below what would result from Hansen Scenario A, and in fact below Scenario C, and the concentrations listed in that graph for the scenarios is what results after emissions and after accounting for the carbon cycle in the model.
"Emissions (especially of CO2) rose like Scenario A" - False. Look. At. That. Graph.
CO2 has been reasonably close to the Hansen scenarios, in fact to all of them, because there is little difference (at this early date) between A, B, C, and observed CO2. But there have been far fewer emissions of CFCs, CH4, NO2, and hence lower total GHG concentrations remaining than in any of the Hansen scenarios. To a large extent the 1987 Montreal Protocol limiting CFCs is responsible for that difference, rather than cuts in fossil fuels.
"Hansen made predictions about things he could not know" Bzzzzt!!! You are attacking something other than the subject of Hansens climate model. Hansen made projections of climate response, not predictions of economic development, demonstrating the modeled climate responding to various GHG changes. The scenarios were presented to map the response space. He wasn't, and isn't, speaking in the business of economics, but rather in the science of climate. If the relationship between observed emissions and climate change match that of his model, then it's skillful.
Attacking a climate model because economic development and the ensuing emissions didn't exactly match the economic scenarios posed to map the input/output of those climate models is just absurd. That criteria would only be applicable to economic models, to economists, not climate science.
The best test is to run the model against observed emissions and see whether it matches observed temperature response, and [with the more correct CO2 direct forcing incorporated from Myhre 1998] Hansens model does that quite well.
-
TallDave at 06:57 AM on 15 November 2014Hansen's 1988 prediction was wrong
Stephen — Of course emissions are central to his testimony. Without the assignment of emissions scenarios, A B and C are just random points on a graph, chosen for no particular reason, with no relevance to policy.
"Hansen could not know that methane would show it's odd pattern over time"
Exactly my point, thank you. Hansen made predictions about things he could not know.
"You're argument for your fixation on old models doesn't ring true. More sophisticated GCMS produced later have plenty of new data they can be compared against."
I don't think you quite understand the problem. Models may produce any arbitrary amount of data, but reality produces one year of results to compare their predictions against per year, and that only after the prediction.
-
wili at 06:56 AM on 15 November 2014Fact check: China pledged bigger climate action than the USA; Republican leaders wrong
Writing "Republican Leaders" next to "wrong" is getting to be something of a tautology these days.
-
Stephen Baines at 06:48 AM on 15 November 2014Hansen's 1988 prediction was wrong
Tom C is not saying Hansen did not mention emissions, just that they were not central to Hansen's testimony, and did not figure into his main points which were about whether observed warming had happened and whether it could be linked to GHGs and therefore be tied to humans.
What matters in any climate model is the GHG forcing, which is a function of concentrations. Emissions affect that, but indirectly and in a lagged fashion, so the timing of emissions and their makeup affect the realized concentration.
Hansen could not know that methane would show it's odd pattern over time, that CFC's production would be curtailed by the Montreal protocol a few years later, and that the Soviet bloc would collapse, along with it's industry. Current emissions of CO2 in particular could be pretty high, but if the timing of those emissions was backloaded, you will not see the overall forcing.
You're argument for your fixation on old models doesn't ring true. More sophisticated GCMS produced later have plenty of new data they can be compared against. Nobody gauges what you can do with a current computer based on what the Commodore Amigo could do in 1988. That is a crazy idea.
-
TallDave at 05:44 AM on 15 November 2014Hansen's 1988 prediction was wrong
Tristan/KR — as I pointed out in my original post, you're making the usual mistake of confusing "emissions" for "concentrations" or "forcings." Again, Hansen made predictions explicitly based on emissons to Congress, see his full remarks in the pdf below. Indeed, the purpose of the hearing was to persuade Congress to take action on emissions.
Emissions (especially of CO2) rose like Scenario A. Don't take my word for it, ask the EPA:
http://www.epa.gov/climatechange/images/ghgemissions/TrendsGlobalEmissions.png
Tom: Here is the entire text of Hansen's remarks. Note this passage:
"We have considered cases ranging from business as usual, which is Scenario A, to draconian emissions cuts, Scenario C..."
http://image.guardian.co.uk/sys-files/Environment/documents/2008/06/23/ClimateChangeHearing1988.pdf
Surely no one seriously argues there were draconian cuts in emissions after 1988.
"Which leaves one wondering why purported skeptics spend do much time criticizing obsolete (by many generations) models."
Obviously because they're the only ones that can be tested on any meaningful time scale. Contra this site, the ability of a model to hindcast a highly complex phenemonen gives little confidence in its forecast (something painfully well-known in other fields).
-
ubrew12 at 05:30 AM on 15 November 2014Fact check: China pledged bigger climate action than the USA; Republican leaders wrong
Two further points to bolster Dana's case:
1. China's carbon footprint is only 1/4th America's.
2. The EU has already pledged a 2030 target of 40% (down from 1990 levels). Hopefully, all these falling domino's will encourage more commitments.
-
Satoh at 04:47 AM on 15 November 2014CO2 effect is saturated
The irony is that you would include a graph that shows 80% transmittence in the N-Band (8 to 13 microns) which is a big fat region smack in the middle of the strongest part of earth's radiation curve, and use it as part of your argument that Trenberth's 10% figure, of blackbody surface radiation making it to space, is correct. I won't link to the article on the N-Band in Wikipedia, I'll let you do it, but if you add that to the J Band and the K Band, I just don't believe it's only 10%. There are more windows in the atmosphere than there are in Notra Dame. If we account for clouds, which cover roughly half the sky, then the figure would be 20%, half blocked by cloud, but that still seems way too low.
-
wili at 04:08 AM on 15 November 2014New study shows warm waters are melting Antarctica from below
Thanks for another great article from JA. Toward the end he says: " I have a paper in press with Dr. Ted Scambos that identifies the potential for rapid sea level rise based on Antarctic melting."
I, for one, look forward for this update, though not without some dread!
-
DSL at 04:07 AM on 15 November 2014The Debunking Handbook: now freely available for download
Actually, graafderaaf, you've apparently failed to read the Handbook. It is not based on the 97% consensus. The 97% graph is used to illustrate one method (of many noted) of working with the general public.
-
DSL at 04:01 AM on 15 November 20142014 SkS Weekly News Roundup #46A
GISTemp is out for October: .76C — tied for warmest October on record (2005). 2014 is on track for warmest year on record. Sept-Oct ENSO (MEI) = .36.
-
One Planet Only Forever at 03:34 AM on 15 November 2014Fact check: China pledged bigger climate action than the USA; Republican leaders wrong
Predictably the claims by the Republican leadership-of-the-moment have little merit, just potential popular appeal. After all, they are trying to promote activity that has no real merit, just potential short-term popular appeal.
Those who only care about getting the best possible present benefit for themselves are the real problem. They will constantly fight to try to win what they want any way they they can get away with. A better future is of little interest to them. And fighting to keep others from 'developing to live the way they do because there is not enough opportunity for everyone to live that unsustainable damaging way' is an obsession for them. And in many cases the actions that would develop a sustainable better future for all of humanity are contrary to 'their interests'.
A lack of interest in the development of a sustainable better future for all clearly has a potential for short-term competetive advantage and potential regional popular support. And the damaging consequences of those attitudes and actions continuing to succeed is becoming clearer. Yet they remain 'popular and profitable'. Their popularity and profitability is what needs to change and that will only happen with the success of decent reasonable leadership examples. Other types of leadership succeeding will be unsustainable and damaging as much as they can get away with.
-
Russ R. at 02:33 AM on 15 November 2014More research confirming large methane leakage from shale boom
CBDunkerson,
You're evading the question.
The SRES Scenarios are "If-Then" statements. If the world's population and economies play out a certain way, then emissions will be a certain amount. In your own words:
"If X then Y. Not, 'the result will be Z'."
One again, and for the record, I'm saying that the IPCC overestimated methane emissions (for whatever scenario we can test), or residence time, or both. And they admit that they got the trend wrong.
So, as it stands today, methane is turning out to be not as big a climate issue as we were told it would be.
Moderator Response:[JH] You assert that the IPCC admits "that they got the trend wrong" re methane emissions. Please document with specific source reference or references.
-
Tom Curtis at 02:29 AM on 15 November 2014CO2 effect is saturated
Satoh @327, I was going to quote exactly the same secton from wikipedia as Glenn. To make the point clearer, however, here is the IR atmospheric transmittance from wikipedia:

You will notice that both IR camera frequency bands (3-5 micron and 8-12 microns) have relatively high transmittance. Indeed, the average transmittance over the 8-12 band is probably better, but atmospheric radiation is very low in the 3-5 micron band making it more suitable for long distance viewing. The difference between the two bands is that between looking through fog (3-5 micron) and looking through a glowing fog (8-12 microns).
The irony of your argument is that the chief database of emission frequencies for atmospheric gases (the HiTran database) was generated by the USAF in order to determine which frequencies were suitable for IR cameras (and heat seakers) and which were not. Having constructed their cameras using information from that database applied to radiative models equivalent to those which show the greenhouse effect (as shown above), you now cite the effectiveness of those cameras as disproof of the database and theories used in constructing them.
-
bcglrofindel at 02:20 AM on 15 November 2014IPCC overestimate temperature rise
Alright, found the proble is with units. The EPA is Pg/CO2 and the IPCC is PG/C, so a conversion factor of about 3.7. Mystery solved.
-
Glenn Tamblyn at 02:17 AM on 15 November 2014CO2 effect is saturated
Satoh from Wikipedia on the subject of FLIR
"Infrared light falls into two basic ranges: long-wave and medium-wave. Long-wave infrared (LWIR) cameras, sometimes called "far infrared", operate at 8 to 12 μm, and can see heat sources, such as hot engine parts or human body heat, a few miles away. Longer-distance viewing is made more difficult with LWIR because the infrared light is absorbed, scattered, and refracted by air and by water vapor. ...
Medium-wave (MWIR) cameras operate in the 3-to-5 μm range. These can see almost as well, since those frequencies are less affected by water-vapor absorption, but generally require a more expensive sensor array, along with cryogenic cooling."
Contrast this with Tom's just posted graph. 8-12μm is the 'atmospheric window' plus a bit of the H2O absorption bands on either side. No involvement from CO2. And virtually no backradiation since that only occurs at wavelenths where the GH gases can absorb and thus emit. And 3-5μm is completely off the graph to the right.
FLIR works precisely because it works around the absorption properties of the GH gases. Your belief that " FLIR operates at all wavelengths that CO2 emits" is incorrect.
And Back Radiation isn't something to be believed in or not. It is something routinely and directly observed.
-
bcglrofindel at 02:12 AM on 15 November 2014IPCC overestimate temperature rise
@KR in 57,
sorry, still confused. I was understanding that models were based upon concentrations versus emissions or forcings? Concentrations being derived from net expected emissions, and forcings being derived from concentrations?
-
bcglrofindel at 02:10 AM on 15 November 2014IPCC overestimate temperature rise
MA Rodger,
Thanks for that. I'm second guessing my reading of the IPCC CO2 emission numbers for scenarios now though. As per your post I compared the FAR to actual as per prior links and concluded as you that absorption was since adjusted. I went to look what that adjustment looked like and instead find that even the AR5 has nonsensically low CO2 emission numbers per Table AII.2.1a. We are looking at 2010 emission numbers of ~8 Petagrams across all scenarios for 2010 and future projections ranging from below zero but in no circumstances exceeding 29 Petagrams. I'm gonna go out on a limb and assume the IPCC did look at current numbers before picking the 2010 values and would have noticed if the actual human emissions matched the EPA's aparently observed numbers already exceeding 25-30 Petagrams.
So my question is, if the EPA numbers are out, were would one find actual historicial fossil fuel emission numbers to reference correctly? Everything I can google comes up like the EPA numbers, but from the IPCC numbers in their 2013 report that simple can't be the same numbers the IPCC is working from.
-
Stephen Baines at 02:07 AM on 15 November 2014The Debunking Handbook: now freely available for download
"The general public does not trust climate scientists and with good reason because advocating disaster can have great career prospects."
As a working scientist, this is simply a crazy notion. If anything, scientists tend to be conservative to avoid seeming "unobjective" to their peers. And it is to their peers that they must answer.
-
IPCC overestimate temperature rise
bcglrofindel - As Bob points out determining forcings is part of the modeling process, albeit done for FAR with feed-in models such as line-by-line radiative codes and simplified carbon cycle models (See FAR chapter 3 on modeling). The scenarios for FAR and in fact for current IPCC summaries are based on emissions, not forcings.
As to the latter part of your comment, I'm not certain what you're asking, although that may just be my (mis)reading. I will point out that CO2 isn't the only driver of climate, and there were significant differences in other influences between the FAR scenarios and actual history such as CFC levels.
-
Satoh at 01:54 AM on 15 November 2014CO2 effect is saturated
Glenn, the images I am talking about are generically known as FLIR which means Forward Looking IR. It's an old-fashioned military term for heat seeking and visualizing equipment that goes back many decades. There are many FLIR cameras / sights on many types of military weapons, where an enemy soldier's human form can clearly be seen using only the IR that he radiates. All objects that emit IR are as clear as if a light camera were taking them, and you can identify humans, tanks, hot weapons (and their ammunition) from 20,000 feet elevation. I don't see how this is possible if the atmosphere absorbs and re-emits IR. I believe FLIR operates at all wavelengths that CO2 emits. I believe that CO2 absorbs IR and turns it into kinetic heat. I do not believe in back-radiation in the troposphere, otherwise FLIR would not work at all.
-
Tom Curtis at 01:39 AM on 15 November 2014CO2 effect is saturated
Satoh @322:
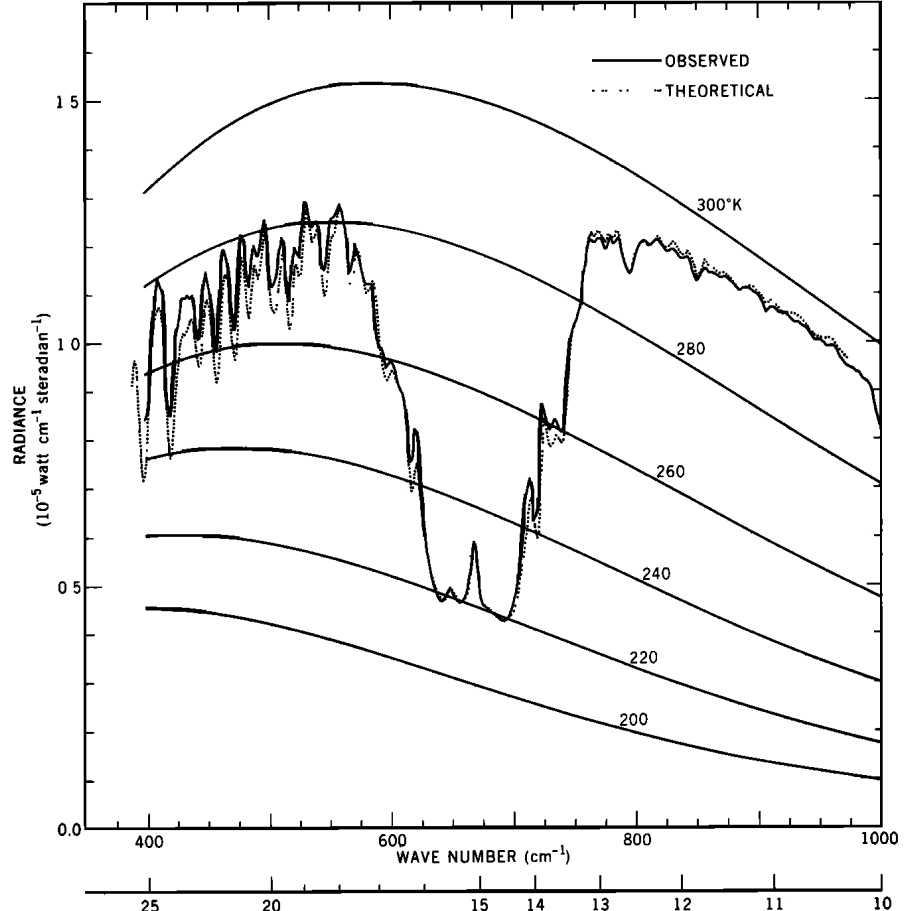
First, the graph I used was just a highlighted region used to show the agreement between model and observation closely. As Glenn correctly notes, it is one of three graphs in the original paper, two of which is shown by Science of Doom, including this one:

Second, Science of Doom also developed his own Line by Line model, and used it to calculate first the upward IR radiation at various altitudes with a clear sky:

And then just the transmitted upward IR radiation from the surface:

The light blue shows the transmission to 22.8 kilometers of altitude, ie, effectively to space. Except for very small amounts, almost all of it comes from the 750-1350 wave number "atmospheric window", in which around 90% of surface emitted IR radiation transits the atmosphere. Overall, there will be slightly more than 17% (=40/239) of surface radiation will be transmitted averaged over the Earth in clear sky conditions. That is because no IR radiation from the surface penetrates clouds. Taking clouds into account, the total is reduced to approximately 17%.
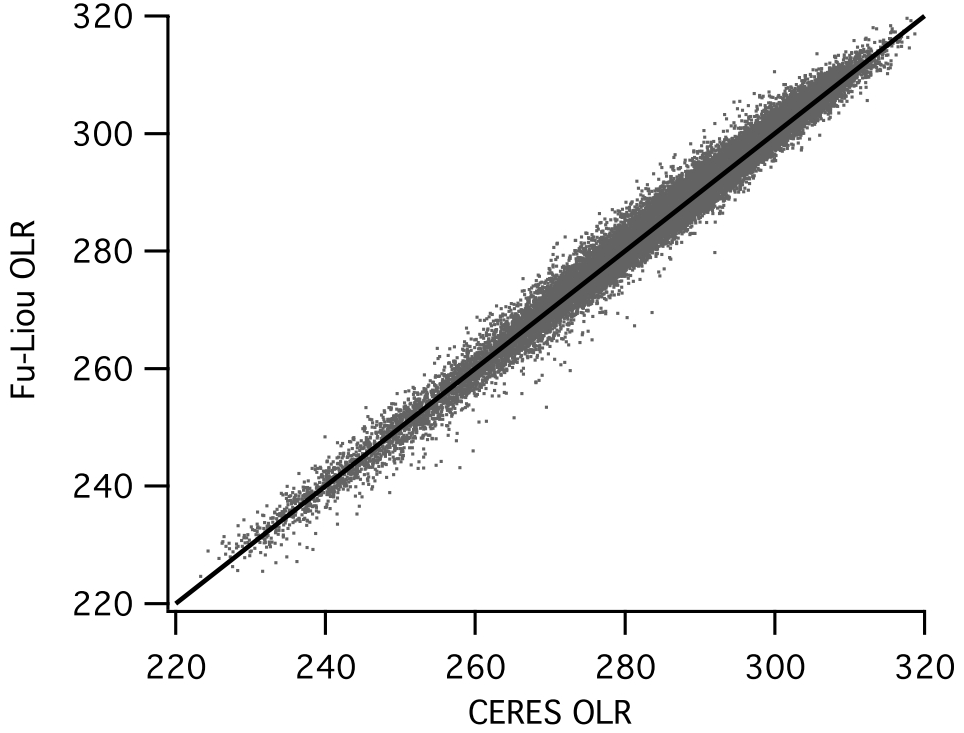
It should be noted that SOD's model does not differ on any principles relative to the models that produced the predicted result in Conrath et al (1970), nor those that produce so good a match to observations as shown in the scatterplot of 134,862 model/observation comparisons by Dessler et al (2008). Those models of prove accuracy, therefore, will produce equivalent results if atmospheric emission is eliminated from them as well.
Your mistake is to assume that the IR radiation to space consists of the surface emission minus atmospheric absorption. It is, however, overwhelmingly the result of atmospheric emission, with nearly all (90%) of surface emission being absorbed in the atmosphere.
IR satellites are able to produce usefull images because their IR sensors are tuned to the atmospheric window where only about 10% of surface emission is absorbed. Indeed, they will be tuned to the precise frequencies in which absorption is at a minimum. Even so, they do not see through clouds and have a degraded performance relative to optical cameras.
-
PhilippeChantreau at 00:33 AM on 15 November 2014The Debunking Handbook: now freely available for download
Graafderaaf, a common pseudo-dkeptic argument is that there is disagreement among scientists on the subject. Closer examination reveals that there is no significant disagreement, in fact less so than many other scientific subjects.
Can you explain how exactly advocating disaster helps with carreer propects? I recall Sallie Baliunas predicting "trillions" of dollars of losses and economic mayhem as a result of the CFC ban to protect the ozone layer, how has that helped her carreer?
-
Dikran Marsupial at 00:09 AM on 15 November 2014The Debunking Handbook: now freely available for download
graafderaaf not that old canard again. Nobody is using the existence of a consensus as a scientific argument for the existence of anthropogenic climate change. If you look around the myths discussed here, you will find that we base our arguments on peer-reviewed scientific articles. If you disagree with any of them, then I would encourage you to post a comment on a relevant topic explaining your scientific objections.
The existence of a consensus ought to be a good way of communicating expert opinion on more or less any scientific topic, as it shows you what the mainstream scientific position actually is. Ignoring the opinion of qualified people is hubris and folly of the highest order.
As to career prospects, I think you ought to do some research to find out how much academics get paid, it isn't actually all that much when you think how long they spent earning the qualifications and compared to how much management in industry earns for similar levels of responsibility, or qualifications (e.g. actuarial salaries).
It is ironic that you complain about faulty reasoning and then procede to use an ad-hominem! ;o)
-
CBDunkerson at 23:03 PM on 14 November 2014More research confirming large methane leakage from shale boom
Russ, I repeat the quotation from the IPCC report;
"Because at the time the scenarios were developed (e.g., the SRES
scenarios were developed in 2000), it was thought that past trends
would continue, the scenarios used and the resulting model projections
assumed in FAR through AR4 all show larger increases than those
observed (Figure 1.6)."So, none of them aligns with methane emissions since 1990. Of course, you ask which of those scenarios best aligns with other factors... but that is obviously irrelevant to methane levels.
My best guess is that you are trying to 'prove' that the trend in methane emissions relative to economic development decreased for several years. However, as the IPCC report actually says that, I'm not sure what you think you have 'uncovered'.
-
Glenn Tamblyn at 21:54 PM on 14 November 2014CO2 effect is saturated
Satoh
"The argument given here only addresses "d" and ignores "a-c" and "e". In fact, the vast majority of radiation to space from earth is from "a"
Not true.
"a. blackbody radiation from the surface which radiates directly into space through the many windows in the spectrum where the atmosphere is transparent to IR."
There aren't many windows. There is a recognised region around 10-11.5 microns labelled the Atmospheric Window where tranmission through the atmosphere is nearly total. Across the rest of the spectrum absorption is nearly total. What we are seeing in graphs like what Tom has shown is predominantly not transmission. It is reradiation.
-
graafderaaf at 21:42 PM on 14 November 2014The Debunking Handbook: now freely available for download
The example used in this book is terrible!
If you want to convince the world about climate change being caused by humans you don't make the argument based on that 97 out of a 100 climate scientist agree with that statement!
The general public does not trust climate scientists and with good reason because advocating disaster can have great career prospects.
You have to use real arguments.
Moderator Response:[PS] Please read the comments policy on this site. If you make sweeping statements like above, then please provide support for your argument. Further wild rhetoric like this will be deleted.
-
Glenn Tamblyn at 21:41 PM on 14 November 2014CO2 effect is saturated
Satoh
"The irradiance chart, on the other hand, clearly shows that much of the spectrum has high transmission of IR through the atmosphere, with the exception of a big CO2 band from 13 to 18 microns"
This is a common misunderstanding. Take the region on the left of Tom's second graph, to the left of wavenumber 600. That is a region dominated by water vapour absorption/emission. And not that the intensity corresponds to a Planck curve with a temperature below 280 K. I.e, well above the surface.
What you are seeing there is not IR that has been transmitted through the atmosphere. Water vapour absorbs virtually all the IR leaving the surface. The transmittance is negligible. What is being measured there is IR radiated from higher in the atmosphere. It is not transmitted through it.
Siimilarly the CO2 region represents again near total absorption the reradiation at higher altitudes. Much higher than the altitude the signals from the water band are coming from so much colder. So the intensity is so much lower. Look at the spike in the center of the CO2 'notch'. That corresponds to an altitude so high that it is in the upper stratosphere where temperatures are actually warmer. The detailed shape of the CO2 'notch' is a direct reflection of the verticl temperature profile of the atmosphere.Tom's 'graph' is actually taken from an observations based paper from 1970. It is one of three such graphs provided by that paper and covers a larger frequency range, but still ultimately limited by the operating range of the instrument on the Nimbus 3 satellite.
Your earlier comment "That would only be true for blackbody Planck radiatiors. CO2 is a gas and does not emit blackbody radiation. "is only partly correct. A gas does not radiate as a black (or even grey) body in that it does not radiate a continuous spectrum with a Planck Function shape. It only radiates over a narrower range of discrete frequencies. However, at those frequencies the intensity of the radiation emitted by the gas does match the strength of a black body at that frequency.
Yo are making a claim that the ability to discern continents in IR suggests relatively high transmission. However you haven't backed up that assertion.
- What part of the IR spectrum is being used in these observtions?
- What sort of signal processing is being done to the data to allow discrimination of the continents? Do you know that it is being done with raw data?
- Even if there is no signal processing, is the fact that a portion of the signal does transit all the way to space, even if only 10%, provide sufficient discrimination to allow boundaries to be detected.
- Unless the sea and closely adjacent land are at significantly different temperatures, how different will they appear on a raw R plot and thus how visible would any boundary be?
- When we see boundaries in visible light for example we are seeing differneces of intensity, colour, polarisation etc. that form a composite means of detecting boundaries. Is there the same discrimintion available in IR data.
- Do the images of continents men what you thing they mean? I don't know that answer, I am just posing the question.
Trenberth's 'cartoon calculations' aren't his. That paper amalgamates measurements from many different sources to produce that composit picture.
And Tom's pont about your misunderstanding Wien's Displacement Law is spot on. Look at his figure 2. Pick any wavelength and compare the magnitude of the different Planck curves shown. Where do any of them show a higher intensity for a lower temperature at any single wavelength? A cooler Planck curve always lies below a warmer one, at all wavelengths. -
MA Rodger at 20:15 PM on 14 November 2014IPCC overestimate temperature rise
bcgirofindel @53.
Adding to other comments here, as you show, recourse to FAR WG3 does easily yield emissions (as per tables 2.8) which for CO2 in all scenarios, project values lower than outcomes so far. Yet, to convert emissions into forcings you require to establish atmospheric concentrations which in FAR for CO2 can be gleaned from WG3 Figure 2.2. My reading of it suggests the 400ppm is passed by Scenario B in 2015, an event that now looks certain to occur.
The different outcome between the emissions comparison and concentrations comparison tells us that 25 years ago FAR were a bit out calculating CO2 absorption rates. -
Tristan at 19:47 PM on 14 November 2014CO2 effect is saturated
Every time someone throws issues a challenge to Mr Curtis, I want to get pretzels, his science-powered takedowns are exquisite.
-
Satoh at 18:36 PM on 14 November 2014CO2 effect is saturated
Your first two graphs disagree with each other. The first graph says only 40 W/m2 out of 396 are emitted directly through atmospheric spectral windows, which is only 10%. The irradiance chart, on the other hand, clearly shows that much of the spectrum has high transmission of IR through the atmosphere, with the exception of a big CO2 band from 13 to 18 microns. Your radiance chart is incomplete by the way, because it only goes from 10 microns to 25, when the earth radiates from 7 to 100 microns. The complete chart spectrum, from 7 to 100, shows very little absorption by the atmosphere from 7 to 13 microns, and again very little absorption from 18 to 100, which is a big enough part of the spectrum for me to know that Trenberth's figure of 10% is extremely low. I don't believe it. The large amount of radiance to space from earth surface, through windows, is evidenced by the fact that IR images of earth taken from satellites show surface features such as continents and islands, lakes, etc, which would not be visible if 90% of the IR is absorbed by and re-emitted by the atmosphere. A 90% atmospheric interference of IR would mean the atmosphere is basically transleucent to IR, and IR cameras in satellites would not show continents, etc, but would show nothing but a featureless haze. I don't buy Trenberth's cartoon calculations at all.
-
Tom Curtis at 16:18 PM on 14 November 2014CO2 effect is saturated
Satoh @329:
1) The term "saturated greenhouse effect" has a long history, and is well understood. "Extinction" refers to the point at which no radiation from the original source remains - which is a different concept. The greenhouse effect is claimed to be saturated by the misinformed due to the fact that radiation from the Earth's surface is extinguished in the 15 micron band at very low levels (which is a non-sequitur on a variety of grounds).
Confusing the two terms only confuses the issue, leading the gullible to believe that the greenhouse effect cannot become stronger with increased CO2 concentration (ie, it is saturated) because IR radiation from the Earth's surface at 15 micron is in fact extinguished low in the atmosphere. The two are not the same thing.
2) I do not believe the article leaves that impression. (Which, article by the way? I assume you mean the basic article.) However, to the extent that it does, it is only because it is discussing the claim that the greenhouse effect is saturated because IR radiation from the surface at 15 microns does not escape to space. Because that is the argument which is being responded to, of course attention is focussed on CO2.
Working through the list, you claim that "In fact, the vast majority of radiation to space from earth is from "a"", which is simply false. Here is the partition of energy flows by Kiehle and Trenberth, 2009:

As you will notice, only 40 W/m^2 out of 249 W/m^2 of the IR radiation to space comes directly from the planets surface. A further 30 W/m^2 comes from cloud tops. Of the remaining 179 W/m^2, all of it comes from the atmosphere, but most of it will come from water vapour. However, as the greenhouse effect works by replacing a high IR flux from the surface with a lower IR flux from the atmosphere at certain wavelengths, the lower the IR contribution from a given gas, all else being equal, the stronger the greenhouse effect caused by that gas. The argument that CO2 is of relatively little importance because it contributes relatively little to the total IR flux has the relationship exactly reversed, and shows a lack of understanding of the greenhouse effect.
3) (@320), first and most generally, you are in complete disagreement with line by line radiation models. They assume atmospheric gases are grey bodies and calculate emissions and absorptions spectral line by spectral line, and produce results, when compared to observations like this:
And like this:
If you will excuse me, I will accept such a well confirmed theory as that presented by LBL models over the bad theory of "random internet guy".
More specifically, you are using Wein's displacement law incorrectly. It points out the wavelength (or frequency) of the peak radiation for a given temperature of a black body. It does not indicate the temperature of peak emission for a given wavelength (or frequency). In fact, for black bodies at any given wavelength, the emission at that wavelength will be greater at higher temperatures in all cases:

Because CO2 molecules in the atmosphere gain the energy that they emit by molecular collision, the intensity of radiation at the frequencies in which it radiates follow the black body laws. Therefore decreased temperature will decrease emission from CO2 at 15 microns even though it approaches the temperature at which 15 microns is the wavelength of peak emission for a black body. Indeed, it will continue to do so until molecular collissions occur at a frequency much less than the frequency of reemission of absorbed radiation, or until the temperature is much less than 200 K (so that thermal emission can be neglected).
Prev 648 649 650 651 652 653 654 655 656 657 658 659 660 661 662 663 Next


