


 Arguments


Recent Comments
Prev 773 774 775 776 777 778 779 780 781 782 783 784 785 786 787 788 Next
Comments 39001 to 39050:
-
barry1487 at 12:05 PM on 28 January 2014Australia’s hottest year was no freak event: humans caused it
Daytime cloudiness data at BoM website starts at 1957. Might be useful get a longer term estimate of solar exposure.
Thanks for the update and fair comments. Openly admitting doubts and errors and self-correcting are rare enough virutes in these debates.
-
gws at 10:13 AM on 28 January 20142014 SkS Weekly News Roundup #4B
An then there was this interesting story in the NYT:
-
Tom Curtis at 10:00 AM on 28 January 2014Australia’s hottest year was no freak event: humans caused it
Barry @41, a Watt equals one Joule per Second. The units for the solar exposure are in Megajoules per day per meter squared. Therefore multiplying by one million then dividing by 86,400 (24 x 60 x 60) converts to Watts per meter squared. I originally thought the units were Megajoules per annum per meter squared, and further divided by 365. Correcting for that error, the maximum possible forcing from solar exposure is then 21.8 W/m^2. That is the figure before correction for albedo, and for loss of greenhouse forcing due to reduced cloud cover and water vapour content in the atmosphere. It is, however, sufficiently large that I cannot argue for a small relative effect without quantifying those values as I did in my prior post.
Here is an albedo map for Australia:

The data is from Modis, and full global maps are available here.
It is hard to derive an exact value, but as yellow, which predominates, represents an albedo just greater than 0.3, and as orange to red areas (3.5-4) are more extensive than green areas (0.2-2.5), I think an average albedo of 0.3 for Australia is a conservative estimate. That reduces the transient forcing from the high solar exposure (low cloud cover) over Australia in 2013 to approximately 0.7 x 22, or to 15.4.
Further, the high solar exposure is due to low cloud cover, which reduces the greenhouse forcing due to clouds over Australia during that period. The solar exposure was 9.6% greater than normal. As the increased solar exposure was due to low cloud cover, that represents approximately a 9.6% reduction in cloud cover. Globally, single factor removal of clouds removes 14% of the total greenhouse effect, or 21.7 W/m^2. Therefore removal of 9.6% of clouds would remove 2.1 W/m^2 of the greenhouse effect. A similar reduction in WV content would remove just over twice that amount, but that does not allow for the overlap between WV and clouds. Single factor removal of Water Vapour and clouds at the same time removes 103.7 W/m^2 of forcing. Removing just 9.6% of that removes 10 W/m^2.
Combined, these two effects will bring the net transient forcing from increased solar exposure in 2013 to about 5 W/m^2. Clearly the error margins on this calculation are large. Without exact information on cloud content, water vapour, temperatures and access to a climate model, I do not think I can significantly lower them.
The final factor that comes into play is the lag in increase in temperature. It takes around 60 years for 66% of the final temperature response to a forcing to come into effect, and over 200 years for the full effect to be felt. Consequently a transient forcing over one year will not have the same temperature effect as a long term forcing that has been in existence for much of a century. The initial rise is rapid, however, especially over land. Therefore, while we would expect a transient forcing of 5 W/m^2 to not have had the same temperature response as a long term forcing of 5 W/m^2, it may have had the same, or greater response 2.3 W/m^2 (ie, the effective radiative forcing from anthropogenic activity).
The consequence of this is frustrating. Bruiser will not be convinced, and nor should he be convinced, by this that he is wrong in attributing most of the increased temperature to the high solar exposure. The error margins are too large. Neither should he be convinced from this that he is correct, for the same reason. I have tried to be conservative in my calculation, and to the extent that I have succeeded, that means it is more likely that the errors will have favoured his case rather than undermined it, and therefore, that an error free calculation would show his case to be wanting. Therefore I do not believe we can use direct calculation of the transient forcing to further the discussion (contrary to what I attempted).
This does not mean Bruiser should not be persuaded by the first part of my discussion (and by your comments). The fact is that the difference in temperature between years in the late twentieth and early twenty first century is much smaller than the difference in temperature between those years and years in the early twentieth century. That is not explicable in terms of solar exposure. It follows that while solar exposure is (very convincingly) the primary reason why 2013 was hot relative to 1990-2013, it is not the reason why 1990-2013 was hot relative to 1910-1939. Nevertheless, I would now like to analyze Australia's solar exposure data to determine if it has a trend; and what the relationship is between solar exposure and temperatures over recent years to strengthen (or refute) that case.
-
Kevin C at 07:47 AM on 28 January 2014Cowtan and Way: Surface temperature data update
Actually BEST are doing monthly updates, although usually a month or two behind the others. I hadn't been picking them up for the trend calculator until a few weeks ago, which may have given the wrong impression.
-
Andy Skuce at 06:24 AM on 28 January 2014Cowtan and Way: Surface temperature data update
There is a post by Stefan Rahmstorf just out at RealClimate. He compares Cowtan and Way's temperature series with GISS and NOAA NCDC as well as HadCRUT4. His ranking of the warmest years of C&W's series is based on their Version2 rather than the Hybrid method.
-
CBDunkerson at 03:57 AM on 28 January 2014Cowtan and Way: Surface temperature data update
While it would be great to have additional papers which might make a 'splash' and help penetrate public consciousness, I can certainly appreciate your reluctance to put in that much extra effort.
Have you heard anything from people working on the other anomaly series as to whether they are considering implementing some of your adjustments? That would certainly also be a major accomplishment as the data from the large institutions will undoubtedly remain the most frequently referenced. That was one thing which bothered me about the 'BEST' project. They pulled in some additional data and introduced new analysis techniques which might be beneficial, but then they didn't continue projecting and none of the other data sets seem to have used anything from their study to improve results.
-
Rob Honeycutt at 02:11 AM on 28 January 2014There's no correlation between CO2 and temperature
tkman0... Don't let Tom fool you with his humility. He is probably the best informed non-researcher I've ever had the pleasure to come across. While actual researchers are likely to have a deeper understanding of their own area of the science, Tom probably has the broadest knowledge of climate of anyone I've seen.
-
Kevin C at 02:09 AM on 28 January 2014Cowtan and Way: Surface temperature data update
Ideally we'd write more papers. However, one of the main reasons for writing a paper in the first place was that it was the only way to draw the attention of the community to the problem. So to some extent if we can now communicate sufficiently well to the community through the project website and blogs then writing papers becomes less important.
Of course papers are important for the scientific record, but if the main temperature record providers update their work in response to the issues we raise it'll be recorded in their publications.
Doing a peer-reviewed paper in your spare time in someone else's field is a killer. We've probably got enough material (including unreleased results and work in progress) for at least another 2 papers, but I'm not sure I can face writing them.
-
John Hartz at 02:02 AM on 28 January 2014It's cooling
tkman0: Suggest that you invite your friend to post his/her concerns here on SkS. there really is no need for you to play the role of middleman.
Moderator Response:[TD] But please inform your "friend" to keep each of his/her comments narrowly on one topic, to post each comment on an appropriately narrow thread, and to read the original post to which that thread is attached before writing the comment. I strongly suggest your friend not write any comments until after reading The Big Picture followed by The New Abridged Skeptical Science Reference Guide.
-
CBDunkerson at 02:00 AM on 28 January 2014Cowtan and Way: Surface temperature data update
This is great stuff. As the uncertainty bands around the temperature anomaly series shrink, that may help make it easier to precisely identify the factors contributing to short term variations.
It seems like this is changing from a one time re-analysis of the anomaly data (ala the 'BEST' project) into a new ongoing data set. Are there likely to be additional papers published documenting the ongoing analysis and changes or will that information only be documented on the project website?
-
barry1487 at 01:34 AM on 28 January 2014Australia’s hottest year was no freak event: humans caused it
Would you lay out the conversion/time in some detail when you post?
-
Tom Curtis at 00:15 AM on 28 January 2014Australia’s hottest year was no freak event: humans caused it
Please note that I have reviewed my figures in construcing the graph @35 and detected an error, specifically I treated them as annual values when they should have been treated as annual averages of daily values. A apologize for that error. That means all of my post from the words "To try and resolve that question" is either false, or unsupported at the moment. I will try to extend my analysis to tackle the issue more accurately, but may take a day or so to do so. Once again, I apologize for the error.
-
barry1487 at 23:29 PM on 27 January 2014Australia’s hottest year was no freak event: humans caused it
CB, I believe 2.3W/sq M refers to the accumulated anthropogenic forcing since 1750.
Bruiser, have you been skimming the replies to you?
Your argument that there have been hotter years with lower solar radiation whilst factual does nothing to prove your case. By your logic, temperatures should have increased every year since 1998 as the world has added billions of tons of Co2 since that time.
There is no logic to that point at all, it's merely an assertion to the inverse. No one is arguing that interannual variability (weather) is meant to cease when CO2 rises in the atmosphere. To the contrary, in his last post Tom said,
The idea is that there are many short term factors that influence annual temperatures. As a result temperatures may be warmer, or colder from year to year - but always within a limited range.
The point Tom and the authors are making is (in Tom's words);
...Long term factors, such as increased atmospheric forcing from CO2, however, can shift the mean of that range, allowing temperatures that we would never have seen otherwise.
Everyone is agreed here that annual temps will not monotonically respond to anthropogenic forcing. Solar exposure will have some impact, of course, even a major one in extreme years (high and low), but you are the only person trying to argue that this is the dominant factor, seemingly to advance the notion that last year's record-breaker was just a result of natural variability. But if 2013 solar exposure had an impact of 0.06 W/sq M above average, and accumulated anthropogenic forcing has had a long-term impact of 2.3 W/sq M, which is the greater contributor to the record temperature of the most recent year?
-
CBDunkerson at 22:39 PM on 27 January 2014Australia’s hottest year was no freak event: humans caused it
bruiser, looking only at the CO2 increase from 2012 to 2013 deliberately ignores the vast majority of the warming caused by CO2. No one is claiming that the CO2 increase from that single year caused the recent high temperatures in Australia. That's a ridiculous straw man. Rather, the CO2 (and other greenhouse gas) increases over the past century plus have caused massive warming world-wide... without which the recent record high temperatures would not have occurred.
Tom Curtis's graph comparing the solar forcing for last year against the total accumulated CO2 forcing would be better if it instead showed the change in solar forcing over the same time frame as the CO2 change, but that data isn't available. However, based on what we know about variations in solar forcing in general, the total change in solar forcing would still be much smaller than the CO2 forcing.
If your claim that high solar irradiance last year was a primary cause of the observed high temperatures was valid then we should see similar changes in previous years of high and low solar irradiance... but barry has already demonstrated that this is not the case. Your hypothesis is contradicted by the evidence.
-
bruiser at 20:38 PM on 27 January 2014Australia’s hottest year was no freak event: humans caused it
Tom, the increase in co2 concentrations between 2012 and 2013 are miniscule compared to the increase in solar radiatin. So far we have seen cold weather, storms, bushfires, decreasing Arctic Ice, increasing Antarctic sea ice, tornadoes, hurricanes and heat waves attributed to AGW. If 0.4 W/Sq M can cause the decline in Arctic ice, I am sure 2Mw/Sq M/day can push up Australian temperatures. Your argument that there have been hotter years with lower solar radiation whilst factual does nothing to prove your case. By your logic, temperatures should have increased every year since 1998 as the world has added billions of tons of Co2 since that time.
Cheers, Bruiser
-
Tom Curtis at 14:02 PM on 27 January 2014Climate's changed before
tkman0 @393, given an interest in learning about global warming, I believe that the best approach is to start reading the history of the science. Here are some good resources from SkS:
Climate Science History Interactive Tool
Introducing the History of Climate Science
The History of Climate Science
Behind the Lines: Herschel's Discovery of Infrared
Two Centuries of Climate Science, Part 1, Part 2 and Part 3.
You should supplement reading those pages by targetted questions about aspects o the science discussed in the history that you do not understand. This will give you a far broader knowledge base than answering detailed questions in response to a denier. It will also show just how narrow is the focus, and how ignorant of the history of the discipline those deniers are when they start denying things proved decades, or even centuries ago.
Finally, I believe a good, clear explanation of the basic physics helps understand everything more clearly.
If you try to learn by debates with deniers, you will find they repeat previously refuted claims, contradict themselves and do not have a clear idea of the subject. Refuting them may be interesting the first time, but it will leave you with an unbalanced understanding of the science. As it is also the several thousandth time various of the people helping you have refuted those same points, a more sensible approach would be refreshing for them as well ;)
-
Tom Curtis at 13:40 PM on 27 January 2014It's cooling
Out of interest, the difference between the video linked to by KR and the data in the graph I showed above is that the data above is pure thermometer based data. Because there were no meteorological stations in Antarctica in 1880 (and indeed, not till the 1950s), it is unable to show temperatures for that period and hence no trend from that period either. In contrast, KR's video appears to be a reanalysis product. With reanalysis, they feed actual observations into a climate computer so that the computer's output is constrained to match observations where they are available. They then allow the computer to fill in the missing data. The process is accurate to a fairly high standard, but not perfect (nothing in science is). I would trust it as as good a representation of the actual temperature trends in those areas we are likely to get. You should, however, be aware of the difference so you can answer sensible questions (how did they measure Antarctic temperatures in 1880) and stupid ones ("I did not know we had satellites in orbit in 1884"). For the last, check the Youtube comments, or alternatively keep a hold of your braincells, and don't.
-
tkman0 at 13:32 PM on 27 January 2014It's cooling
@KR, they're private messages back and forth between us because we were causing a rucus on the forums. As to the website...you probably dont wana know, not really your typical website for every day use.
-
DSL at 13:29 PM on 27 January 2014It's cooling
tkman0, there are a variety of tools available to look at such things. Here's GIS Land-Ocean Temperature Index (GIS L-OTI) for the last decade, and here's the main page for the tool.
Here's graphed data for three latitudinal bands. -
Tom Curtis at 13:28 PM on 27 January 2014It's cooling
tkman0 @204, looks pretty global to me:

The graphs of the trend in warming from 1880-2013. The upper graph shows the data by zone, while the lower shows the average for each latitude band. As you can see, the equator shows a trend of around 0.8 C over that period, or 0.06 C per decade. The band with lowest warming is at 60 degres South (0.02 C per decade). That is low relative to the average (0.07 C per decade) but it is still warming - not cooling.
I suspect your interlocuter's data only shows ocean temperature anomalies relative to some recent period, where the recent La Nina's have draged the equatorial trend down. They are, however, short term fluctuations, and if that is what they have done, they are cherry picking.
The data comes from the GISS website, and is very usefull for debunking denier claims. You absolutely should bookmark it if you are interested in the debate.
-
It's cooling
tkman0 - Where is this discussion occurring?
-
It's cooling
tkman0 - It's global. Here's a video demonstrating that. And here's Marcott et al 2013, who show that recent climate changes are unprecedented in the Holocene despite any possible Bond events.
I would suggest giving him a link to the Most Used Myths, and having him tell you what doesn't answer his questions and hypotheses. If he has to keep changing his argument he didn't have a solid one to start with.
-
tkman0 at 13:25 PM on 27 January 2014It's cooling
Another one from the peanut gallery.
"if you look at the temperature profiles I posted in the forums previously, you see that the equater is cooling, as is the antarctic.
Since we are predominantly seeing global warming in the arctic and northern temperate zones, how do you know the data isn't a more regional warming event - as opposed to global warming.”
-
tkman0 at 13:08 PM on 27 January 2014Tree-rings diverge from temperature after 1960
my thoughts exactly
-
Rob Honeycutt at 13:05 PM on 27 January 2014Tree-rings diverge from temperature after 1960
tkman0... I think it would be a good idea to get this person to cite his references so people can see where he's getting his information.
This last comment is as bizarre as I've seen, and I've seen a lot.
-
tkman0 at 13:04 PM on 27 January 2014It's cooling
Another one from the guy:
"I agree that D-O events may not be global events. On the other hand, if you look at the temperature profiles I posted in the forums previously, you see that the equater is cooling, as is the antarctic.
Since we are predominantly seeing global warming in the arctic and northern temperate zones, how do you know the data isn't a more regional warming event - as opposed to global warming."
I was wondering if evidence could be supplied to help me prove this guy wrong?
-
tkman0 at 12:46 PM on 27 January 2014Climate's changed before
@Tom Dayton,
It's personally very entertaining as odd as that may be. But also I'm learning a LOT in the process, so I hardly see this endeavour as worthless. But thanks for the admice anyway :)
-
tkman0 at 12:42 PM on 27 January 2014Tree-rings diverge from temperature after 1960
Thanks Tom, also the guy sent this back which I found more hilarious than frustrating:
Again this is a very sophisticated but deceptive argument.
What Mann has done is he has thousands of tree samples from the cold periods. He has 7 (or some other similar number) from the IGW period.
So yes, applying the samples from the IGW period doesn't change the results - because his his data is not valid or representative.
Do you get the point? I'll explain it more if you dont.
-
Climate's changed before
tkman0 - It's pretty simple. Increased CO2 causes less IR to go to space at any surface temperature (physics, in particular spectroscopy).
A bit of Milankovitch warming causes the oceans to release some CO2 (temperature/solubility relationship), and considerably more warming results - a release of perhaps 20ppm/degree C - acting as a feedback. Our use of fossil fuels releases a great deal of CO2, and entirely without surprise warming results from that - in this case as a first cause. It doesn't matter whether the cause of CO2 increase is a bit of previous warming and ocean release or the result of millions of SUVs - the spectroscopic result of increased CO2 is that the climate will warm.
Not just correlation, but rather causation from physical principles (Fourier, Tyndall, Arrhenius all over 100 years ago) - with the correlation observed later (now) just as predicted.
-
Tom Curtis at 11:51 AM on 27 January 2014There's no correlation between CO2 and temperature
tkman0 @36, de nada! I do need to correct a misapprehension. I am not a researcher, let alone a seasoned researcher.
-
Tom Dayton at 11:41 AM on 27 January 2014Climate's changed before
tkman0, regarding causation, your denier is (irrationally, of course) consciously ignoring the experimental evidence that was woven together to form the theory that was then supported and improved by more experimental and other empirical evidence, and used to build models that unquestionably accurately predicted Earth's temperature trajectory. Links to that evidence already was pointed out in replies to you. That behavior is common among deniers. So you might as well give up on your denier, unless dealing with him is educating or entertaining you.
-
Tom Curtis at 11:36 AM on 27 January 2014Climate's changed before
tkman0 @383 quotes his interlocuter as saying:
"Doesn't that just scream to you that something is involved other than Co2? Since CO2 distribution is fungible & normal? And indeed - something else IS involved - the ocean water temperatures are huge drivers of climate change."
I am not even sure what your interlocuter is saying when they say "...CO2 distribution is fungible...". Are they saying that any distribution will have equal effect on climate? That it doesn't matter whether you have a Venusian or a Martian atmosphere when it comes to climate, its all the same? That is the literal meaning of what they write.
As to "... CO2 distribution is ... normal", that is clearly false when "normal" defined by comparison to the last 10 thousand, or indeed the last 5 million years. That is, you have to go back to a time when the apes whose descendants are modern humans were just differentiating from the apes whose descendants are chimpanzees and gorillas to find a time when that claim is anywhere near correct.
My primary concern, however, is the last sentence. Given that ocean temperature is a part of climate, indeed, a major part of climate, that sentence reduces to:
"Ocean water temperatures are huge drivers of ocean water temperatures"
or possible:
"Change in climate is a huge driver in climate".
Your interlocuter can only avoid the evident circularity of the claim by assuming feedbacks are very large such that any change in ocean temperatures will result in further changes in ocean temperatures in the same direction, and of substantial magnitude. That is, they must assume climate sensitivity is very large. Far greater than IPCC values. Without that assumption, his claim is vacuous due to circularity, and therefore cannot represent a causal relationship.
-
Tom Curtis at 11:21 AM on 27 January 2014Climate's changed before
tkman0, I have little to add to KR's comments re Dansgaard-Oeschger events. I will, however, show this graph from wikipedia:
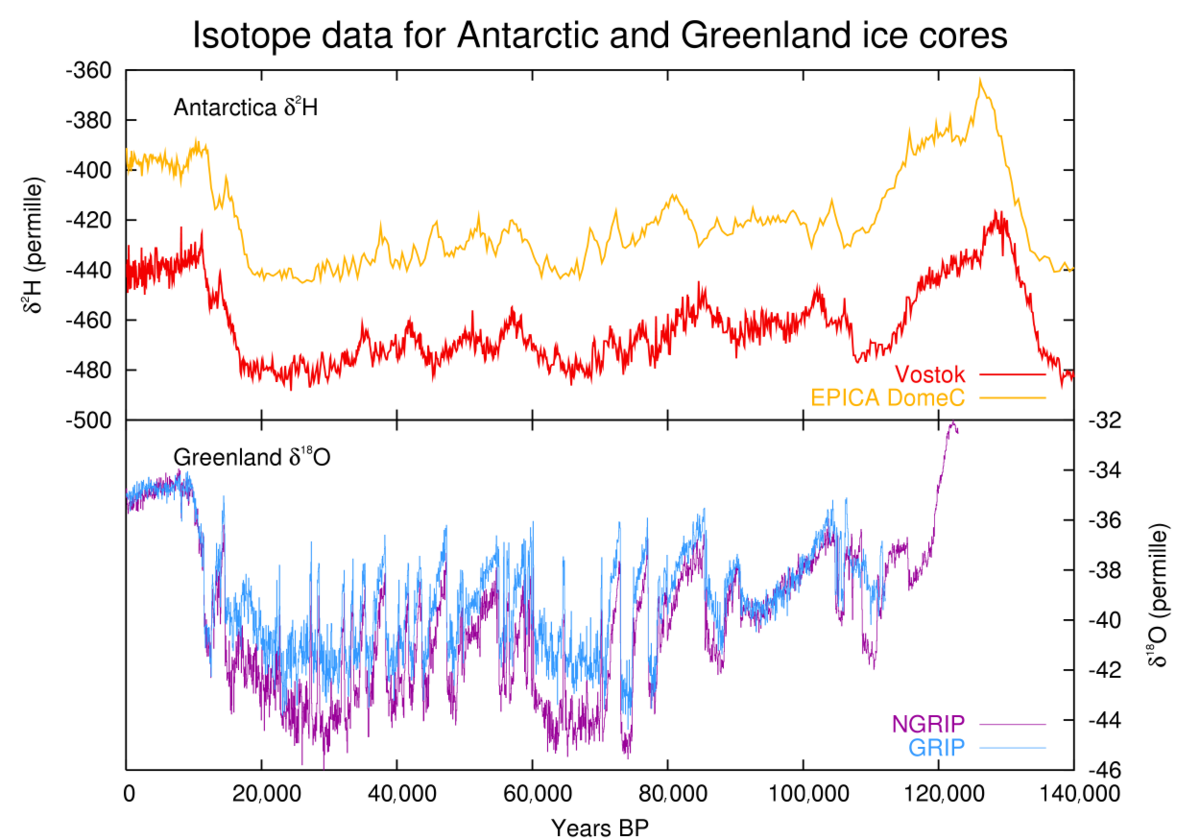
The original caption reads:
"Comparison of temperature proxies for ice cores from Antarctica and Greenland for 140,000 years. Greenland ice cores use delta 18O, while Antarctic ice cores use delta 2H. Note the en:Dansgaard-Oeschger events in the Greenland ice core between 20,000 and 110,000 years ago, which barely register (if at all) in the corresponding Antarctic record. GRIP and NGRIP data is on ss09sea timescale, Vostok uses GT4, and EPICA uses EDC2."
I, however, want to draw your attention to the radical difference in magnitude in the perturbations due to D-O events durring the last glacial, and those during the Holocene - even in Greenland. If your interlocuter knows enough to know about D-O events, he also knows about the minimal impact during the holocene of their (possible) equivalents, and that consequently that the current warming in not a D-O event, or a Bond Event.
-
tkman0 at 11:16 AM on 27 January 2014Climate's changed before
Thank you very much KR, I appreciate the assistance. Tbh ive spent the last little while debating him, and his typical method seems to be to throw as much misinformation out there so that it makes it extremely dificult to debunk each argument on a case by case basis.
However he does keep coming back to the fact that just because there is a correlation between CO2 and temp doesnt make it causational. I point to the fact that we have never seen this level of atmospheric CO2 before but he simply denies it. He's largely a lost cause, I'm simply humoring him because it's fun to watch him squirm with the facts thrown at him over and over. I'll try to keep to the articles themselves and only resort to comments when explicitely necessary. Thanks again.
-
Tom Curtis at 11:00 AM on 27 January 2014Tree-rings diverge from temperature after 1960
tkman0 @70, the following graph from the supplementary material of Mann 09 shows reconstructions using all data (red), excluding tree rings (blue), excluding seven particular proxies "skeptics" have objected to (brown), and excluding both all tree rings and the seven particular proxies (green):
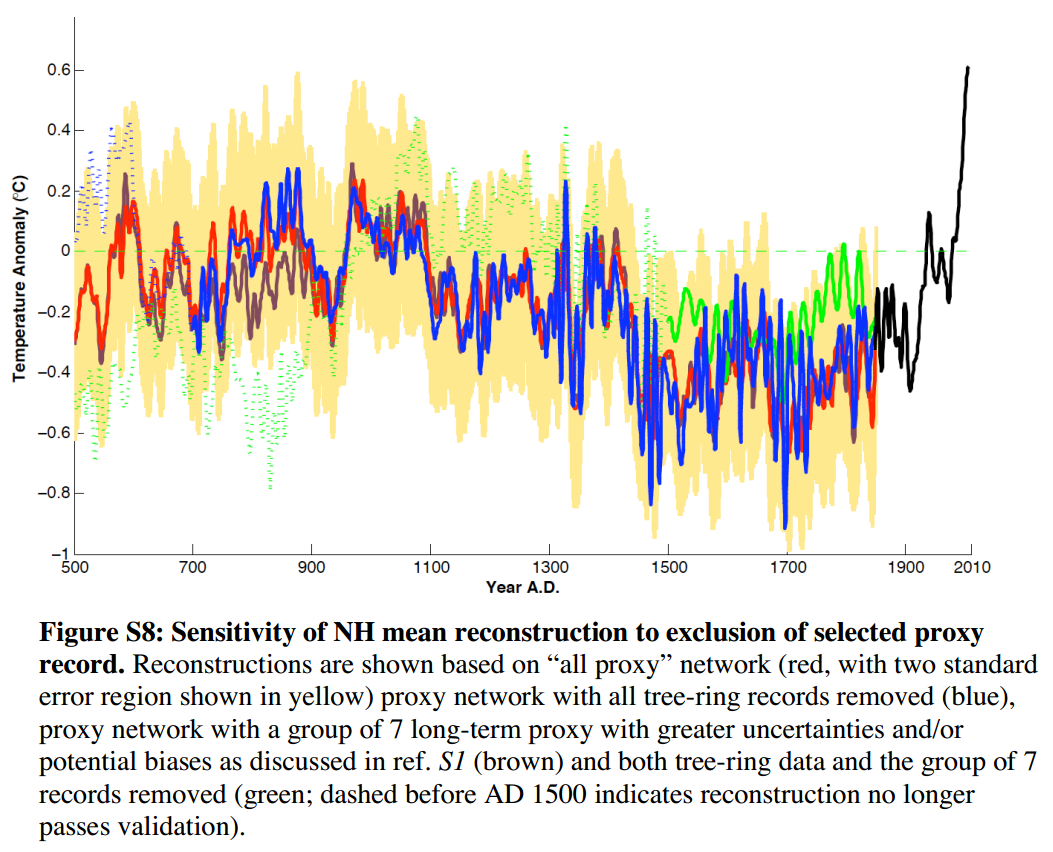
You should note that excluding the tree rings, or excluding the 7 particular proxies makes virtually no difference to the reconstruction. Excluding both does, at various locations, but does not consistently do so in any particular direction. Sometimes it is warmer and sometimes colder. That may simply be a function of the low sample size. The fewer the proxies, the more erratic the signal both because regional temperatures vary more than global (or hemisperic) temperatures; and because the fewer the proxies, the greater the probability actual noise, ie, a non-temperature signal, will survive rather than being cancelled out by averaging. Despite this greater erraticness, however, even excluding both tree ring and the seven particular proxies does not result in any major change in recent reconstructions, nor lift the reconstructed temperature above that in the late twentieth century at any point. Its biggest change where there are enough proxies to consider the reconstruction informative (ie, where it has a solid line) appears to be an elimination of the cooling coincident with the Maunder Minimum, ie, a clear error.
This is not the only reconstruction without tree rings, and none of the reconstructions without tree rings show a significantly different story to that from other reconstructions. Ergo, whatever the merits of Cecile et al (the paper referred to above), it has little bearing on the overall picture of past temperatures.
-
One Planet Only Forever at 10:42 AM on 27 January 2014More global warming will be worse for the economy, says Copenhagen Consensus Center
It is important to keep the big picture in mind when you are looking into any detail.
There are many other impacts from the activities related to burning of fossil fuels that need to be understood and included in the evaluation, similar to the way that reducing the burning of fossil fuels would reduce other harmful emissions, not just excess CO2 emissions. The bigger picture must not be ignored when looking into a discrete consideration like this evaluation of Global Warming impacts on the future vs. GDP benefit obtained today.
Another important fundamental aspect of 'speculation about the future value of the economy' is that any unsustainable activity, like the consumption of non-renewable resources, simply cannot be continued let alone 'grow'. Any consumption of non-renewable resources that creates accumulating damage to the diversity or profusion of 'life' is even less able to continue, let alone 'grow'.
There are also many unacceptable social consequences of the pursuit of benefit from unsustainable damaging activities. The ‘limited opportunity for benefit’ from unsustainable and damaging activities leads to fighting over that limited opportunity. This creates horrible human tragedy as a direct result, or collateral damage, of attempts by powerful people to ‘get more benefit’ any way they can get away with. It even diverts human brilliance and effort into damaging military and ‘security’ actions. That ‘fighting for more’ has been the cause of things like wars, invasions, overthrown governments, buying elections, international financial punishment, and propping up horrible leaders. It has also led to some nations deliberately trying to get away with economic competitive advantage by fighting against measures that would meaningfully restrict them obtaining benefit from burning fossil fuels.
The USA, Canada and Australia have clearly tried to ‘prolong and maximize’ their national advantage by fighting against global restrictions that would meaningfully and properly reduce the ‘false unsustainable value’ they are able to get away with obtaining from the burning of fossil fuels (including their benefit from expanded unacceptable activities in places like China). But it isn’t ‘those nations’ that are the problem. The real problem is the people who will try to get benefit any way they can get away with, including using their wealth to obtain control of governments in those nations through the popular appeal of getting away with unacceptable and damaging activities.
Many European economies are stepping back from their progress toward sustainable activity because they are losing competitive advantage to those ‘winners’. The European’s stepping back is declared to prove that their progress was unsustainable. That is clearly absurd since the stepping back is what is clearly unsustainable, yet it is a very popular belief.
Also, the fighting over limited opportunity means that many people must never be fortunate. Only a limited percentage can be fortunate in a battle over limited opportunity. The lack of boundless (sustainable) opportunity ensures poverty. Global GDP has grown many times quicker than global population yet desperate poverty persists.
Just like reducing CO2 emissions would reduce other unacceptable emissions, there is far more benefit to be obtained from reducing the ability of people to benefit from burning fossil fuels than the reduced impacts of excess CO2.
-
Climate's changed before
tkman0 - Dansgaard-Oeschger (D-O) events occur during glacial periods. The interglacial equivalent is that of Bond events, discussed here. When considering those against recent climate change, however, Bond events are regional (showing in regional records such as Greenland or Antarctic ice cores), and in fact often include warming in one hemisphere (North or South) and cooling in the other. Recent warming is global, which just doesn't match the signature of a Bond event.
If your previous posting is any example, your opponent is clearly attempting to throw everything in the 'skeptic' myths but the kitchen sink in the hopes that something will stick. I find that sort of scattershot approach, rather than explaining an objection in detail, to be a signpost of denial - since any individual myth quickly runs aground due to errors of fact....
-
scaddenp at 10:17 AM on 27 January 2014It's the sun
Perhaps you can explain why a weak sun doesnt make everywhere colder? The immediate reason for the cold eastern US winter (and the very warm winter weather elsewhere) is the pertubations on the jet stream. How does the sun slipping just below peak cause this?
Science works like this: you put forward your hypothesis. Assuming the hypothesis is true what observations would I expect to see. Check observations against predictions. Your hypothesis would seem to fail against such tests while the alternative hypothesis (reduction in pole/equator temperature difference affecting jet stream) seems to be holding well.
-
tkman0 at 10:09 AM on 27 January 2014Climate's changed before
Also these D-O periods dont seem to be referenced on the website, which is mainly why I'm asking in a comment, to send him a more specific answer.
-
tkman0 at 09:58 AM on 27 January 2014Climate's changed before
I apologise, they're honestly not my own opinions, despite the fact that I can see how it was mistaken that way. I'm personally debating this guy on a website and these are the points he has sent to me and I'm just seeking a more professional explanation. The "main point" I was trying to point out was his reference to these D-O periods which I have no previous knowledge about. I'm sorry for posting the entire message he sent my way, I'll try to cut it down to the more basic points next time. And the reason why I'm posting these on his behalf is because I'm informing him while learning a lot myself in the meantime.
-
Climate's changed before
tkman0 - 'This is a major point made repeatedly by my "opponent"...'
Actually, that's an entire series of bad denial myth points, a veritable Gish Gallop. If your 'opponent' has an actual point, please indicate what that is. As it stands you have mentioned the climate has changed before, CO2 lags temperature, the erroneous strawman of claiming that CO2 is the only driver of climate, it's cosmic rays, it's aerosols, and the questionable assertion of repeated D-O events - and I may have missed a few.
That is not 'a major point'. It's a shopping list.
I hate to say this, but your posts have increasingly taken on the appearance of presenting your own opinions, not those of an 'opponent', ramping up in absurdity as initial errors are pointed out. I would strongly suggest looking at the list of the Most Used Climate Myths on this website regarding your most recent, and future, posts - it may save some time.
-
Tom Curtis at 09:44 AM on 27 January 2014Tree-rings diverge from temperature after 1960
tkman0 @70, the following graph from the supplementary material of Mann 09 shows reconstructions using all data (red), excluding tree rings (blue), excluding seven particular proxies "skeptics" have objected to (brown), and excluding both all tree rings and the seven particular proxies (green):
You should note that excluding the tree rings, or excluding the 7 particular proxies makes virtually no difference to the reconstruction. Excluding both does, at various locations, but does not consistently do so in any particular direction. Sometimes it is warmer and sometimes colder. That may simply be a function of the low sample size. The fewer the proxies, the more erratic the signal both because regional temperatures vary more than global (or hemisperic) temperatures; and because the fewer the proxies, the greater the probability actual noise, ie, a non-temperature signal, will survive rather than being cancelled out by averaging. Despite this greater erraticness, however, even excluding both tree ring and the seven particular proxies does not result in any major change in recent reconstructions, nor lift the reconstructed temperature above that in the late twentieth century at any point. Its biggest change where there are enough proxies to consider the reconstruction informative (ie, where it has a solid line) appears to be an elimination of the cooling coincident with the Maunder Minimum, ie, a clear error.
This is not the only reconstruction without tree rings, and none of the reconstructions without tree rings show a significantly different story to that from other reconstructions. Ergo, whatever the merits of Cecile et al (the paper referred to above), it has little bearing on the overall picture of past temperatures.
-
tkman0 at 09:03 AM on 27 January 2014Climate's changed before
This is a major point made repeatedly by my "opponent" one which I'd like answered as well if at all possible. Thank you again for your time.
"The period that we were talking about is the Younger Drayas / Preboreal
Which in conjunction means that we are talking of the transition from the Younger Drayas to the Preboreal.
This is an example of a D-O event. (Everyone calls them that because the names of the original people Dangaard -Oestinger? are hard to say/remember).
The point of that is that there have been THOUSANDS of these transitions. They occur every 1100-1500 years.
Think with common sense for a minute. If these transitions have been occuring every roughly 1500 years for thousands and thousands of years.
If that is true - why do you think THIS temperature change is man caused? Especially since we are roughly due for a transition? Remember these temperature changes have been seen for more several tens of millions of years - and in none of them were men around to cause the change.
In all of them, the CO2 levels changed; the atlantic and the pacific oscillations occurred.
In addition to that, Al Gore (et.al) has basically said that the temperatures the earth is seeing now is unprecedented. This is just simply factually untrue. Look at the K. ice cores - where we have an unbroken temperature record for like 1,000,000 years. Temperatures *higher* than the ones we see now have been seen every 50,000 years or so.
Followed by steep plunges in temperature (ie, drops of 12oF). The period of life that we regard as normal is only the very tip of the mountain - most of the time the temperatures of the earth are much, much colder. Hence sabertooth tigers and mammoths.
Now, regarding the two skeptical science articles about correlation & lag.
I quite agree that there is a correlation between co2 and temperature. Where I differ is that I do not believe that Co2 is causal.
But I need to refine that statement again.
As the vostok cores show (and every other ice core) is that Co2 follows temperature change. Again, this is a simple reflection of Henry's Law - which climate scientists are trying very hard to ignore.
In that second skeptical science article, they cherry pick exactly *one* transition, that was known to have asymptomatic co2 event to prove therefore that ALL transitions are induced by carbon.
Thats flat out deceptive.
Look back to the Quaternary paper I quoted. It claims that it is clear that there are SIX main drivers of climate change - as opposed to AGW -which claims there is only one.
If you look at the Quaternary paper - as well as others - you will see they claim that the temperature difference attributable to the change in CO2 is between 1.1 and 2.0 degrees.
(Also many D-O events occur that have precisely that range of temperature changes; as well as the current temperature change).
The quaternary paper is nowhere near alone in claiming documenting D-O transitions - there are literally hundreds of papers saying the same thing.
Going back to the skeptical article you quoted (again, not a science paper, but I'll live). Look at the graph. Notice that the temperature change occurred differently in the arctic and the anarctic.
Doesn't that just scream to you that something is involved other than Co2? Since CO2 distribution is fungible & normal? And indeed - something else IS involved - the ocean water temperatures are huge drivers of climate change.
Again, even the hansen paper you quoted said that climate change could be caused by orbit shift.
So contrary to what you have thought, I do not disagree with the fundamental fact that CO2 absorbs in the infrared.
Contrary to what you may have thought, I do not necessarly believe that Co2 doesn't play some role in global warming. It may.
But if so, it is one of many drivers of climate forcing.
And what I said before is still true - the role of co2 outside the troposphere and the effects of carbon migration through the atmosphere are mostly unknown, and that nasa has documented that CO2 in the upper atmsphere cools the planet.
And the effects of aerosols - as one of your skeptical articles alludes too, plays a much larger role than the AGW accepts. This by the way is the nature of Svenmark's & Cern's & others research."
-
thepoodlebites at 08:59 AM on 27 January 2014It's the sun
I think we are starting to see the effect of a weak cycle 24 with the unusually cold winter in the eastern U.S., and the strong rebound in the Arctic sea ice extent, escpecially the 3-4+ year ice.
-
2014 SkS Weekly News Roundup #4B
villabolo - Indeed. Here's the map for 2013.

-
tkman0 at 08:48 AM on 27 January 2014Tree-rings diverge from temperature after 1960
Me again, my opponent sent me this message and was wondering if I could recieve a proper answer to it. I know tree rings dont ONLY respond to cold temperatures, but I dont have everything I need to make a compelling case.
What he said:
"if you look at the tree ring proxies, they are only effective during "cold periods. They chose to exclude MWP because the data model breaks down."
http://wattsupwiththat.com/2013/08/16/oh-mann-paper-demonstrates-that-tree-ring-proxy-temperature-data-is-seriously-compromised/
-
villabolo at 08:24 AM on 27 January 20142014 SkS Weekly News Roundup #4B
The most intuitively obvious response to members of the public is the temperature anomaly image from GISS which shows that most of the earth is warmer than average with only a small portion of it - the US and canada - being colder than average for the month of December.
Like the old saying goes: One picture is worth a thousand words
-
tkman0 at 02:33 AM on 27 January 2014There's no correlation between CO2 and temperature
Thank you very much for your assistance Tom, I'm an 2nd year Environmental Science major in university right now and while climate and resource management is my focus, it helps to have a seasoned researcher assist me in dealing with this denier.
-
GRLCowan at 01:51 AM on 27 January 20142014 SkS Weekly News Roundup #4B
Stranger, money is said to be needed to continue updating the Keeling curve. There is a donation button at http://rabett.blogspot.ca/ .
-
barry1487 at 18:16 PM on 26 January 2014Australia’s hottest year was no freak event: humans caused it
Tom, thanks for doing a more in-depth analysis. I wasn't sure how to convert Mj/sq M to W/sq M over a year.
Prev 773 774 775 776 777 778 779 780 781 782 783 784 785 786 787 788 Next


