


 Arguments


Recent Comments
Prev 781 782 783 784 785 786 787 788 789 790 791 792 793 794 795 796 Next
Comments 39401 to 39450:
-
wili at 23:10 PM on 10 January 2014New Study Suggests Future Global Warming at the Higher End of Estimates: 4°C Possible by 2100
Tom, so your paragraph at #13 that goes:
"For practical purposes, if we cease all emissions, then temperatures will not rise much above the TCR to the peak CO2 concentration - but will not fall much below it for thousands of years either. However, if we retain emissions at just 9% of current levels, CO2 concentrations will not fall and we will face the equilibrium climate response within two centuries, and temperatures will keep on rising slowly for thousands of years to come. It follows that the relevance of the ECS depends on our future policies, and therefore it is at least relevant in helping us determine those policies."
is a direct quote from the Sherwood paper? -
wili at 23:07 PM on 10 January 2014New Study Suggests Future Global Warming at the Higher End of Estimates: 4°C Possible by 2100
Bob at #16 wrote: "the moisture precipitates out or is distributed (based on whatever criteria/profile the model may use) throughout the atmospheric column, leaving some for low clouds, some for middle clouds, and some for high clouds."
Thanks tons. That helps a lot. As usual, these things are more complex than what can easily be squeezed into a two minute video. -
carbtheory at 18:20 PM on 10 January 2014It's aerosols
@ 7, first graph. To get a better picture of how changes in emissions between the 70's and more recent years would require a profile of the changing emissions particle size over that period. Below CCN size, smaller average particle size would result in longer residence time in the atmosphere, while they grow in size, raising the opportunity for the particles to bypass water vapour to higher altitudes leaving a higher WV content at lower altitudes. An examle of how raising emission standards can affect particle size can be seen in the following study " Measurement of Engine Exhaust Particle Size" by David B. Kittleson, ( pages 7 and 8 in particular ) where they describe the effect of new standards ( introduced in 1990 ) on deisel emissions.
-
davidnewell at 17:56 PM on 10 January 20142013 SkS Weekly News Roundup #52
Right on! This "worrying about the future" is not joyful!
Happy New Year!
-
carbtheory at 17:31 PM on 10 January 2014Water vapor is the most powerful greenhouse gas
@ 174, " Biotic Regulation Theory ", good read btv123, nice explanation of how changes in land use can lead to a change in weather patterns. This in turn can lead to so called 'erratic weather'. Interestingly there are claims on the web of global forest cover halving over the 20th century.
-
Tom Curtis at 16:52 PM on 10 January 2014New Study Suggests Future Global Warming at the Higher End of Estimates: 4°C Possible by 2100
willi @15, other than the first quote, which is a transcript from the video, all my quotes were from the actual paper. I think the most important one is that first one, ie, the transcript, as it gives the clearest statement of the mechanism involved, which appears to have been giving some people (including myself) difficulty understanding. However, the paper deals with the issue in more detail than the does Sherwood's discussion on the video.
With regard to your first question, I have nothing to add to Bob Lacatena's answer.
-
Bob Lacatena at 14:34 PM on 10 January 2014New Study Suggests Future Global Warming at the Higher End of Estimates: 4°C Possible by 2100
Additional note... some air (and moisture) will obviously also be transported horizontally, which is a major mechanism in the climate system for transporting moisture from the equator poleward. So again, it's not as simple as more clouds or less clouds in a column.
-
Bob Lacatena at 14:29 PM on 10 January 2014New Study Suggests Future Global Warming at the Higher End of Estimates: 4°C Possible by 2100
Wili, re high clouds... No, because it's not an all or nothing thing, and it's not discrete. We're not talking about a "block of moist air" that either rises 10km up, taking all of it's moisture with it, or not. What is involved instead is the parameterized estimation of how much moisture rises to what altitude at what temperature, how much remains as vapor, how much condenses into cloud, and how much precipitates out.
The models in which air predominently rises 10km and higher does not take all of the moisture with it (remember, the ability of air to hold moisture drops with temperature, which in turn drops wih altittude). In those models, instead, the moisture precipitates out or is distributed (based on whatever criteria/profile the model may use) throughout the atmospheric column, leaving some for low clouds, some for middle clouds, and some for high clouds. More moisture (in a warmer climate) will then increase clouds at all levels, a positive feedback for high and middle clouds, but a negative (reflecting more sunlight) for low level clouds.
In contrast, a model which better simulates up and down drafts will leave the lower levels of air in the boundary layer (2km) dryer, leading to more cloud formation at middle and high levels (a positive feedback) and less low cloud formation (another positive feedback).
-
wili at 13:54 PM on 10 January 2014New Study Suggests Future Global Warming at the Higher End of Estimates: 4°C Possible by 2100
Thanks, Tom; those quotes really help. The one I am still left puzzled by is from the second quoted paragraph in your #12: "The air allways rises up to 10 or 15 kms, and so these models have been predicting a lower climate sensitivity..."
If the air in these models always rises to this height bringing moisture up that high to form high clouds, shouldn't that bias those models toward a higher climate sensitivity, since it is the high clouds that do more heating, while the low clouds reflect sun more effectively and keep in less heat?Thanks again for your continued efforts in helping us undestand this important paper. What is your source for the second paragraph in 13. I'd like to point this out to people at other sites, but it would be nice to be able to site somthing more convincing than "a poster named Tom on another site."
-
Tom Curtis at 12:03 PM on 10 January 20142013 SkS Weekly News Roundup #52
Further to my comments @14 above:
As he says at the end, John Green says at the end, "... much of this progress is unsutainable with current technology, but it is real and it is worth celebrating."
-
tcflood at 11:32 AM on 10 January 2014New Study Suggests Future Global Warming at the Higher End of Estimates: 4°C Possible by 2100
Bob Lacatena @10 and 11:
Thanks for your responses.
I must say, though, that I found rather perplexing your introduction of the concept whose generation we care about into an answer to what I thought was a fairly straightforward technical question.
Tom Curtis @13:
Thanks for your helpful response.
Just to clarify my question, let’s assume some arbitrary, hypothetical numbers. Suppose the globally averaged surface air temperature in 1850 were 286 K, and [CO2] were 280 ppm. Then in, say, 2050 the [CO2] were 560 ppm and that [CO2] were to remain constant at that value until year 3000 (preposterous, I know). If one postulates an ECS (primary effects and all feedbacks, fast and slow) of, say, 4 degrees, what does this imply for the likely global SAT in, say, 2100? I suppose that one might react differently if models projected an SAT of 290 K in 2100 versus in 3000. Whenever I read papers or discussions about the ECS, I am always left with this lack of clarity. Perhaps it’s just me.
-
dana1981 at 10:21 AM on 10 January 2014Global warming is being caused by humans, not the sun, and is highly sensitive to CO2, new research shows
Thanks Composer, fixed.
-
Tom Curtis at 09:05 AM on 10 January 2014Climate's changed before
pheidius @376, I am unable to comment further unless you do in fact cite the two papers, ie, either list their names, authors, date and journal of publication; or provide a link to the abstract including those details.
-
Tom Curtis at 09:02 AM on 10 January 2014New Study Suggests Future Global Warming at the Higher End of Estimates: 4°C Possible by 2100
tcflood @8, strictly speaking it does take thousands of years to reach ECS, but in practise nearly all of the Equilibrium Climate Response is achieved in about 200 years. To confuse things, however, by two hundred years you are starting to feel some of the effects of slow feedbacks, such as melting ice sheets and changes in vegetation. Arguably we are already feeling some of those effects. Consequently it is not safe to assume the change in temperature in human time scales is limited by the ECS.
For practical purposes, if we cease all emissions, then temperatures will not rise much above the TCR to the peak CO2 concentration - but will not fall much below it for thousands of years either. However, if we retain emissions at just 9% of current levels, CO2 concentrations will not fall and we will face the equilibrium climate response within two centuries, and temperatures will keep on rising slowly for thousands of years to come. It follows that the relevance of the ECS depends on our future policies, and therefore it is at least relevant in helping us determine those policies.
-
Tom Curtis at 08:51 AM on 10 January 2014New Study Suggests Future Global Warming at the Higher End of Estimates: 4°C Possible by 2100
Some of the questions about the mechanism described in the paper are answered by Sherwood in the video (1:08):
"What we see in the observations is that when air picks up water from the oceans surface and rises up, it often only rises a few km before it begins its descent back to the surface. Other times it might go up 10 or 15 km. And those shorter trajectories turn out to be crucial to giving us a higher climate sensitivity, because of what they do to pull water vapour away from the surface and cause clouds to dissipate as the climate warms up.
In many of the models this doesn't happen. The air allways rises up to 10 or 15 kms, and so these models have been predicting a lower climate sensitivity, but we believe they're incorrect.
What these shallower overturning circulations do is they pull the water vapour away from the part of the atmosphere where clouds form that cool the climate. If these things are strong, and if they do this more in a normal climate, which is what all the models agree is what happens, then you loose your low clouds and the Earth absorbs more sunlight.
The question for many years has been what's going to happen to the amount of low cloud. Does it decrease when the Earth warms up, or does it stay the same, and maybe even increase; and what we found is that it should be decreasing because of this mixing process which pulls water vapour away from the layers were these clouds form, and causes there to be fewer of them in the wamer atmosphere."
So, the increased warming is definitely due to the reduction of low cloud.
However, Sherwoods account is simplified relative to the paper. Specifically, in the video, where he refers to the circulation that "only rises a few km", the video shows a circulation rising to 5 km. In fact the paper mentions two forms of low circulation:
"As discussed above, air there is either transported directly from the boundary layer with minimal precipitation via lower-tropospheric mixing, or indirectly by ascending in deeper, raining clouds and then descending. The air would arrive cool and humid in the former case, but warmer and drier in the latter case owing to the extra condensation, allowing us to evaluate which pathway dominates by observing mean-state air properties."
That is, in the lower tropospheric circulation, sometimes air (with its attendant water vapour) is carried only as high as the level of formation of low clouds (around 2 km); but sometimes it is carried higher - precipitating out some of the water vapour, before descending back to the level of low clouds.
Sherwood et al measure the different rates of these two types of circulation with the index S:
"To do this we use an index S, proportional to the differences DT700–850 and DR700–850 of temperature and relative humidity between 700 hPa and 850 hPa (S taken as a linear combination; see Methods Summary) averaged within a broad ascending region which roughly coincides with the region of highest Indo-Pacific ocean temperatures (the Indo-Pacific Warm Pool; Fig. 1)."
To help make sense of that, 850 hPa corresponds to an altitude of 1.5 km, and 700 hPa corresponds to an altitude of 3 km.
In addition to these two forms of low level circulation, Sherwood et al describe a higher level circulation:
"We next turn to the large-scale lower-tropospheric mixing, which we associate with shallow ascent or flows of air upward through the top of the boundary layer that diverge horizontally before reaching the upper troposphere. Although air ascending on large scales over warm tropical oceans typically passes through nearly the whole troposphere, over cooler oceans its ascent often wanes with altitude, showing that this type of mixing indeed occurs in the Earth’s atmosphere (Fig. 3). The associated mid-level outflows are well documented for the central and eastern Pacific and Atlantic Intertropical Convergence Zone and some monsoon circulations13,14. Although these are indeed the regions where shallow ascent is steadiest, and hence clearest in monthly-mean data (Fig. 3), in daily reanalysis data, shallow ascent is equally strong outside the tropics owing largely to contributions from extratropical storms."
Clearly this form of circulation will also dry the region around 2 km altitude where low level cloud forms.
Sherwood et al define an indice of the ratio of large circulation to low level circulation:
"We quantify the large-scale lower-tropospheric mixing more thoroughly by calculating the ratio D of shallow to deep overturning (see Methods Summary) in a broad region encompassing most of the persistent shallow ascent (see Fig. 3). This index D varies by a factor of four across 43 GCMs (see below). Interestingly, however, D and S are uncorrelated (r50.01), confirming that the two scales of mixing are controlled by different aspects of model design."
Because low circulation provides the numerator, and high circulation the denominator, D will be larger when low circulation dominates over the high circulation.
It turns out that the differences in low circulation (indexed by S) and the ratio of low to high circulation (indexed by D) equally contribute to reduced low cloud. However, the model spread relative to S is not biased relative to observations. In contrast, the model spread relative to D is, with models consistently underestimating D, that is, the ratio of low to high circulation. Consequently it is differences in D that explain why low climate sensitivity models are probably inaccurate (according to Sherwood et al). That is probably why Sherwood in the video concentrates on explaining the factors relevant to D, essentially ignoring S. If you find all this confusing, it is probably better to also ignore S, and simply rely on Sherwood's description as transcribed above.
-
Bob Lacatena at 08:36 AM on 10 January 2014New Study Suggests Future Global Warming at the Higher End of Estimates: 4°C Possible by 2100
But yes, ECS concerns longer time frames than TCS. We can't actually say "thousands of years," though, because we can't really know at this time how quickly the slowest feedbacks will take effect, of how much of the total climate sensitivity they will represent.
-
Bob Lacatena at 08:26 AM on 10 January 2014New Study Suggests Future Global Warming at the Higher End of Estimates: 4°C Possible by 2100
tcflood,
On choosing between ECS vs. TCS:
Only if we can presume to know the temporal difference between the two, but given that humidity and low cloud changes should be fast feedbacks, i.e. ones which occur very rapidly as a direct consequence of changes in land surface, ocean surface and atmospheric temperatures, then my immediate reaction would be that this is a very big problem, and there is no reason to think that we should ignore the results because final ECS is a thousand years in the future.
But the distinction has little to do with this paper. It's more of a general question of "well, do I care about TCS, because I could care less about anyone but my own generation and maybe the next, or do I care about ECS, because I care about future generations, even after I'm gone."
With that said, if you want to know what difference this makes in the model runs, you'd have to look at the selected and excluded ensembles, and compare their TCS period results.
-
Bob Lacatena at 08:23 AM on 10 January 2014New Study Suggests Future Global Warming at the Higher End of Estimates: 4°C Possible by 2100
Clouds:
The paper specifically addresses moisture levels in the 2km to 3km range, meaning low clouds, i.e. those that have a primarily cooling effect by reflecting incoming sunlight (so less such clouds would be a positive feedback). The paper did not re-run model simulations, but rather examined existing models, and various parameters, to identify those models whose temperature and humidity changes in the 2km to 3km range more accurately reflected actual observations, taking these models to be more accurate in that respect.
What they found was a very, very strong correlation between how well a model matched observations in that respect, and therefore had fewer low level clouds, and climate sensitivity.
Those that more closely matched observations consistently had a higher climate sensitivity.
Those that were less of a match for observations consistently had a lower climate sensitivity.
Restricting estimates to include only those models whose ensembles more closely match observations leads to the ECS given.
-
tcflood at 07:09 AM on 10 January 2014New Study Suggests Future Global Warming at the Higher End of Estimates: 4°C Possible by 2100
Sorry, I think I put this question under the wrong topic, so I'll put it here where I think it belongs.
Does equilibrium climate sensitivity include complete equilibration with the hydrosphere? Does this imply a time span of a thousand or so years? Would a transient CS be more appropriate coefficient to discuss for a century timescale?
-
bibasir at 05:11 AM on 10 January 2014The Weekly Standard's Lindzen puff piece exemplifies the conservative media's climate failures
I read the link in 12 giving the Catholic Church's view of the Galileo inquisition, and I think it is somewhat self serving. From wikipedia, " On February 24 the Qualifiers delivered their unanimous report: the idea that the Sun is stationary is "foolish and absurd in philosophy, and formally heretical since it explicitly contradicts in many places the sense of Holy Scripture..."; At a meeting of the cardinals of the Inquisition on the following day, Pope Paul V instructed Bellarmine to deliver this result to Galileo, and to order him to abandon the Copernican opinions; should Galileo resist the decree, stronger action would be taken. On February 26, Galileo was called to Bellarmine's residence and ordered, "to abstain completely from teaching or defending this doctrine and opinion or from discussing it... to abandon completely... the opinion that the sun stands still at the center of the world and the earth moves, and henceforth not to hold, teach, or defend it in any way whatever, either orally or in writing."
In addition, the January Scientific American has an article titled "The case against Copernicus." There was substantial scientific controversy about Copernicus' heliocentric theory well after both Copernicus and Galileo. Below are the final paragraphs. The full article requires a subscription.
" The acceptance of Copernicanism was thus held back by a lack of hard scientific evidence to confirm its almost incredible claims about cosmic and stellar magnitudes. In 1674 Robert Hooke, curator of experiments for the British Royal Society, admitted, “Whether the Earth move or stand still hath been a problem, that since Copernicus revived it, hath much exercised the wits of our best modern astronomers and philosophers, amongst which notwithstanding there hath not been any one who hath found out a certain manifestation either of the one or the other.”
By Hooke’s time a growing majority of scientists accepted Copernicanism, although, to a degree, they still did so in the face of scientific difficulties. Nobody convincingly recorded the annual stellar parallax until Friedrich Bessel did it in 1838. Around that same time, George Airy produced the first full theoretical explanation for why stars appear to be wider than they are, and Ferdinand Reich first successfully detected the deflection of falling bodies induced by Earth’s rotation. Also, of course, Isaac Newton’s physics—which did not work with Brahe’s system—had long since provided an explanation of how Brahe’s “hulking, lazy” Earth could move.
Back in Galileo’s and Riccioli’s day, however, those opposed to Copernicanism had some quite respectable, coherent, observationally based science on their side. They were eventually proved wrong, but that did not make them bad scientists. In fact, rigorously disproving the strong arguments of others was and is part of the challenge, as well as part of the fun, of doing science."
Moderator Response:[PS] Interesting as this may be, can we please not have this topic derailed by historical discussions.
-
ubrew12 at 03:19 AM on 10 January 2014New Study Suggests Future Global Warming at the Higher End of Estimates: 4°C Possible by 2100
I'm no expert, but I think what they're saying is if the atmosphere heats up due to CO2, where does it heat up? In heats up in the lower troposphere, mostly. Hence, where is additional H2O going to make its home? In the lower troposphere, below cloud-formation level. This has the unfortunate effect of increasing the lower troposphere further, making it a better home for even MORE H2O. If much of the additional H2O never makes it high enough to form clouds, its a positive feedback (or at least less of a negative feedback than it would be if you assumed most of it WAS making it up that high).
-
gws at 02:44 AM on 10 January 2014Methane emissions from oil & gas development
-
martin3818 at 23:47 PM on 9 January 2014New Study Suggests Future Global Warming at the Higher End of Estimates: 4°C Possible by 2100
@Rob
If you could find the time to explain in detail (diagrams and all) where high and low clouds form, where mixing takes place, how mixing influences cloud formation and why mixing will increase when the temperatures go up - this would probably answer many of the questions being asked in this comment section.
I must admit, I'm still confused.
-
Composer99 at 22:54 PM on 9 January 2014Global warming is being caused by humans, not the sun, and is highly sensitive to CO2, new research shows
FYI the block-quoted text from Jara Imbers, likely because it is cut off before being completed, is affecting the formatting on the main page. At least, that is how it appears to me.
-
pheidius at 22:43 PM on 9 January 2014Climate's changed before
I also read the second figure in question to be natural output. He phrased it as "the modern mean annual rate of Mantle co2." So I have the concepts but got led astray by dividing by 12 in my attempt to get to the modern atomic weight and then try to convert that when all I had to do was multiply by 12. So 6,000 GT divided by 2.13 would mean a theoretical atmospheric input of 2817 ppmv over that (plus minus) 1,000,000 million year time period less whatever the Earth's carbon sinks could then reabsorb. Mclean strongly implied a weaker feedback mechanism in describing the ocean's of the day as being warm, deep and with slugish circulation. So a conservative number might be closer to 40%. That would imply the the ppmv towards the end of the period was around 2012 ppmv. The other author'(s) paper, however, stated that the ppmv was pretty consistant at around 350-500 ppmv until, right at the KT mark, it shot up to 2300 ppmv. Darn: it would seem both of these sources can't be right. I was looking, in all of this, for an aproximation of the tipping point when the ocean's heatsink mechanism just shuts down. It would seem all the author's numbers agree about ppvm being roughly in the 2000-23000 range indicating dead oceans below at the end of the sequence. The Ma period numbers preceding are wildy divergent. The second paper looked for 4600 Gt to be thrown up by an impact to get to 2300 ppmv.
4600Gt divided by the current anthrogenic number of 8.2 is 560 years to dead oceans. That is worrysome indeed, but I wish there was more consensus on the background data as there seems to be on current data. In both of the papers I cite, the ppmv figures in the long term neatly support each author's hypothesis but both can't be correct. One would think peer review would catch major discrepencies such as these. Thanks for the help. I am just a laymen who can read fairly technical data but strugeles a bit with the math.
-
Tom Curtis at 20:48 PM on 9 January 2014Climate's changed before
pheidius, 1 mole of CO2 contains 12 grammes of carbon. Thus, 5 x 10^17 moles of CO2 equals 60 x 10^17 grammes, or 6,000 petagrammes of Carbon. A petagramme is also a Gigatonne, so 6,000 petagrammes of Carbon is 6,000 Gigatonnes of Carbon. 4.1 x 10^12 moles equals 49.2 x 10^12 grammes, or 0.0492 Gigatonnes Carbon. In contrast, the IPCC cites a value of 9.5 Petagrammes of Carbon (or Gigatonnes of Carbon) in 2011. Given the large discrepancy, it is likely the figure you cite from McLean is an estimate of natural emissions only.
The unit, ppm does not stand for a given mass of CO2, but for part per million, ie, a concentration of the gas within the atmosphere. Strictly what is called ppm in climate science is actually ppmv, ie, parts per million by volume - ie, the ratio of numbers of molecules in the atmosphere rather than the ratio of the total mass of each component of the atmosphere. Given the mass of the atmosphere, 2.13 Gigatonnes of Carbon = 1 ppmv of CO2. However, about half of all emissions are taken up by the ocean or biosphere rather than staying in the atmosphere.
-
Jonas at 20:17 PM on 9 January 2014Talking Trash on Emissions
Wunderful idea to make the numbers less abstract!
I reposted it with the numbers for germany:
597 kg waste per year ( http://de.wikipedia.org/wiki/Abfall )
11,2 tons of CO2 per year ( http://de.wikipedia.org/wiki/Länderliste_CO2-Emission )
11200kg / 597g = ca 18.76 kg CO2 per kg of waste ... -
pheidius at 19:02 PM on 9 January 2014Climate's changed before
As a footnote to the above, I am reading another paper, "An Atmospheric pco2 Reconstruction across the Cretaceous_Tertiary Boundary from Leaf Megafosils." This paper compromises the usual bolide vrs. outgassing argument by accepting the linear increase from the Daccan traps but postulates a bolide colision as well that threw 4,600 GT c into the air rasing the ppm from 500 PPM to 2,300 ppm in only 10,000 additional years. I think were the two authors to duke it out in person, Mclean would argue that 500 PPM was the tipping point where the carbon sinks failed causing the rapid rise and consequent extinction while the author(s) of this other paper argue that another cause was neccssary for such a quick and dramatic increase.
-
chriskoz at 18:45 PM on 9 January 2014Global warming is being caused by humans, not the sun, and is highly sensitive to CO2, new research shows
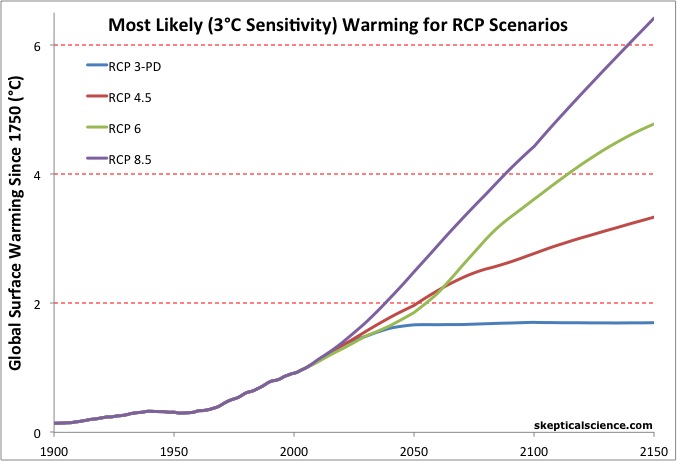
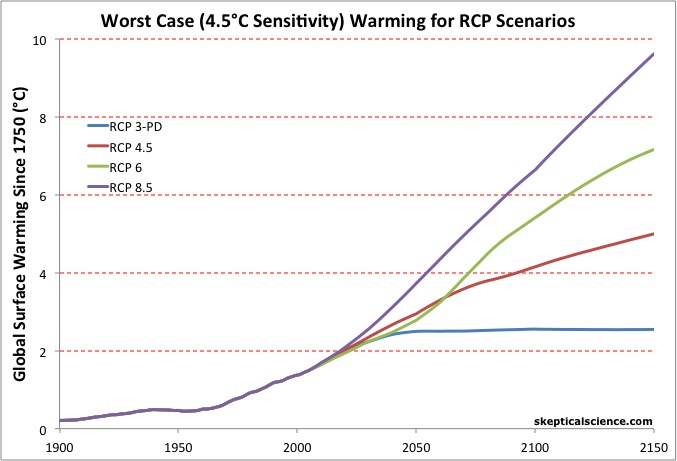
If Sherwood 2014 ECS of 4°C is correct, then the actual equilibrium deltaT will be incidentally equal to the W/m2 forcing, which is the RPC number. That makes it very easy to calculate, e.g. RCP6.5 - 6.5°C.
That does not mean that I like the larger deltaT; but the simplicity is my favourite aspect of any knowledge according to KISS paradigm especially important while talking to denialists.
-
pheidius at 18:29 PM on 9 January 2014Climate's changed before
I admit to some difficulty with Mclean's math as he was using moles as a measurement while current measurements use ppm(petagrams). I could not find any online calculator as moles and metric measurements are apples and oranges. He cites the figure of 5 x 10 to the 17th moles of co2 as the total Deccan release. I made that out to be 500,000,000,000,000,000(500 quadrillion moles). He gave a current mean figure of 4.1 x 10 to the 12th moles as the annual realease from all sources. (410,000,000,000 410 billion moles) At first, I thought I would try to convert from moles to the modern atomic unit by dividing by 12 and then trying to convert to ppm but then got muddled into thinking I could just multiply the moles by 1,000,000 to get PPM. Then I got tired and decided to post in the forum before going further. So how does Maclean's 1985 math fare against more recent calculations?
-
Bernard J. at 17:05 PM on 9 January 2014Global warming is being caused by humans, not the sun, and is highly sensitive to CO2, new research shows
On the matter of the climate sensitivity side of things Steven Sherwood says:
Rises in global average temperatures of [at least 4C by 2100] will have profound impacts on the world and the economies of many countries if we don't urgently start to curb our emissions.
One of the foremost denialist mantras at the moment is the notion that climate scientists are "extremist" - an yet Sherwood's words are simply "profound impacts"... This is hardly an extremist statement, so I struggle to understand why there is such venomous antipathy to the warnings of the professional scientists. Even Dana refers to "potentially catastrophic" results - I'm happy to go out on a limb and say that the adverb is unnecessary and that 4+ °C will be catastrophic if we allow the planet to warm to that extent.
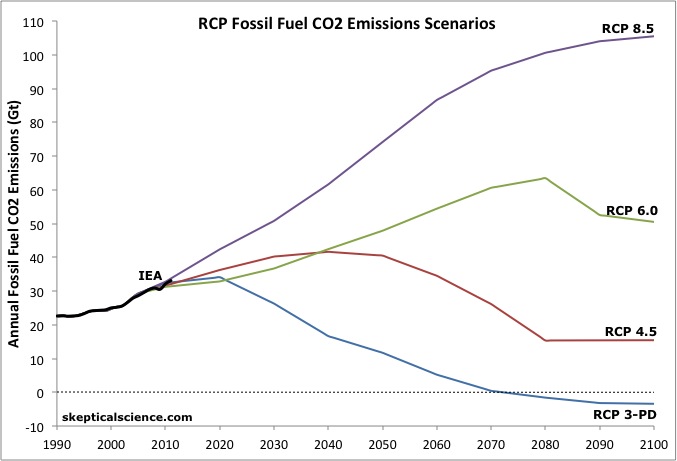
It's worth noting that we're tracking close to the RCP8 pathway, although I think that over the course of the century the RCP6.5 pathway is likely to be closer to what eventuates. Taking this latter emissions trajectory into consideration and using Sherwood's et al results we are heading for somewhere between a tad under 5 °C and a smidgin over 7 °C of warming since the beginning of the Industrial Revolution. And this is only for 2100 - not for the eventual plateauing of the trajectory...
My money's currently on the the lower end of Sherwood's et al estimate for equilibrium climate sensitivity (for a couple of years now I've punted for 3.4 ± 0.2 °C for ECS) but this is still in "catastrophic" territory with a respond of just over 5 °C by 2100 is we continue with business as usual for the rest of the century. Even half of that amount of warming would be "catastrophic" for hundreds of millions (at least) of people and for >20% of the planet's biodiversity, and given that we're just about locked into that lower temperature plateau already, based on an assumption of a (now apparently conservative) 3 °C ECS and the emissions intentions of the international community for the forseeable future, there seems to be no way to avoid a bad end. And despite all this we continue to conduct out business such that we track at the higher end of emissions.
It's really a choice of a 'little' catastrophe in the future, or a big one. How long before we finally stop shovelling coal into the boiler?
-
Tom Curtis at 14:34 PM on 9 January 2014Climate's changed before
pheidius @371, the background rate of natural emissions of CO2 over the last several million years has been 0.09 Gt C per annum. That compares with a current rate of industrial emissions of 8.2 Gt C per annum. That is, rather than a 10-25% increase of emissions, there has been a 90 fold and counting increase. If you feed that into David Archer's GeoCarb model by setting the transition CO2 spike to 0, and the simulation CO2 degassing rate to 682.5 x 10^12 mol/yr, then look at the result after a million years, you will see that the CO2 concentration is still increasing linearly after a million years. Effectively, the current rates of emissions of CO2 are so high that they cannot be stabilized by geophysical processes. Only be radically reducing emissions can we stabilize.
In contrast to the current rate of anthropogenic emissions, a 25% increase in the base background rate of emissions (simulated by setting the degassing rate to 9.4) results in an atmospheric increase to only 510 ppmv after a million years. Importantly, after 500 years there has only been an increase in CO2 concentration from 273 to 276 ppmv, and a corresponding temperature increase of 0.1 C. In contrast, in half that time, from 1850-2100, anthropogenic emissions will raise CO2 levels and temperatures by approximately the equivalent of a million years of Deccan traps outgassing.
What makes this fact worse is that species adjust to changes in temperatures either by migration or adaption. For most species the potential for migration is low, and the speeds of migration are slow. For some species, at high altitudes or at the poles, there is no potential for adjusting by migration at all. Species in those regions face a future of extinction as better migration by species better adapted to the new, warmer conditions results in their being out competed in the areas they formerly dominated.
For those species that must rely on adaption, we face the conumdrum that evolution is slow relative to human scales, though rapid in geological terms. An indication of how slow evolution is is the fact that many humans are still ill adapted to diets high in milk (lactose intolerance) or grains (glutten intolerance) 12 thousand years after the invention of agriculture. As it happens, most species are currently adapted to conditions colder than those that prevailed pre-industrialization. That follows from the slow pace of adaption and the fact that just 10 thousand years ago the world was much colder for 100 thousand years. So, for adaption, species are already behind the eightball. And now they are faced with the prospect of adapting to a million years of warming in just 250 years.
Given these facts, it is probable that the current anthropogenic warming will result in extinctions far greater in number than those caused by the Deccan traps.
-
pheidius at 13:38 PM on 9 January 2014Climate's changed before
Ok, I asssume this forum will be eager to slap this down but I am honestly trying to do the math based on geological evidence. First, there is little doubt that the recent Co2 increases can be attributed to anything else but human impact. What i don't get is that the math doesn't seem to add up to any serious problem unless measured in Ma. I will use an average increase of 10% per year based on the numbers in the original header. I note that the Dacaan traps are briefy cited in one of the posts. Dewey M Mclean in his 1985 paper, " Deccan Traps Mantle Degassinging the Terminal Cretaceous Marine Extinctions," has established the mechanism of volcanic outgassing being the proximate cuase of several mass extinctions(besides the one cited in this paper). This theory has now largely surplanted the impact theory and should rightly be taken as a blue print of how excess Co2 could cuase mass extinction events. The problem I am having in looking at the numbers is trying to understand why the current increase is seen with such alarm and portrayed as immently catstrophic in affects. If you read this paper, you will see that he asserts that this geological event increased the rate of annual Co2 outgassing over baseline by 10-25% . This increase is comparable if you take his lower number and far greater if you take the higher numbers. Becuase of the intermittent periods of eruptive events of the traps, the anual numbers probably ran up and down this scale of averages. Still the mean increase would be substantialy higher than the modern rate of increase. The problem I have with these numbers comes down to this: this paper asserts that these increase took place in a .53-1.32 Ma time frame. For the sake of simplicity, lets use 1,000,000 years as a round number. I just can't imagine what is so different now about the earth that it could handle 1,000,000 years of continual co2 increase before pitching a fit, but now is only seen as capable of going only a few hundred years before an extinction event is seen looming. Help me out here.
-
Riduna at 11:31 AM on 9 January 2014New Study Suggests Future Global Warming at the Higher End of Estimates: 4°C Possible by 2100
My understanding of the Sherwood Paper is that it says cloud formation at lower altitudes (>850 hPa) reduces as temperature increases because of mixing with cold dry air from mid troposphere (<750 hPa) dissipating water vapor near the surface. In other words, the warmer it gets, the less low cloud is formed, reducing its albedo and increasing solar radiation reaching the surface. Is this wrong?
-
Tom Curtis at 10:39 AM on 9 January 2014Talking Trash on Emissions
chriskoz @14, emisssions from LUC are considered distinct from those due to the CO2 fertilization effect, melting of permafrost and other feedbacks. Consequently they are not strictly part of the terrestial carbon sink. Nor should we consider them so unless we also want to consider deforestation in the Amazon as also part of that sink. As noted before, while LUC in the US is a net sink, globally it is a net source of emissions. I don't object to the exclusion of LUC or CO2e in popular articles to allow simplicity of communication. However, when queried we should point to more detailed sources that include those complications. Indeed, if we follow Schneider's principle, we should include pointers to such more detailed treatments in the article, or at least indicate that you are simplifying.
Your point about the export of emissions, however, is a good one. I do not know where any such detailed calculation is made, however, the US exports 0.7% of its GDP to China, and imports 5% of China's GDP back. The net effect gives, as a first approximation, that the US trade with China "exports" 5% of US emissions. That is, US emissions per capita would be 5% greater if it manufactured internally the products it currently purchases from China.
-
gws at 10:33 AM on 9 January 2014Methane emissions from oil & gas development
deweaver @28: That number was calculated from methane soil uptake flux data dividing by the atmospheric concentration (definition of deposition velocity; used when uptake is first order as in teh case of microbiol uptake). Typical uptake rates are around 1 mg m-2 d-1, atmospheric methane is about 1.2 mg m-3. Gives about 0.001 cm/s, I meant to estimate high. I see if I can find some papers to list here. Compared to other gases, soils are not good sinks for methane.
-
Tom Curtis at 10:20 AM on 9 January 2014Talking Trash on Emissions
grindupBaker @13, the graph you are thinking of is from Archer et al, 2009:

It should be noted that the percentages you give are for a one of, instantaneious dumpt of CO2 into the atmosphere. As it happens, just 44% of all human emissions including those from landuse change currently remain in the atmosphere. That means the reduction will be to 60% of the current CO2 anomaly over the next couple of thousand years, ie, to about 25% of the total emissions.
The aphorism is intended to place things in perspective in human terms, not geological terms. In human terms, 2.5 ky is the age of western civilization, dating from its origins in ancient Greece. It it 3 times the duration since the early beginnings of modern constitutional government with the signing of the Magna Charta. It is 10 times the duration since the signing of the declartion of independence. In a world in which governments have difficulting pursuing policies with a time scale greater than the electoral cycle, it is forever.
Even form a geological perspective, however, the increase in CO2 is noticable. It will not finally return to natural levels until a million years from now, 80 times the duration since the invention of agriculture, and five times the duration of our species.
(Note: the duration to eliminate excess CO2 from the atmosphere depends critically on the amount dumped, with significantly shorter times to a given percentage remaining with lower levels of cumulative emissions.)
-
chriskoz at 10:10 AM on 9 January 2014Talking Trash on Emissions
grindupBake@13,
Your critique is inaccurate. You argue that:
2.5ky (when up to 50% CO2 emissions stays in A) is only a small fraction of forever
while the sentence in the article "Most of the CO2 in the air will stay there essentially forever"
Note that "essentially forever" is different than "forever", so your critique does not aply. I think that 2.5ky can well be considered "essentially forever" is human lifetimescale, especially the lifetime of those who only want to "enjoy" the benefit, or to pocket the profit from the continuous FF burning. Therfore, "essentially forever" should not be considered a "hyperbole" here.
-
chriskoz at 09:50 AM on 9 January 2014Talking Trash on Emissions
Tom@12,
Thanks for that important update.
So the numbers in this article appear to underestimate (contrary to my previous assertion) US emissions when grant total CO2e is considered which is reasonable.
It's also worth noting that US land use changes are part of terestrial carbon sink when total CC budget is considered, therefore land use emission importance, or "seriousness factor", is smaller than the "seriousness" of 100My old fossil carbon. Therefore, I agree with the land use can be exclused from this consideration.
As a side note, I want to mention that US, similar to many developed countries) export lot of their emissions to G77 countries. Lots of products and goods requiring energy to produce therefore having high C footprint, are produced in countries like China and then imported to US for consumption. Emissions used to manufacture the products are attributed to China. If we attribute them to US, calculating the more proper "total consumer emissions", the average US citizen would "dump" even more CO2e in the air. Has anyone done such "consumer emissions" calculations and can show the numbers?
-
grindupBaker at 09:36 AM on 9 January 2014Talking Trash on Emissions
AGU meeting 5-9 Dec 2011 has Davied Archer et al graph showing residual CO2 in air after future years as:
100 52%-79%
200 48%-74%
500 36%-68%
1k 32%(24% outlier)-61%
2.5k 21%-50%
3k 19%-44%
10k 10%-32%
Since 2.5ky is only a small fraction of forever, the "Most of the CO2 in the air will stay there essentially forever" is somewhat hyperbole and contradicts the following "for many millennia". Fine for social-science of course (human lifespans & whatnot) but unsuitable as a physical science comment. -
idunno at 09:22 AM on 9 January 2014The Weekly Standard's Lindzen puff piece exemplifies the conservative media's climate failures
Hi Dana,
Re your concerns about trolling, expressed elsewhere.
I have previously noted that the amount of trolling on there goes up inordinately as soon as WUWT publishes an attack-piece on your work, or those of other regulars.
Imho, it would be very helpful if you, somebody, possibly me, possibly their own mods were to at least politely welcome the new arrivals, so that everybody is aware of what is going on.In an ideal world, you might even be able to coordinate with one of the burgeoning WUWT satire/rebuttal sites and link to the rebuttal by way of a welcome. In my own opinion, a dose of hotwhopper, What'sUpWithThatWatts, or similar, would be very good for some of them.
Cheers.Moderator Response:[PW] Eliminated unnecesary white space.
-
Tom Curtis at 08:48 AM on 9 January 2014Talking Trash on Emissions
Further to scaddenp @11, that only fossil fuel and cement manufacturing emissions are not included means that CO2 emissions from human respiration is not included (as it should not be). It does mean, however, that US emissions are slightly over estimated as the US has been a net sink for CO2 due to land use change. Globally, however, land use change is a net source of CO2, accounting for about 20% of all emissions.
Using EPA figures, US land use changes result in net emissions of -800 million tonnes of CO2e per annum, out of 6,700 million tonnes of CO2e per annum. That is, emissions from fossil fuels and cement manufacture would have been 7,500 million tonnes per annum absent the regrowth of forests, draining of swamps and other land use changes. The "e" means they are recording CO2 equivalents, ie, the total emissions of all greenhouse gases measured in terms of equivalent effect of CO2.
Recalculating for CO2 equivalents, and using the 2011 population, that means US citizens dump 58.8 kg of CO2e per day, or 53.5 kg CO2e for each kg of solid waste they dump. Thus, the overestimate by ignoring land use changes is more than made up by the underestimate of the effect by considering only CO2.
-
Tom Curtis at 08:24 AM on 9 January 2014The Weekly Standard's Lindzen puff piece exemplifies the conservative media's climate failures
Frankelfin @various:
1) Mathematically, it is inaccurate to talk about a linear trend slowing. At the trend is linear, it has constant slope. So, at most you can claim that the trend from 1981-1997 is greater than the trend from 1997-2013, but see (2) below.
2) More importantly, mathematically when you calculate the OLS trend, you apply a statistical model that assumes there is an underlying linear signal, plus some random noise. The calculated OLS trend represents a best estimate of the underlying trend, but it is inaccurate to say the trend has changed just because the best estimate of the OLS trend differs between two segments. Rather, you need to show that the difference is statistically significant. If you do not, the calculated difference has no bearing on the slope of the underlying trend. As it happens, the difference in slope between 1997-2013 and 1975-2013 is not statistically significant, so there is no basis to claim the trend has changed.
3) Restricting ourselves to just the annual (or monthly) global temperature observations, we have more reason to think that the underlying trend has increased rather than decreased with the addition of the last 16 years data. That is because the best estimate of the long term trend (whether calculated from 1880, 1901, 1975, or 1981) has increased as a result of adding those years to the data. Indeed, from 1991 to 1997 the Gistemp OLS trend is 0.068 +/1 0.01 C per decade, whereas from 1901 to the end of 2013 it is 0.084 +/- 0.009 C per decade. That is, the additional data from 1997 onwards results in a statistically significantly greater trend. Deniers attempt to misrepresent this state of affairs by falsely describing the temperature data after 1997 as "a pause" or "no warming" even though it results in a statistically significant increase in the centenial trend.
4) We do not have to restrict ourselves to the temperature data alone to determine whether or not the difference in short term best estimates of the trend are due to differences in the underlying trend or simply due to noise. We can actually look at some of the known sources of noise to determine their likely effects. In particular we can look at ENSO, which is known to be the dominant source of short term noise in the temperature record:

The inverted SOI is the best characerization of the ENSO signal, IMO. Other ENSO indices rely on temperature records, often of a single region. As a result they must inevitably include the global warming signal as part of their ENSO record. By using a pressure difference rather than temperatures, the SOI avoids that trap. Consequently the inverted, lagged SOI is an ideal independent characterization of the noise in the temperature record (excluding that from volcanoes). As can clearly be seen, the noise shows a strongly negative trend over the last 16 years. It follows that the underlying temperature trend will be significantly greater than the best estimate of that trend from temperature data alone over that period.
In summary, in your dispute with KR you are trying to make a narrow mathematical point, ie, that the best estimate of the OLR trend from 1997-end 2013 is less than the best estimate of the OLR trend from 1975 (or 1985) to 1997. If you are going to be a stickler on mathematical points, however, you don't get to stop halfway. Being entirely accurate mathematically supports KR's contention. Further, we have independent evidence that the supposed "pause" in warming over the last 16 years depends entirely on treating known noise as part of the long term trend.
-
scaddenp at 08:16 AM on 9 January 2014Talking Trash on Emissions
Joel, if you follow the link for the source of 17 tonnes of CO2 emissions, you find this statement:
"The data only considers carbon dioxide emissions from the burning of fossil fuels and cement manufacture, but not emissions from land use such as deforestation."
So this is total emissions for a country from CDIAC inventory divided by population. It includes emissions by businesses as well personal use.
-
The Weekly Standard's Lindzen puff piece exemplifies the conservative media's climate failures
franklefkin - Short data sets do not allow drawing any conclusions about underlying trends, as they are overwhelmed by noise (short term variation). Data trends without statistical significance, yes. Climate trend identification, which I consider far more relevant, no. My apologies if that was unclear; I thought that my discussion of statistical significance clarified matters.
As to the comparison of 1975-1997, 1997-present, and 1975-present, you do see that the 1997-present data (0.076 ±0.119 °C/decade 2σ), while crossing over the previous trends, has _not_ gone as far below the 1975-1997 or 1975-present slopes as 1998 raised it above? And therefore (as both Tom and I noted) that the inclusion of the most recent 16 years increases the observed long term climate trends? The temperature data is exhibiting behavior consistent with regression to the mean and short term variation over the recent (again, not statistically significant) period.
You've miscompared trend periods between Toms and my posts, and although as discussed we have insufficient data from the last 16 years to determine if climate trends are slowing, or for that matter accelerating (see here), you continue to emphasize it. Perhaps I'm missing something, but I just don't see where you are going with this...
-
Joel_Huberman at 07:24 AM on 9 January 2014Talking Trash on Emissions
Another confusing aspect of this otherwise excellent article is the question of the source of the CO2 being measured. We humans, like other animals, release CO2 when we exhale. But the CO2 we breathe out does not raise the level of CO2 in the atmosphere, because the CO2 we exhale comes from the carbon in our food, which was recently extracted from the atmosphere by plants during the process of photosynthesis. What's not clear is whether the CO2 discussed in this article is only CO2 derived from fossil sources, or does it also include exhaled CO2?
-
franklefkin at 07:01 AM on 9 January 2014The Weekly Standard's Lindzen puff piece exemplifies the conservative media's climate failures
KR,
Your assertion that "the trend is slowing" is simply not supported by the data.
The trend for the last 16 years (17 inclusive) as calculated by Tom 0.076 C/dec
The trend for the 23 years inclusive, just prior to the above, as calculated me 0.155 c/dec
The rate has dropped to half. I'd say that the data does support my claim.
Again, I am not adding anything regarding statistical significance to the argument, nor am I saying that the 17 year "slowdown" means anything at this point.
I am aware of what regression to the mean is.
-
The Weekly Standard's Lindzen puff piece exemplifies the conservative media's climate failures
franklefkin - I fail to see where you have an issue. Both Tom Curtis and I noted that the additon of the last 16 years to the previous record shows a higher rate of warming (acceleration), and while that increase is not statistically significant there is certainly _no_ evidence of a slowdown. You should really read up on regression to the mean.
Your assertion that "the trend is slowing" is simply not supported by the data.
-
franklefkin at 06:33 AM on 9 January 2014The Weekly Standard's Lindzen puff piece exemplifies the conservative media's climate failures
KR,
I was referencing your statement
As Tom noted, including that most recent 16 years actually increases the long term trend estimate, as they average above the 1975-1997 trendline; warming has not halted.
When I said that the number was larger than the number Tom indicated. It was you who brought 1975 into the discussion. I just pointed out that your numbers were incorrect. 16 years is too short, I didn't say otherwise. Since a comparrison of the rate during the last 16 years was made to the previous 16 years, I thought the correct trend, and the correct time duration should be used. FWIW, it should probably be 1980 to 1996 however, but since you used 1875 to 1997, I kept 1997 as the end point.
-
deweaver at 06:28 AM on 9 January 2014Methane emissions from oil & gas development
gws,
How do you get a velocity of only 0.01 cm/s. When the rate of distruction in soils and on surfaces are a non-linear funtion of the concentration and the problem of mass transport from the atmosphere to the soil is a complex problem with both advection terms due to atmosperic pressure fluxiations and diffusion terms, there is no way a simple velocity function could every fit the data.
Once the concentation is above Smin (energetic break even concentration for the bacteria), the biomass will rapidly increase to bring the concentration back down to Smin in a dynamic equilibrium with the mass transfort function. With diffusion being an X^2 type function, non-linearity is basic to the problem and increasing concentration can result in a very rapid destruction rate with all moist surfaces biodegrading methane as fast as it reaches the surface.I don't know that concentration level, but we should know it.
Prev 781 782 783 784 785 786 787 788 789 790 791 792 793 794 795 796 Next


