


 Arguments


Global warming is being caused by humans, not the sun, and is highly sensitive to CO2, new research shows
Posted on 9 January 2014 by dana1981
Over the past few weeks, several important new papers related to human vs. natural climate change have been published. These papers add clarity to the causes of climate change, and how much global warming we can expect in the future.
First, a paper published in the Journal of Climate by Jara Imbers, Ana Lopez, Chris Huntingford, and Myles Allen examines the recent IPCC statement that expressed with 95 percent confidence that humans are the main cause of the current global warming. One of the main challenges in attributing the causes of global warming lies in the representation of the natural internal variability of the Earth's climate. The study used two very different representations of natural variability. The first model assumed that there is short persistence in the internal variability, therefore the present climate is mostly determined by the recent past and there is a finite time scale beyond which the memory of the system is lost. The second model assumed that the climate's internal variability has long persistence and the present climate is influenced by all the previous years with no finite time scale beyond which the memory of the system is lost.
The authors then combined each of these representations of natural variability with a statistical multiple regression approach to estimate the individual contributions of the various forcings (e.g. solar, volcanic, greenhouse gases) to the increase in average global surface temperature. In each case, the study found that the greenhouse gas-global warming signal was statistically significant, supporting the robustness of the IPCC statement on human-caused global warming. As lead author Jara Imbers told me,
"...we investigate two extreme cases of the plausible temporal structures of the internal variability, and we find that the anthropogenic signal is robust and significant."
Second, a paper published in Nature Geoscience by Andrew Schurer, Simon Tett, and Gabriele Hegerl investigates the sun's influence on global climate changes over the past 1,000 years. Although we know the sun can't be causing the current global warming because solar activity has declined slightly over the past 50 years, "it's the sun" nevertheless remains one of the most popular climate contrarian arguments. However, in recent years, research has pointed in the direction of a relatively small solar impact on the Earth's climate changes.
It's important to realize that while the Earth is bombarded by a lot of heat from the sun, the amount of solar energy reaching the planet is relatively stable. According to the best recent estimates, it's only increased by about 0.1 percent over the past 300 years, causing a radiative forcing less than 10 percent as large as the human-caused forcing over that period.
In this study, the authors tested reconstructions with relatively high and low changes in solar activity, and compared them to northern hemisphere temperature reconstructions over the past millennium. The reconstruction using relatively high solar activity and a stronger solar influence (green) was a worse fit to the temperature data (blue) than the reconstruction with the weaker solar influence (red), especially around the 12th century.
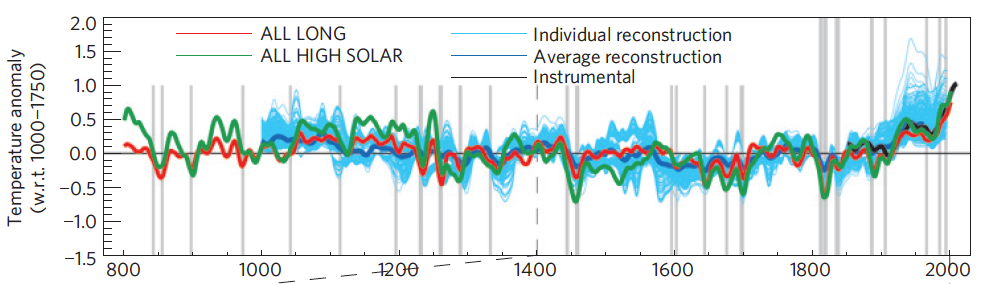
Simulations with all external climate influences including strong (green) and weak (red) solar influences, compared to the ensemble of northern hemisphere surface temperatures over the past 1,000 yeas (blue) and instrumental surface temperature measurements (black). From Schurer et al. (2013).
As in the Imbers paper, this study uses a statistical multiple linear regression approach to determine the contribution of each factor in the measured temperature changes. The authors conclude,
"Volcanic and GHG forcings seem to contribute most to pre-twentieth-century climate variability, whereas the contribution by solar forcing is modest, agreeing with the simulations with low solar forcing."
The study finds that the sun is unlikely to have caused more than 0.15°C of the observed approximately 1°C warming over the past 300 years. The authors find a detectable greenhouse gas influence on the climate before the 20th century, and consistent with the IPCC and Imbers, they conclude that humans are the dominant cause of recent global warming.
"Over the twentieth century, anthropogenic forcings dominate with GHGs the largest forcing, offset by the effect of anthropogenic aerosols and land use changes"
However, the authors note that while the sun has little impact on average hemispheric and global temperatures, it does have a significant influence on regional temperatures, for example in Europe.
Finally, a paper published in Nature by Steven Sherwood, Sandrine Bony, and Jean-Louis Dufresne examines the role that clouds will play in the sensitivity of the global climate to the increased greenhouse effect. To this point, cloud responses to global warming have remained a key uncertainty.
We know that a doubling of the amount of carbon dioxide in the atmosphere will cause a bit more than 1°C global surface warming by itself, and we know that there are several feedbacks that will amplify that warming. The amount of water vapor in the atmosphere – another greenhouse gas – increases as the planet warms, amplifying that warming. This is the single largest feedback, and is increasing as climate scientists expect. We also know that melting ice makes the planet less reflective, causing it to absorb more sunlight, also amplifying global warming. And carbon released from various sources like beneath melting permafrost and from burning peatlands will also increase the greenhouse effect as another positive feedback in a warming world.
However, we know of few significant negative feedbacks that will offset these effects and dampen global warming. The climate contrarian 'don't worry, be happy' approach is dependent upon the climate being relatively insensitive to the increased greenhouse effect, which requires that something offset all of these warming feedbacks. Clouds, whose responses in a warming world have been difficult to pin down, were the contrarians' last and best hope. An increase in cloud cover in response to global warming would reflect more sunlight back out to space, thereby cooling the Earth and offsetting some of those positive warming feedbacks.
The authors of the Nature study examined cloud change simulations in relatively low and high sensitivity climate models. As summarized by Rob Painting, they found that the less sensitive models were incorrectly simulating water vapor being drawn up to higher levels of the atmosphere to form clouds in a warmer world. In reality (based on observations) warming of the lower atmosphere pulls water vapor away from those higher cloud-forming levels of the atmosphere and the amount of cloud formation there actually decreases, resulting in another positive global warming feedback. Lead author Steven Sherwood describes the study in the video below.
These results are consistent with Fasullo & Trenberth (2012), who found that only the higher sensitivity climate models correctly simulated drying in key cloud-forming regions of the atmosphere. Likewise, preliminary results by scientists at the California Institute of Technology Jet Propulsion Laboratory presented at the 2013 AGU meeting showed that higher sensitivity models do the best job simulating observed cloud changes. These results are also consistent with Lauer et al. (2010) and Clement et al. (2009), which looked at cloud changes in the Pacific, finding the observations consistent with a positive cloud feedback.
To summarize, the evidence that humans are the dominant cause of the current global warming is overwhelming (which is the reason behind the 97 percent expert consensus), and continues to grow. And while the media has lately tended to focus on the few papers that suggest climate sensitivity is relatively low, there is a growing body of evidence based on cloud observations that it's actually on the high end, above 3°C warming in response to doubled CO2, which under business as usual would lead to more than 4°C warming by 2100 – a potentially catastrophic scenario.
In short – it's us, it's bad, and if we don't change course, it's a potential catastrophe.
Note: the papers discussed in this post have been incorporated into the rebuttals to the myths It's the sun, Clouds provide negative feedback, and Climate sensitivity is low.


On the matter of the climate sensitivity side of things Steven Sherwood says:
One of the foremost denialist mantras at the moment is the notion that climate scientists are "extremist" - an yet Sherwood's words are simply "profound impacts"... This is hardly an extremist statement, so I struggle to understand why there is such venomous antipathy to the warnings of the professional scientists. Even Dana refers to "potentially catastrophic" results - I'm happy to go out on a limb and say that the adverb is unnecessary and that 4+ °C will be catastrophic if we allow the planet to warm to that extent.
It's worth noting that we're tracking close to the RCP8 pathway, although I think that over the course of the century the RCP6.5 pathway is likely to be closer to what eventuates. Taking this latter emissions trajectory into consideration and using Sherwood's et al results we are heading for somewhere between a tad under 5 °C and a smidgin over 7 °C of warming since the beginning of the Industrial Revolution. And this is only for 2100 - not for the eventual plateauing of the trajectory...
My money's currently on the the lower end of Sherwood's et al estimate for equilibrium climate sensitivity (for a couple of years now I've punted for 3.4 ± 0.2 °C for ECS) but this is still in "catastrophic" territory with a respond of just over 5 °C by 2100 is we continue with business as usual for the rest of the century. Even half of that amount of warming would be "catastrophic" for hundreds of millions (at least) of people and for >20% of the planet's biodiversity, and given that we're just about locked into that lower temperature plateau already, based on an assumption of a (now apparently conservative) 3 °C ECS and the emissions intentions of the international community for the forseeable future, there seems to be no way to avoid a bad end. And despite all this we continue to conduct out business such that we track at the higher end of emissions.
It's really a choice of a 'little' catastrophe in the future, or a big one. How long before we finally stop shovelling coal into the boiler?
If Sherwood 2014 ECS of 4°C is correct, then the actual equilibrium deltaT will be incidentally equal to the W/m2 forcing, which is the RPC number. That makes it very easy to calculate, e.g. RCP6.5 - 6.5°C.
That does not mean that I like the larger deltaT; but the simplicity is my favourite aspect of any knowledge according to KISS paradigm especially important while talking to denialists.
FYI the block-quoted text from Jara Imbers, likely because it is cut off before being completed, is affecting the formatting on the main page. At least, that is how it appears to me.
Thanks Composer, fixed.
This may stir up a hornets’ nest...
I have a slight problem with the title of this article because the wording is low hanging fruit for the denial-istas to focus on the title and not the message.
All warming is caused by the sun.
The fact that recent increases and the temporal rate of increase has, as the one of the authors is quoted as saying, a robust and significant anthropogenic signal does not change the fact that all heat is derived from the sun. If anything our impact is effecting what should be the natural release of this energy back from whence it came.
Our impact is what this article is about and the research helps to further establish that fact.
I have no issue with the central article just the awkward choice of title and how it could easily be manipulated to discredit the message inside
Thank you for this excellent article.
There is one point I would like to make, not on the science, but on the message.
People advocating doing something to counteract anthropogenic climate change are sometimes accused of being pleased when there is some extreme weather or such.
The line in the article "Clouds, whose responses in a warming world have been difficult to pin down, were the contrarians' last and best hope." could look the same.
In fact, clouds may have been all of our last and best hope. If they are a positive feedback, that is bad news.
YubeDude - You are technically correct, as all but a tiny fraction of climate energy (excepting geothermal) comes from the sun. And all of the cooling consists of IR to space.
The changes in forcings leading to recent changes in climate, however, are changes primarily caused by anthropogenic emissions. And natural forcings including the sun are not significant causal agents, as they have not changed sufficiently nor in the correct direction for recent warming.
I'm not saying this paper is wrong, nor am I trying to take issue with the general concept that CO2, whether from humans or other sources, contributes to general global warming. However, the statement in this article to the effect that "we know that the sun is not the cause of recent warming because solar activity has been declining" cannot be supported. If, for example, solar activity was at a relatively high level over the last 50 years, then a slight decline, or even a substantial decline, in that activity might still be consistent with primarily solar induced warming. For the same reasons, a car can continue to accelerate even if you take your foot off the throttle a bit, as long as you're still giving it enough gas to continue acceleration. Solar warming would be driven not by the rate at which solar activity is declining or increasing but rather by the relative level of solar activity in comparison to earlier periods.
[TD] Insolation has not continued to increase but just less fast as your gas pedal analogy implies. Instead, insolation has been flat or even decreased. You are correct in your implication that there is a lag during which the energy of the Earth's system continues to increase after a forcing such as insolation stabilizes. However, literally the moment that the insolation stops increasing, the energy imbalance due to the increased insolation starts to decrease. Even if insolation continues to increase but at a lower rate of increase (as in your gas pedal analogy), the energy imbalance instantly will begin to grow at a lower rate. Because the total energy imbalance continues to grow, that imbalance cannot be due to catchup from the previous rise in insolation. The components of the energy imbalance have been teased apart by several researchers.
Moderator - even a declining "imbalance" can cause continued warming, even after the decline starts. Assume I turn my stove burner up to 190 degrees and place a pot of water at 70 degrees on the stove. Even as I turn the burner down from 190, to 170, 160, 150, 140......, as long as the temperature of the burner is higher than the temperature of the water, the water will warm, albeit at a decreasing rate, until the temperature of the burner falls to the water temperature. Temperature increase in the water is driven primarily by the relative temperatures of the burner and the water, not the rate of change (increase or decrease) in the temperature of the burner. Is it not possible that the hiatus in surface temperature increase reflects the decline in insolation from a net warming level to a neutral or even a cooling level? Of course it is.
[TD] That's what I wrote in my previous comment to you. Please read the links I provided there. Further, there is no hiatus in surface temperature increase, but surface temperature is not even relevant to your argument--the total energy content of the whole system is.
Climate Agnostic @9, as you say, if solar insolation increases, it will continue to lead to warmer global temperatures for as long as the increase in insolation excedes the increase in top of atmosphere Outgoing Longwave Radiaton (OLR). However, global temperatures would increase at an increasingly slow rate after insolation ceased increasing, as the difference between incoming insolation and OLR fell with rising temperature. That is not what we see:
Further, if the increase in insolation were sufficient to account for the twentieth century warmth, then the early twentieth century increase in temperature would have resulted in an increase in OLR falling well behind the increase in insolation. It, therefore, should have shown an acceleration which is absent from the record.
Finally, they theory you propose implies a the long delay between increase in forcing and temperature response to that forcing. Such a long delay means that in increase in insolation and temperature in the early twentieth century are coincidental. That is, if your theory is correct, the evidence that has been presented that the Sun is responsible for the temperature increase in the early twentieth century is misleading.
Indeed, had your theory been correct, the initial increase in temperature should have followed the increase in insolation by a decade or more. The increase in temperature would have then accelerated over time, until about 1950/60, whereupon it should have started decelerating. No such pattern is evidenct so that theory is falsified.
Finally, this discussion is strictly off topic on this thread. If you wish to continue, please do so on a more appropriate thread. Once we conclude our discussion on that thread, you can then cite that conclusion on this thread, and discuss the implications for the topic above.
What I find confusing about the skeptics' position is that they seem to be saying that global warming is not anthropogenic in origin so there is nothing that we can do about it. That has to be nonsense, surely? Icebergs and asteroids are not anthropogenic in origin, but it would be strange behavour indeed if we did not try to avoid the former and get the latter to avoid us.
Even if the warming we are currently experiencing were due in large part to an increase in solar radiation, are the skeptics really saying we shouldn't try to reduce our contribution to global warming in order to mitigate the sun's effect? I would have thought that such a situation would call for an even greater reduction of our generation of CO2 even if I did not believe in its effect. The fact that there is such argument about it can only mean that the only choice is to act and hope that it has an effect. The question of whether I was right or wrong would be answered either way. To not act is irresponsible. Especially so when one considers the weight of scientific opinion that is calling for action. Indeed, to not act is akin to giving the finger to future generations.
(In addition to the above, anyone who follows financial matters will know how silly the argument is that we should save up so that we have sufficient funds to enable us to adapt to the increased warmth. The way things are going, the survivors of the coming collapse will probably all be living in caves, chasing wild animals for food and bartering for their daily needs, oh, and commenting on how hot it has become.)
Tom Curtis - Sorry to veer "off-thread" but neither your repsonse nor the moderator's is reponsive to my point. I am not talking about time lags, though they no doubt play a role in deciphering the climate equation. I am simply stating that a negative trend in solar activity could be consistent with solar driven global warming, if the starting point before the decline is high enough to cause warming in the first place. This is a simple mathematical fact. Yes, other factors are at work, including CO2 and other GHGs, and time lags and feedbacks make it difficult to "tease out" the relative effects, but to assert, as the summary of the article above clearly does, that declining solar activity absolutely rules out the sun as a possible driver of late 20th century warming, is simply wrong.
Climate Agnostic, Tom Curtis addressed your objection in his reply: "global temperatures would increase at an increasingly slow rate after insolation ceased increasing, as the difference between incoming insolation and OLR fell with rising temperature. That is not what we see." That increasingly slow rate would be due to the decreasing energy imbalance that the moderator's reply referenced.
Climate Agnostic... Even assuming your speculation is correct, the change in radiative forcing from the sun is still 1/10th that of man-made sources. What you're suggesting doesn't present that much of a change in the overall picture we're looking at.
Climate Agnostic@12,
Can you please elaborate a little bit on that "theory", i.e. explain (or even speculate on) some physical processes that might be responsible for such outcome?
The first part of that sentence contradicts the energy preservation law: the only known source of energy in the climate system - sun - weakens, and everything else (uncluding geothermal that looks remarkably stable) remains the same or its influence is marginal by comparison; but the result ia an overall increase of the energy in the system? That's pure nonsense.
The second part of that sentence is baseless trolling because it does not explain the apparent nonsense, i.e. how the energy in the system is balanced.
If you want to come up with a new theory, the onset is on yourself to provide the realistic basis for it, grounded in our understanding of the physical world. That's how science progresses. If you don't and your "theory" contradicts the known physical world, it remains you imaginary world only, but for everyone else, it remains baseless nonsense.
Climate Agnostic @12, if your point is the very narrow and technical point that it is theoretically possible that global temperatures could continue to rise after the forcing that caused that rise had started to fall, then I have already conceded that point. As it happens, that happens every year when the seasonal peak temperature occurs in August though the relevant forcing (NH summer insolation) peaks in July, and falls thereafter.
However, as I have pointed out @10, the merely theoretical possibility that the increase in insolation to 1950 was the cause of the increase in temperature to 2014 is inconsistent with observations. As a candidate scientific theory, it has been falsified. Therefore that merely theoretical, but in fact falsified possibility is irrelevant to this discussion. At most your point is that the statement:
represents a contingent (inductive) argument ie, one that is not guaranteed to be valid under all circumstances. But unless you wish to argue that all inductive arguments should be avoided, that is irrelevant. The number of circumstances under which the argument is valid far exceeds those under which it is invalid, including the current circumstances as shown @10. Therefore the only 'flaw' in the argument is that it provides less certainty than can be obtained by a more detailed argument.
Now, either you know that the Sun is not the cause of the continuing increase in global warming after approx 1960, in which case you are arguing a mere technicality; or you do not, in which case you are massively confused. The later appears likely in that you appear to think the possibility of ongoing warming from a declining forcing is independent of the lag in the forcing. That is false. If there is no lag, then the increase in temperature at any time will exactly correspond to the increase in forcing, so that at the peak of forcing, you will also be at the peak in temperature.
chriskoz @15, the situation he implies is implicit in the fact that the temperature response lags the forcing. Because of that, the temperature response can be below the equilibrium temperature response for a value less than the peak insolation long after the peak insolation has passed. So long as the decline in insolation has not fallen below that lower value, temperatures will continue to rise, albeit at a slower and slower rate. I discuss this @10.
As mentioned @16, this situation occurs annually. In fact, the peak insolation annually is in December, coinciding with the peak SH insolation. The peak SH temperature, however, lags the peak SH insolation by about a month, and occurs in January. Likewise the peak NH insolation is in July, but the peak NH temperature is in August. Because air over land heats faster than air over sea, the NH has a larger response to changes in insolation than the SH, resulting in the peak global temperature also occuring in August.
Indeed, this situation also occurs daily on a local level, with peak insolation at noon, but peak temperatures around 1 or 2 pm.
It is, however, important to note that this situation can only occur when there is a lag in the temperature response to forcing. Absent that lag, peak temperature will always occur at the time of peak forcing.
A question on volcanoes: Hypothetically, if there were to be a major volcano in the near future, and a subsequent increase in aerosols and reduction in temperature for a while, and at the same time CO2 levels continued to follow the same pattern as before, would the net result centuries later be the same or would some of the effects of the increased CO2 levels be permanently ameliorated?
davidsanger
Generally speaking the cooling impact of volcanic aerosols will dissipate within a few years. Then the full warming effect of the CO2 emerges. As long as the CO2 concentrations remain the same no persistent amelioration can occur. The only remotely conceivable way that amelioration could occur is if it resulted in increased carbon sequestration somewhere, pulling it out of the atmosphere. If volcanic cooling persisted for a long time then it might lower ocean temperatures and allow greater uptake of CO2 by the ocean. However when the volcanic cooling ended the system rewarms and the oceans outgas the CO2 again and result is zip.
The only type of volcanic impact I can imagine have a long term effect would require continuous vulcanism for centuries to millenia, long enough for the increased uptake of CO2 into the ocean to be transferred down to the depths and possibly deposited on the sea floor. If the extra CO2 absorbed is still near the surface when the volcanic cooling ends it will outgas again; it needs to be removed from contact with the surface for any long term impact.
davidsanger - There would be a short-term dip in forcings until the stratospheric aerosols came down, much as we saw with the 1991 Pinatubo eruption - see the stratospheric aerosols below:
[Source]
After that warming would simply resume. At most warming might be delayed 5-10 years, resuming on much the same track after that. And no, no permanent amelioration, just a short delay reaching radiative balance at the same temperature we would reach without such a volcano.
Agnostic@12 Graph at SKS "Sun & climate: moving in opposite directions" linked above shows solar forcing increase of 0.75/4=0.19 Wm**-2 1880-1979. It requires a surface temperature increase of +0.063 Celsius to balance that, so surface temperature should have increased that much 1880-1979, but it actually increased ~+0.39 Celsius, which is 6 times as much as it should have. So, not only is there no hysteresis from the increased insolation 1880-1979 pertaining to the following decades, but some mysterious unknown factor has caused an extra 5 times the warming during 1880-1979, after which it even accelerates. Now that I've discovered this (I should get Nobel Prize) it only remains for scientists to plod away and identify this mysterious warming agent. ** Used Dr. Randall 0.6 Earth bulk emissivity.
thanks KR@20 that's as I suspected, so the end result would just be delayed for a short-term then.
davidsanger #18 Prof. Richard Muller Berkeley Earth web site has an analysis of land-only measurements from 36,000 temperature stations 1750-2000 showing +1.5C (+0.9C over the past 50 years) with a graph of a fit to measurements that's a near-perfect smooth exponential curve punctuated only by a dozen or so very sharp downward spikes of which the 7 largest are volcano-named on the graph Laki, Tambora, Cosiguina, Krakatoa, Agung, Chichon & Pinatubo. Land MST is slightly depressed following each spike, proportional to the spike height, then moves back to the original land MST curve. Data & fitting software are available for download and they invite comment on both.
The discussions here continue to focus on the relatively trivial 7% of AGW in the atmosphere.
A paper showing the top 2m of ocean controls the 93% AGW in the oceans was published 3 January. It suggests heat is transported in the oceans from the tropics polewards to basal melt Arctic ice.
It is based on century-long daily timeseries at Isle of Man that has both tropical and sub Arctic waters with seasonal variations. Earlier work measured evaporation in the tropics. It showed evaporation was temperature and salinity dependent. Buoyant water floats on an ocean heated from above. It is not convective like a kettle on a hob.
Sea surface temperatures taken for atmospheric purposes, needs to be 3000 times more accurate than air temperatures because of the higher heat capacity of water. In any case, salinity in the upper 2m has hardly ever been measured. Large temperature gradients in the top 3m were reported from the tropics
Three phases of warming are shown in the 20th century; warming, slight cooling and post 1986 rapid warming. The authors suggest it is greater than 1C in twenty years. They relate this to three phases of icemelt. First multi-year deep ice keels and tidewater glaciers to about 1939. Then a mid-century slight cooling while ice islands and multiyear ice melted. Finally the present period of annual ice melt.
They showed a mid-century hot cold cycle 1959/1963 coincided with the peak of the 400-year sunspot cycle. It only became apparent for the brief period when solar radiation was two standard deviations larger than long-term means.
Thus, the mid-century cooling was due to maximum icemelt. The declining annual ice suggests that the buffering of AGW has been largely removed. The authors suggest this could lead to more basal icemelt in tidewater glaciers of the Canadian Archipelago and Greenland. Moreover, the north Pacific water is trapped by equatorial divergence and the 50m Bering Strait. This leads to more intense tropical storms and strengthened sub-polar jet streams. Details of the Pacific evaporation and circulation are not yet online. However, they show eleven interconnected counter-rotating divergent/convergent Lagrangian wind-driven surface gyres transport surface water. Buoyant surface water forms a global nutrient circulation system.
These papers suggest that we need to study the upper 2m of oceans to understand the 93% of AGW. Far too much emphasis has been put into land-air based purely on models and unverified statistics. This is likely to give deniers a great weapon.
The Economist has already highlighted the issue: “A simple idea underpins science: ‘trust, but verify’. Results should always be subject to challenge from experiment”, “Modern scientists are doing too much trusting and not enough verifying-to the detriment of the whole of science and of humanity” (Economist, 19 Oct. 2013 p11)
It is far too easy to sit in front of a computer screen and run models or blog on Skeptical Science. We need to ignore all projections and hypotheses until they have been tested by extensive field observations. The paper shows how the unverified SST assumptions missed ocean climate shifts. The mid-twentieth century problem has been discussed extensively on this website. These papers suggest a physical basis from data taken to oceanographic standards. No models were used though the authors have published research on this area.
The authors suggest the problem stemmed from confusing correlation with causation. Correlation coefficient would be better named the coincidence index. It is not a relation like the Navier Stokes equations or the Clasius Clapeyron relation with a physical basis. Coincidence is not causality. All this is in the paper cited.
Given the huge heat capacity of the oceans and verified physics it would be worth switching attention to the upper ocean to understand AGW. Online access is:
Citation: Matthews, J. B. and Matthews, J. B. R.: Possible signals of poleward surface ocean heat transport, of Arctic basal ice melt, and of the twentieth century solar maximum in the 1904–2012 Isle of Man daily timeseries, Ocean Sci. Discuss., 11, 47-122, doi:10.5194/osd-11-47-2014, 2014.
Printer Friendly Version:
[PS] Fixed link
Micawber @24.
I hate to pour cold water on you evident enthusiasm but do you think it is not premature to accept the work of Matthews & Matthews so readily? The paper you link to begins by stating "This is the second of two papers on..." but where is that first paper?
If I look for Matthews, J. B. and Matthews, J. B. R: (2013) 'Physics of the upper ocean', Physics Today, under review, I see no sign of it having been published by Physics Review. And with that first paper absent, the content of the second, that paper you link, that to smacks of being very much prelimenary work. Indeed, Matthew & Matthew 2014 say themselves "Our work needs confirmation by..." and I would humbly suggest the method of than confirmation may not best be achieved with the methods they describe.
My thesis showed that thin tropical cirrus covers a large portion of the globe and small increases in the high cloud fraction can have a large impact on the Earth's longwave radiation budget. Tropical anvil outflow cirrus extends several hundred kilometres with a relatively large mean "observed" longwave cloud radiative forcing from co-located CERES (Aqua) measurements of 33 +/- 20Wm**-2. This is inspite of a considerably drier upper atmospheric conditions and lower ice crystal concentrations (both around 4 fold lower) than deep convective plumes with a longwave cloud radiative forcing of 52 +/- 28Wm**-2.
The radiative impact of thin cirrus in the tropics is not to be undermined. Its microphysics and global impact is profound, yet it is poorly monitored and apparently insensitive to moisture and lower tropospheric conditions.
This work is summarised in Chapter 6 of my PhD thesis - with visualised case studies of atmospheric conditions in the presence of tropical clouds in the Pacific and Indonesian regions in Chapter 5.
https://www.era.lib.ed.ac.uk/handle/1842/7755
[PS] Fixed link
MA Rodger @25
I take the work presented seriously because it is based entirely on over a century of daily observations to oceanographic standards.
It is not wise to trivialise such rare fieldwork. I think it would be wise to consider their thesis that 93% of global warming is in the oceans. It seems to me that this should be the focus of futher work on anthropogenic warming.
There is clearly some hitch in publication of the first paper. However, it is summarised in the introduction. The three phases of warming and the links to Arctic ice melt are important findings. Surely it is worth considering the physics of real rare observations without carping about other issues.
Is it plausible to suggest the three SST warming phases link to Arctic ice melt? What are the consequences? Any research should be verified by experiment. That has been the problem with SST taken for climatological purposes as the authors point out.
Do you wish to challenge the simple fact that SST has been taken from unknown depths and corrected for unverified evaporative cooling or engine room warming since 1955?
Moreover, it is 3000 less accurate for oceanographic dynamics and completely omits essential salinity. That is like measuring air temperature without pressure. Water heated from the top has buoyance dependent on salinity and temperature. None of this is included in current models.
I am enthousiastic about these new findings because they are based on field verification that is the foundation of scientific method.
I suggest you read the whole document and then think about the physics.
Micawber - the note of caution is due to it being apparently not yet published. It is also not wise to rush into enthusiasm over a paper till it has faced the cold hard scrutiny of other expert workers in the field.
The contribution due to TSI fluctuations is close to that theoretically predicted based on energy balance
The Cause of the Pause is due to thermodynamic Laws. It really is not that complicated.
Micawber @27.
You say "I suggest you read the whole document and then think about the physics."
Perhaps I should. Perhaps I will. That I have not thus far is because of a number of factors, not the least being that the document is so badly written. And my advice to any who attempt like Matthews & Matthews (2014) to run the 100 metres against a field of international sprinters when they themselves yet remain reliant on a baby-walker to keep their backside off the floor (I don't think that an unfair assessment of their academic position and their academic ambition): my advice would be to present a paper written to the highest possible standard. From such a position and attempting so much, it is essential that you impress a wide audience with a well-argued thesis and demonstrat that you really do know your stuff. Sadly Matthews & Matthews (2014) is a scholarly nightmare. And it would remain so even if Matthews & Matthews (2013) were published and available, which unforgivably it is not.
I read the Matthews & Matthews 2014 paper: it is indeed badly written, poorly supported, and, at least at this point, amateurish. It may have good points, but they are difficult to tease out of the poorly-written nature of it.
As suggested of me @27, armed with a big mug of hot tea, I sat down and read Matthews & Matthews (2014). My low opinion of it remains unaltered. I didn't spot the header on the document until afterwards. "This discussion paper is/has been under review for the journal Ocean Science (OS). Please refer to the corresponding final paper in OS if available." This is not a published document!! It is still under review.
It is a very strange paper. Previous papers that have been published by the authors are more normal (ie their previous 2-parter, Matthew 2012/Matthew & Matthew 2012 ). Perhaps the authors thought that if their previous work failed to make its mark (the previous 2-parter has nothing but self-citation according to Google Scholar), they should pull out all the stops on this latest one (with its unpublished part 1). And they have certainly pulled out stops - far too many.
The very start of the introduction reads like they saw their work as a step towards doing to SST what BEST believed they were doing to land temperature. The (very long) introduction mainly shows they haven't really nailed what they are trying to say or prove. I see no point, for instance, for the tour of sea level, museum & caves they treat us with. Likewise much else - for instance, the tidal topology of the Irish Sea is not germane to the work they actually present.
The analysis that leads to their results in Fig2a/Table 1 are nowhere discribed. Their results here seem more a confirmation and not a proper statistical analysis to determine the timing of the "distinct periods". I'm sure you could get the same confirmational result from HadSST3 or HadCET, so I don't see what their analysis is providing that is new. (The "distinct periods" appear 'consistent' with the mysterious "three phases of Arctic icemelt" referenced to the unpublished Matthews & Matthews (2013).)
The sunspot discussion is just blather with the statistical comment pure nonsense. Quote of the paper "We therefore suggest the 1959 record high surface waters travelled through the Arctic to produce the record cold-water flux in 1963 on the global gyre system." I'm sure that made perfect sense to somebody once upon a time.
I don't see why only two 10-year analyses were made within 3.6. The 3.7 finding appears strangely at odds with the SST data. The daily density data analysis fig 5b is but curve-fitting. While the salinity discussion is perhaps interesting, it and the data is just lobbed in with no proper introduction. (For instance how rare are data sets such as these?)
The "Heat formerly used in the annual ice melt ... (and) now available for additional surface warming" is worryingly negative in value (and not additive - or is that 'not subtractative'?). The 10% increase in the PIOMAS ASIV cycle may be relevant to cold fresh water fluxes reaching Manx but quite how and why Greenland or fresh river water entering the Arctic Ocean aren't also relevant and quantified is a bit of a mystery. And sea ice thickness is but a digression for those with strong opinions about basal ice melting.
The "Discussion" (4.1-4.3) is for the most part of dubious relevance and back to featuring the unpublished Matthew & Matthew (2013). It contains quite a few raised eyebrows, while the alleged "Conclusions" end with a reference to Matthews and Matthews (2013b) which isn't a listed reference.
A strange paper indeed.
The NOAA NCDC site lists 2013 monthly GMST as 12.54, 12.67, 12.88, 14.22, 15.46, 16.14, 16.41, 16.22, 15.64, 14.63, 13.68 & 12.84 which averages 14.44 by equal monthly weighting or 14.45 weighting by the number of days in each month, but the 2013 annual GMST is given as 14.52. I don't see how that difference can be reconciled.