


 Arguments


A Glimpse at Our Possible Future Climate, Best to Worst Case Scenarios
Posted on 13 February 2013 by dana1981
Recently there has been widespread discussion that perhaps the Earth's climate is not quite as sensitive to increasing atmospheric CO2 as climate scientists previously believed, which would be good news, because it would give us more time to reduce human greenhouse gas emissions before the worst climate change impacts are triggered. The case for a most likely equilibrium climate sensitivity of around 2.5°C average surface warming in response to a doubling of CO2, as opposed to 3°C, is not yet very compelling, but it is certainly a possibility. In fact, the value could very plausibly be anywhere between 2°C and 4.5°C.
This begs the question, what might the future climate look like in best case, most likely case, and worst case scenarios? To answer this question, we will examine how much warming we can expect under various human greenhouse gas emissions scenarios if the real-world equilibrium climate sensitivity turns out to be 2°C (best case), 3°C (most likely case), or 4.5°C (worst case). There is a relatively small chance that the sensitivity could be lower than 2°C or higher than 4.5°C, especially if we consider very long timescales in which slow feedbacks can kick in, and the so-called "Earth System Sensitivity" may be in the range of 6°C surface warming in response to doubled CO2.
Nevertheless, for our purposes here we will limit ourselves to the 2–4.5°C likely equilibrium sensitivity range. But first we have to investigate at what temperatures we expect various climate consequences to be triggered.
Climate Consequence Temperature Triggers
The 2007 IPCC Fourth Assessment Report (AR4) summarizes the magnitudes of impact of various degrees of warming here, and graphically in Figure 1, relative to ~1990 temperatures (~0.6°C above late 19th Century temperatures)
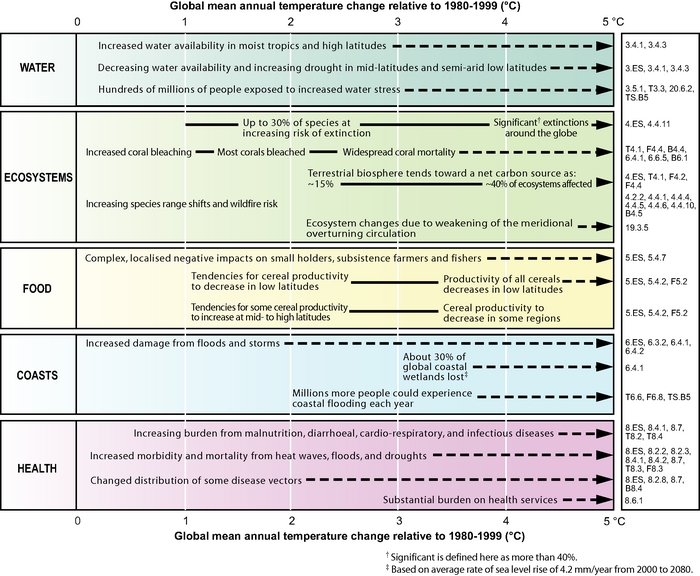
Figure 1: Illustrative examples of global impacts projected for climate changes (and sea level and atmospheric carbon dioxide where relevant) associated with different amounts of increase in global average surface temperature in the 21st century. The black lines link impacts, dotted arrows indicate impacts continuing with increasing temperature. Entries are placed so that the left-hand side of the text indicates the approximate onset of a given impact. Quantitative entries for water stress and flooding represent the additional impacts of climate change relative to the conditions projected across the range of Special Report on Emissions Scenarios (SRES) scenarios. Adaptation to climate change is not included in these estimations. Confidence levels for all statements are high. IPCC AR4 WGII Figure SPM.2. Click the image for a larger version.
Some adverse impacts are expected by the time we reach 1.5°C surface warming above pre-industrial temperatures. For example, widespread coral mortality, hundreds of millions of people at risk of increased water stress, more damage from droughts and heat waves and floods, and increased species extinction rates. However, by and large these are impacts which we should be able to adapt to, at a cost, but without disastrous consequences.
Once we surpass 2°C (which is internationally considered the "danger limit" beyond which we should not pass), the impacts listed above are exacerbated, and some new impacts will occur. Coastal flooding will impact millions of people. Coral bleaching will be widespread (exacerbated by ocean acidification), most coral reefs may not survive (Frieler et al. 2012, Kiessling et al. 2012), global food crop production will decline, and sea levels will rise by close to 1 meter by 2100. Up to 30% of global species will be at risk for extinction.
At 3–4°C warming, widespread coral mortality will occur (at this point corals are basically toast), and 40–70% of global species are at risk as we continue on the path toward the Earth's sixth mass extinction. Glacier retreats will threaten water supplies in Central Asia and South America. The possibility of significant releases of CO2 and methane from ocean hydrates and permafrost could amplify global warming even further beyond our control. Sea level rise of 1 meter or more would be expected by 2100, with the possibility of destabilization of the Greenland and West Antarctic ice sheets, which would cause much more sea level rise and flooding of coastal communities.
For further details, see our post here and the Point of No Return report (pages 23–25) by Ecofys and Greenpeace. To summarize, we do not want to exceed 2°C warming above pre-industrial levels (even that amount of warming is very risky), and 3–4°C or more puts us at serious risk of catastrophic climate change. Now let's examine when we can expect to reach these temperatures in various climate sensitivity and greenhouse gas emissions scenarios.
Representative Concentration Pathways (RCP) Scenarios
The Intergovernmental Panel on Climate Change (IPCC) Fifth Assessment Report will begin to use the Representative Concentrations Pathway (RCP) scenarios. Four scenarios have been developed, and named after the radiative forcing (global energy imbalance) caused by human emissions around the year 2100.
- RCP 3-PD represents a very aggressive scenario, with a peak radiative forcing at about 3 Watts per square meter (W/m²) before 2100, declining thereafter (for perspective, a doubling of CO2 will cause about a 3.7 W/m² global energy imbalance). After peaking in 2020, our annual CO2 emissions decline at a rate of around 3.5% per year. In this scenario, our emissions actually become negative after about 2070, meaning we remove more CO2 from the atmosphere than we add.
- RCP 4.5 and RCP 6 represent global energy imbalances of 4.5 and 6.0 W/m², respectively, and stabilization without overshoot after 2100.
- RCP 8.5 represents a rising radiative forcing pathway leading to 8.5 W/m² in 2100, continuing to rise thereafter.
Figure 2 illustrates how human fossil fuel CO2 emissions evolve over time in each of these RCP scenarios. Our estimated emissions thus far are also shown in black, though while they are toward the high end of the scenarios, it is too early to say yet on which path we're headed.
Note that in RCP 3-PD, fossil fuel emissions peak around the year 2020 and decline thereafter, while they peak around 2040 in RCP 4.5, and around 2080 in RCP 6.
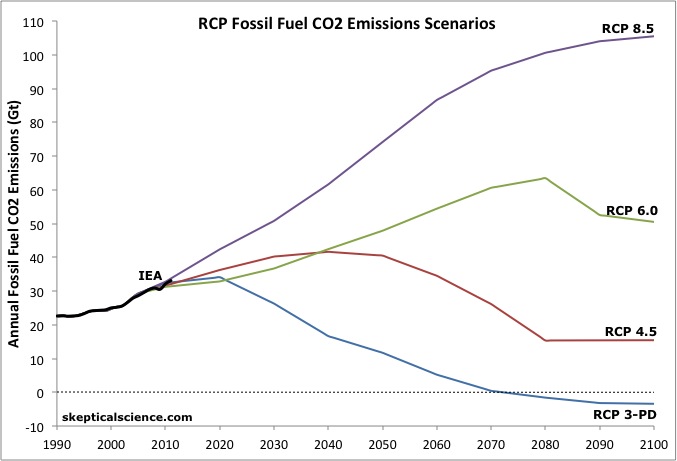
Figure 2: RCP fossil fuel CO2 emissions scenarios through 2100. Emissions estimates from the International Energy Agency (IEA) through 2011 in black.
Figure 3 shows how atmospheric CO2 concentrations change over time in each RCP scenario. Note that RCP 4.5 does not reach 560 ppm (doubled CO2) despite having a 4.5 W/m² forcing (larger than the 3.7 W/m² forcing associated with a doubling of CO2) because it also includes forcings from other human greenhouse gas emissions.
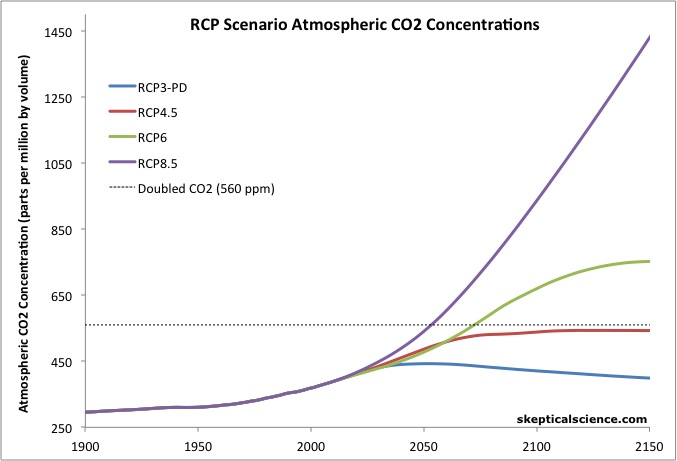
Figure 3: RCP scenario atmospheric CO2 concentrations through 2100.
The Best Case Climate Scenario (2°C Sensitivity)
If we are very fortunate, global surface temperatures will only warm 2°C above pre-industrial levels in response to doubled atmospheric CO2 – realistically that is the lowest equilibrium climate sensitivity we can hope for.
Caveats: The following graphs do not include natural influences on global surface temperatures, or internal variability, but they do include all human forcings. Note that while we focus on the equilibrium climate sensitivity in this post, short-term temperature responses are dictated by the transient climate response. The graphs below primarily show this transient short-term response, and some additional warming that will continue to occur until the planet reaches a new energy equilibrium state. This does not account for possible changes in the carbon cycle, like reduced ocean carbon absorption or releases from melting permafrost, for example. These graphs only consider human emissions, and they're simple approximations (temperature = sensitivity x forcing), not climate model runs.
Figure 4 estimates the amount of human-caused warming we can expect to see from each RCP scenario in a 2°C equilibrium climate sensitivity world.
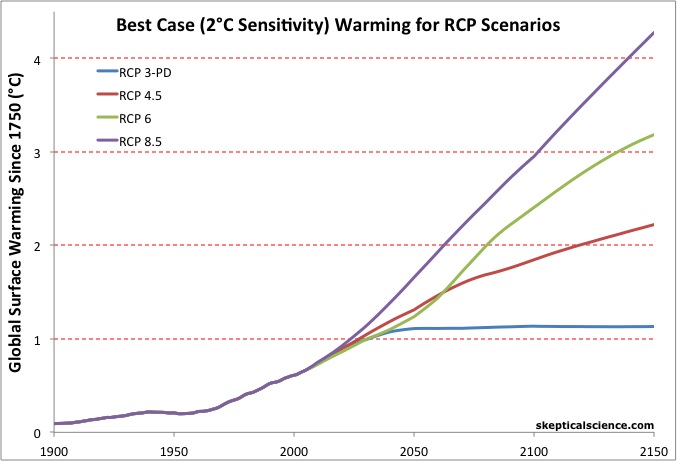
Figure 4: Estimated expected warming for each RCP scenario in a best case world with 2°C equilibrium climate sensitivity.
The best case scenario doesn't look too bad. If we take aggressive steps to reduce human greenhouse gas emissions, we can keep global surface warming well below the most dangerous levels. Even in RCP 4.5, where emissions don't peak until 2040, we will probably not pass the 2°C 'danger limit' in this best case scenario until after 2100, though we will be committed to about 2.4°C eventual warming once the planet reaches a new energy equilibrium.
Quite simply, if equilibrium climate sensitivity is 2°C, then we can double atmospheric CO2-equivalent levels (to 560 parts per million) before we commit ourselves to 2°C surface warming. That will require that we take steps to transition away from fossil fuels, but at a rate which is realistically achievable.
The Most Likely Climate Scenario (3°C Sensitivity)
The most likely reality is a global surface warming of about 3°C above pre-industrial levels in response to doubled atmospheric CO2. Figure 5 estimates the amount of human-caused warming we can expect to see from each RCP scenario in a 3°C equilibrium climate sensitivity world.
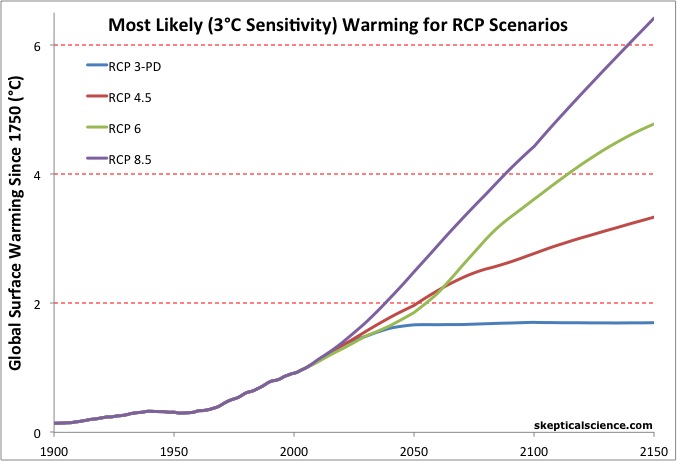
Figure 5: Estimated expected warming for each RCP scenario in a most likely case world with 3°C equilibrium climate sensitivity.
The most likely case scenario is much less encouraging. If our emissions go much beyond RCP 3-PD, we will pass the 2°C danger limit. Even RCP 4.5 commits us to nearly 3°C surface warming by 2100, and 3.6°C once the planet reaches a new energy equilibrium. That's square in the very dangerous and potentially catastrophic range. Any emissions scenarios above RCP 4.5 are probably catastrophic.
The Worst Case Climate Scenario (4.5°C Sensitivity)
In a realistic worst case scenario, global surface temperatures will warm 4.5°C above pre-industrial levels in response to doubled atmospheric CO2. Figure 6 estimates the amount of human-caused warming we can expect to see from each RCP scenario in a 4.5°C equilibrium climate sensitivity world.
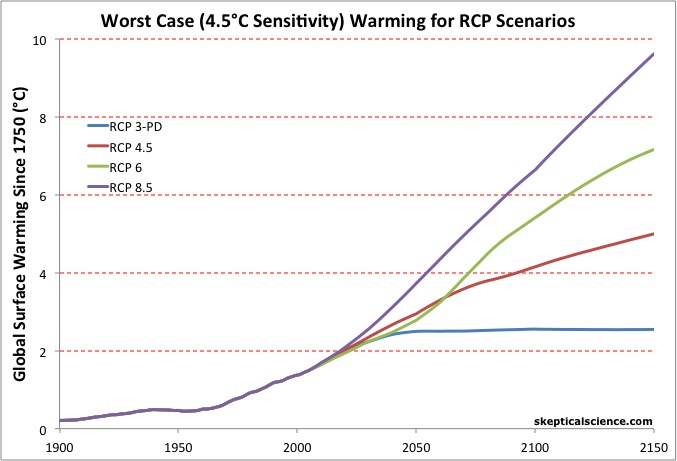
Figure 6: Estimated expected warming for each RCP scenario in a worst case world with 4.5°C equilibrium climate sensitivity.
This worst case scenario is an ugly one. In RCP 3-PD we can at least limit global warming to just a bit into the dangerous range, but in all the other scenarios, we burn our way into a climate catastrophe.
Bottom Line - We Need to Reduce Fossil Fuel Emissions
There is a critical point that must be made here – the worst case scenario is just as likely as the best case scenario. Those who argue that we can proceed under the assumption that the best case scenario is reality do so by cherrypicking convenient evidence and ignoring inconvenient evidence.
So what does this all mean? The only way we can be certain to avoid catastrophic climate change is to take major steps to reduce global fossil fuel consumption as quickly as possible, following a similar path as in RCP 3-PD. The more we delay, the higher the risk of climate catastrophe becomes. And remember, we haven't accounted for account for possible changes in the carbon cycle, like reduced ocean carbon absorption or releases from melting permafrost, or slow feedbacks which may amplify global warming further in the future.
The problem is that at the moment we're moving in the wrong direction. The rate of increase in annual global fossil fuel CO2 emissions was about 3 times faster in the 2000s than the 1990s, and the increases in 2009–2010 and 2010–2011 were two of the three highest annual emissions increases ever (data are not yet available for 2012). At a time when global emissions need to be flattening out and approaching a peak, instead they are accelerating. Power plants have lifespans of decades, so our decisions today lock us into a long-term emissions pathway. We need a global agreement to turn this trend around, and fast – we can't just wake up 10 years from now and decide it's finally time to take climate change seriously.
Note also that ocean acidification is a problem which depends only on future emissions. No matter what the climate sensitivity, ocean acidification will do major damage to global marine ecosystems if we don't get our CO2 emissions under control.
The good news is that we still have time to solve this problem. Even in the worst case scenario we would have a chance to avoid the most dangerous climate impacts with aggressive emissions reductions, and the lower the real-world sensitivity to CO2, the more time we have.
However, that time is running out. Those wishful thinkers who are helping to delay meaningful action to reduce greenhouse gas emissions because they refuse to consider any but the best case scenario are doing the entire world a great disservice.
At this point we only have two options – take urgent action to reduce fossil fuel consumption, or risk a climate catastrophe. The longer we delay, the greater the risk of catastrophe becomes. Get on board, or get out of the way.


The more I think about these scenarios, the more I have come to believe that the most important factors will be the lag in the warming and short term variability.
As humans, we will continue to emit CO2 (doubling and beyond) until a motivated majority experiences or sees a real problem. Then real action will happen. If short term variation and a big lag in the climate response combine to delay that human realization, the ultimate impacts will be that much bigger.
So the real question is (a) when will there be NO doubt in the public's mind that serious action is needed? and (b) at that point how much warming will we already be committed to?
The actual sensitivity is arguably a secondary issue.
ianw01, I agree. It's a bit mabre, I suppose, but I actually find myself hoping for drought, for heat waves, for a (even more) dramatic reduction of sea ice. Anything to shock people out of complacency, so we can go about properly mitigating our risks.
But let's fast-forward 15 years: N. America and Europe have been getting walloped by searing heat waves and drought, interspersed with periods of unprecendented rainfall, causing massive floods. Summer sea ice has effectivly vanished. The era of consequences is upon us. Yet, everything the Deniers hold to be true still applies:
- The earth has been this warm before (true)
- You can't prove that any given meterolgical event is "caused" by climate change.(true)
- It's possible that man is only contributing a small portion of the warming, the rest being caused by: solar flares, ocean turnover, gamma rays, HAARP, volcanoes, God, what have you (untrue, although that doesn't stop people from believing it today)
- Any action we take today will not significanty affect the climate in ourlifetimes (true for just about anybody in their mid 30s -- look at the above charts)
Not sure where you hail from, but in the States there are a not ignsignifact number of individuals who would tell you that God - and only God - can change the climate. This worldview is deeply ingrained in many folks, and virtually impossible to dislodge. Efforts to dislodge it will be met with ever more furvor.
As you said, we'll need a "motivated majority". But unfortunately, it's hard to get motivated about taking actions that at best will yield tangible results in ~40 years. Rolling back carbon taxes or raising emissions caps will always provide immediate economic relief, with the costs pushed out to generations you haven't met yet. Humans are exceedingly good at falling into this kind of reasoning. Just look at our public and private debt levels.
Man. I really took a pessimistic turn there. Maybe I shouldn't have skipped lunch..
*macabre.
I love the new comment system, but it doesn't seem to support my Firefox spell checking, which I have become shamefully dependent on.
Why is RCP 6 initially lower than RCP 4.5 (or even RCP 3)?
mandas@ 4
According to this paper:
My eyeballing of the two middle pathways tells me that they are basically the same up to about 2060. After that the world either wakes up (4.5) or decides to leave no coal unburned (6.0), at least until 2100. Based on Figure 2, it appears that both of these pathways may be a little optimistic in the short and medium term if you project our current emissions trends.
Agree with Andy @5 except 4.5 and 6 are roughly the same until 2040, not 2060.
Photon Wrangler - very well put. I wonder if this is all the fault of Climate science. In days of old you could be green and environmentally friendly just out of a desire to protect the environment and live in harmony with the earth. ( -snip- ).
What if there is a real problem that we can do something about?. What if its not CO2 but something we havnt figured into the equation yet? ( -snip- ). And unfortunately the climate is so complex that all our models are rough guesses, probably lacking important factors not yet discovered, and with so many degrees of variables that we can get them to produce any result we want - the denialists picking the low side, and the warmers the high side.
Thats not science, and as the argument rages the public lose interest in the squabble - and then nobody gives a fig leaf about the environment any more. What if this polarised debate is misleading the public into apathy???
Dana@6
I agree on the trends being the similar until ~2040 but the atmospheric concentrations/cumulative emissions cross around 2060 and start to diverge significantly after that.
Just an opportunity to parade one of my own pet irritants. Para 2 "This begs the question ... ".
To "beg the question" means assuming your conclusions to justify your premise. The original meaning was a question "begging to be answered" but ignored by the speaker or writer. Question-begging is a form of logical fallacy, related to a non-sequitur, where conclusions are unsupported by the premise.
http://www.nizkor.org/features/fallacies/begging-the-question.html
The meaning here is "That invites the question ..."
Rant over :)
One of my pet irritants is the insistance that a perfectly good word or phrase not be used for its obvious meaning because it is the name of something else. :-)
"Begging the question" is indeed the name of a local fallacy, however that turn of phrase is so colourful that it is just begging to be used in other contexts. :-) It obviously means "invites the question" in this context, but carries an ever stronger connotation in exactly the same way that begging someone to do something is stronger than simply inviting them to. In fact, if there is any criticism to be made, it's that this usage is so common that is has become cliché.
A suggestion of my own — would it be possible to make the underlining of glossary terms more subtle? At the moment I'm finding having so many words underlined somewhat distracting. One effect I quite like is a very pale solid grey line that becomes darker as the mouse moves over it.
MartinG,
I don't think your characterisation of the people here is very fair or accurate. "Frantically trawling new research for anything that supports our view"? "Picking the high side"?
I sometimes do mock my "opponents", but only after I have tried my best to correct the generally silly and quite obvious mistakes and misunderstandings, and they have responded by refusing to even try to understand why they are wrong and instead insist without evidence that the whole thing is a scam and places like SkS can't be trusted (or even looked at) because they "censor comments" or are biased or some other inanity that completely avoids addressing the actual issue that has been clearly spelled out for them.
As for "real problems that we can do something about", who said we shouldn't also address those problems, whatever they are?
This seems to be completely backwards. It suggests that we've observed a problem and gone searching for an explanation and as such we may have got it wrong. In fact the problem was predicted long before it was observed, and when it was observed the observations were what was expected from the predictions:
JasonB@11: Yes, but MartinB has a point about the polarized debate turning people off. And that I'd argue leads back to my comment @1 - people will need to truly experience the problem before real action begins. :-(
Three summers ago, the first year (of 2 in a row) that Pakistan lost most of its agricultural production to flood, Australia and Russia lost the bulk of theirs to drought. At 2C of warming -- the chart seems to say ---- that there would be localised threats and that "small holders" might have problems.
WTF? At .9C of warming we just had the simultaneous destruction of agriculture in Russia, Pakistan, and Australia. How localised is that? As for "small holders" I hope that doesn't mean "anyone other than the US and Canada."
MartinG:
In addition to JasonB's comments, I find some claims you have made in your post to be troubling. In particular, your sociological claims (including the first paragraph and the now-moderated last paragraph) both also appear to be contrary to the historical & contemporary evidence.
All well and good, but one has to wonder if it might be best to just give in and let the environment go to hell. I jest, of course, but honestly, today the BBC had a programme dealing with ice ages (In Our Time @ 09.00 on Radio 4, available on BBC iPlayer), which really made me want to scream.
It was all very interesting and personally, I learned a lot. Then in the last few minutes they discussed the role of CO2 in some depth. Just after it was pointed out just how far the current level of CO2 at 390 ppm is compared to the norm of 280 ppm, one of the guests, Richard Corfield. Research Fellow in Geology at the University of Oxford, said that he could see nothing wrong with 1000 ppm or more. His argument being that that would be normal for what they call Greenhouse Earth. Obviously he is completely oblivious of the enormous loss of life the sudden change we are experiencing is going to cause, or doesn’t care. Yes, we will have to adapt, but slowly over thousands of years should be no problem. The worrying thing is that this came from someone who, as a geologist, sees any changes that take less than a few thousand years as ‘instantaneous.’ Unfortunately, that was almost the last comment of the programme, so there was no time for the others to give a riposte. Oh hum.
MartinG:
Since your last paragraph has been reinstated, I should like to re-visit the assertion you made, that a "polarised debate is misleading the public into apathy".
Most recent examination of public opinion on the matter (e.g. here or here) suggests that public opinion in the US has been rebounding steadily. Perhaps other countries have had differing trends.
As far as I can see, unless you can show a consistent response in public opinion polling to the degree to which discussion/debate between environmental activists and/or science advocates vs self-styled skeptics is polarised or inflamed, I do not see how your claim is defensible.
When we talk about worst case scenarios, why do we not talk about the contribution of permafrost, methane hydrate release, forest depletion etc. It is as if since our models don't incorporate those contributions, they don't exist. Certainly, they will be major contributors to CO2 release and warming in the near time frame.
The true climate sensitivity value is of course very important to know. However we may be calculating a false low value if Gaia is "fighting" temperature rise, making it look as if the value is low. We may only know the true value following a couple of tipping points in which temperature rises much faster than the Climate sensitivity value would suggest. We may have the value pretty well right but temperature will rise in steps. The first such step may be in the near future when each year the Arctic ocean becomes ice free earlier and earlier in the summer. Over relatively few years, our met stations will record non linear increases in temperature but taken over a large time period, we will then have a pretty accurate estimate of climate sensitivity. Of course, one tipping point will likely trigger the next one. The second tipping point is likely to be from a vast increase in the release of methane.
Istoessl @17 - as noted in the post, I didn't account for changes to the carbon cycle. There's a simple explanation - it's hard to do. You have to estimate when these feedbacks will be triggered and how the associated emissions will change over time, etc. It's easier just to consider human-caused forcings, which present a rough enough scenario on their own.
ianw01,
If, for the sake of argument, we accept the premise that the polarising debate is turning people off, should not MartinG complain about the polarising debate at the sites that spread lies and misinformation rather than those that try to refute those lies and that misinformation by pointing out what the science actually says?
I would be a bizarre world indeed if those attempting to defend themselves from false accusations were to be accused of stirring up controversy rather than the ones actually making the false accusations, don't you think?
Ianw01, @1:
Keeping in mind that the elite and their propagandists will not disappear, and that lying is more flexible than telling the truth, I believe that the vested interests will simply switch over to "natural global warming" and the "nothing can be done" memes. Since denial is willful and not intellectual, this attitude will thwart any serious action.
In my opinion this civilization, which the elite are in control of, will have to collapse along with the elite before any meaningful action can take place.
Given the strongly vested interests in 'business as usual" I would expect fossil fuel emissions to follow RCP 8.5, the effects of which will make the recent recession a cake walk. But if there’s a silver lining to that, it is that the massive disruption to civilization will cause a significant decline in emissions, far more that we saw around 2009. Of course, by then it will be too late!
And why do people till quote 1m of sea level rise by 2100? No-one in the mid-nineties – well, no-one except perhaps James Hansen – thought that Arctic ice would decline so rapidly, but an ice free Arctic by 2016 is almost a certainty. And who’d like to wager that Greenland will be essentially ice free by 2035, given rise of a 6-7m sea level rise. No hard science here, just a reaction to the dramatic and (almost) entirely unexpected changes that have occurred over the last decade or so.
Phil, while the arctic summer sea ice decline has been a surprise to many, it doesn't follow that the massive land ice deposits in Greenland are under immediate threat (at least not on a decadal time scale). As important as it is to get the message out there that we have to do something, it's best we stick to the literature as much as possible when it comes to estimating the level of catastrophic events. Else the title of 'alarmist' will actually be deserved :)
Phil Morris - loss of the Greenland ice sheet by 2035 is an extremely improbable scenario. There are many genuine concerns, but that is not one of them.
Tristan, to the climate deniers, anyone who thinks climate change is real and/or induced by human activity is an alarmist. By their (our?) very nature, scientists are conservative but an issue of this magnitude requires worst case scenarios to be loudly articulated, otherwise the political will, driven as it is by public opinion, will never change.
Rob, loss of Greenland ice sheet by 2035 is an extremely improbably scenario, and therefore by implication, nonetheless possible, right?
Since none of the climate models take into account the methane release, nor did any of them suggest a summer free Arctic by 2016, we have no foundation whatsoever for using phrases like 'highly improbably' and 'not on the decadal time scale' when it comes to climate change. Human activity has opened a Pandora's box and despite the efforts of climate scientists, we simply do not understand the mechanisms involved sufficiently well to be certain that dramatic and catastrophic changes are NOT going to occur far more rapidly than models predict.
Is it better to be 'conservative' and suggest that worse case effects won't happen for decades yet – a timescale that allows most people to ignore the effects of climate change – or to sound the alarm bells of the possibility of ‘imminent’ disaster in order to get people to recognise that disaster can strike well within their lifetime? I’d rather sound the alarm bells and be wrong, than not do anything that causes me to branded alarmist and be right!
I don't think you understand quite how much energy it takes to melt 3 million km^3 of ice. Our understanding of climate science hasn't changed so abruptly that something estimated to melt on a milennial timescale will suddenly melt on a decadal one.
Yah, complete Greenland ice sheet loss by 2035, driven by GHG emissions, would require an uptick in GHGs so sudden and vast that such melting would be the least of our worries. I'm not sure it's even mathematically possible, esp. given the basin structure the ice is filling.
Agreed with DSL. Given the morphological structure of the GIS and underlying basement rocks, neither meltout nor dynamic calving and collapse will make any sizable dent in the bulk of the ice sheet by 2035. I doubt if even a 50% loss is even possible by 2535.
The WAIS, OTOH, is a far different stripe of ice...
For reference, here is the morphological structure of Greenland I referenced above:
[Source]
[More stuff like the above]
With regards to the best vs worst-case scenarios, I'm curious how they stack up against paleo evidence.
The danger limit agreed upon by policymakers is 2°C increase compared to pre-industrial times.
Basically, apart from the best-case emissions scenario combined with best-case sensitivity, we can look forward to a minimum 2° increase, pretty much no matter what, by the end of the century.
As far as I can see, a 2°C change in global mean temperature in approximately 250 years is almost without precedent in the period for which we have any remotely reliable paleoclimate data, that is, the past 550-600 million years.
The only episodes I can think of with climate changes that are comparably rapid are the end-Permian and end-Cretaceous periods. So even the change that is considered under the danger limit involves the climate changing at a rate that is only seen in entirely undesirable circumstances, at least as far as I can see.
But I'm a musician: anyone who knows this stuff care to comment?
Composer99 - the current rate of CO2 rise is unparalleled in the last 300 million years. See Honisch (2012). I've almost finished a post on Foster & Rohling (2013), but based on their research, global warming and consequent sea level rise will persist for many centuries. With atmospheric CO2 levels between 300-400 ppm (parts per million) sea level in the last 40 million years typically reached around 24 metres (+7/-15) higher than today. With CO2 now over 390ppm long-term sea level rise from greenhouse gases already emitted is going to be substantial.
If the low climate sensitivity people are right, it implies extraordinary sensitivity of global land-based ice to small amounts of warming. I doubt they are right, but the basis for this is too lengthy to fit into a comment. Even keeping under the 2°C limit effectively dooms the coral reefs. A collapse of that ecosystem is going to have profound effects on the hundreds of millions of people whom depend on the reefs for protein. This will have significant repercussions for all humanity, especially so when industrial fishing methods are simultaneously emptying the oceans of fish. The future is going to very different to how many people imagine it will be. And not in a good way.
Just to follow up on the comments about what should perhaps be called the Charney or fast feedback climate sensitivity (which I believe Dana is using in this excellent article) vs. the full 'Earth system sensitivity', Hansen derives the following from palaeoclimate studies:
Fast feedback climate sensitivity is 0.75 ± 0.125°C/W/m² (3°C per doubling)
Climate sensitivity including slow albedo feedback is 1.5°C/W/m² (6°C per doubling)
Climate sensitivity including slow albedo feedback & non-CO2 GHGs is 2°C/W/m² (8°C per doubling)
Climate sensitivity including all feedbacks between Holocene & ice-free state is ~2.4°C/W/m² (9.5°C per doubling).
Hansen & Sato 2011
The full feedbacks would take hundreds (thousands?) of years to be fully realised but studies find that we're going to see them already making a substantial impact within this century. Just using the fast feedback climate sensitivity is understating the scale of the problem, I think. If the timescales of longer term feedbacks are uncertain, that's all the more reason to make sure they're not forgotten in our eagerness to quantify the scale and timing of global warming. Not a criticism of this article at all, just an observation.
Icarus @34 - yes, when I say equilibrium sensitivity, I refer to Charney fast-feedback sensitivity. If you look at longer timescales, the picture is bleaker. However, you never know what's going to happen in the future. If we keep climate change in the manageable range this century, maybe we'll eventually be able to come up with a viable technology to extract and sequester CO2 from the atmosphere, in which case the longer timescale feedbacks could be avoided. It's hard enough to project what's going to happen in the next century, so I tend to not try to go much beyond that.
Composer @32 - 2°C above pre-industrial would put us outside the range of climate variation over the past million years or so, at least. That's another good reason to try really hard not to pass that threshold.
Icararus @34, the most appropriate climate sensitivity value to use is a complex issue, and depends both on time scale and the draw down rate of CO2. As has repeatedly been shown by David Archer and other scientists, the initial increase of CO2 conentration due to increased emissions will largely be absorbed by the ocean on a time scale of 100-300 years. After that draw down, approximately 20-30% of the initial CO2 increase will remain in the atmosphere, and will remain for a very long time (> 10,000 years). There are two important points from this.
First, for up to a hundred years after the increase in emissions, the most relevant climate response is the Transient Climate Response. If we increase CO2 concentration to about 1000 ppmv by the end of this century, we will experience the transient response to that, or about 3.65 C
As time progresses, the surface will tend to the equilibrium response, but over the same time period the CO2 concentration will fall rapidly on about the same time scale. What will be experienced in a hundred years or so, assuming we effectively cease emissions before then, will be (approx) the equilibrium response to a quarter of the peak CO2 concentration. For our 1000 ppmv scenario, we will experience the equilibrium responce to an increase of 460 ppmv (ie, preindustrial plus one quarter of the increase above preindustrial), or just over 2 degrees C.
As further time progresses, the full Earth System responce to the smaller long term increase will be experience, ie, something in the order of 3.55 C. Unfortunately the temperature increase of that magnitude will be with us for a period at least equivalent to the entire history of human civilization todate.
This scenario is no panacea. There is much devil in the detail. For example, should the time to the equilibrium response be shorter, we can expect a large temperature peak before the temperature declines with the initial decline in CO2 concentration. If a high proportion of initial emissions are in the form of Methane, there will also be a large initial spike in temperature prior to the Methane decomposing into CO2 and water vapour. Further, this scenario assumes a near total cessation of CO2 emissions, something that is not guarentted given that about 20% of emissions come from agriculture, and that there may be significant additional emissions in the form of feedbacks.
If you are interested, I have a spreadsheet showing indicative short and long term responses to various estimates of fossil fuel availability.
Pardon me, but is there some reason for one axis of figures 4, 5 and 6 to be labeled "Global Surface Warming since 1750" and the other axis starting in 1900?
Old Mole @37, the graphs show the difference in global mean surface temperature (GMST) from that estimated for 1750 for each year from 1900 onward. That is, each point ploted shows for a given year, the GMST for that year minus the GMST for 1750; but showing that does not say anything about the range of the x-axis.
Old Mole @37 - the RCP scenarios begin in 1750 (often defined as "pre-industrial"), but there wasn't much use in showing the 1750–1900 timeframe, since humans had little temperature influence prior to 1900.
Here are a couple of interesting links to the conditions during the Eemian, after the penultimate ice age glacial minimum, I think?
http://www.sciencedaily.com/releases/2013/01/130123133428.htm
also
http://cordis.europa.eu/fetch?CALLER=EN_NEWS&ACTION=D&RCN=34734
Peer reviewed results show that during the Eemian the temperatures attained were higher than now, and the Greenland melting, though serious, was less than one would expect for those temperatures under today's conditions. (Perhaps the nature of oceanic circulation was different?)
Should I take these results as encouraging some optimism?
curiousd - "Should I take these results as encouraging some optimism?"
Given that Eemian conditions included temperatures ~3°C higher than todays (in range for a 3-4°C rise if we don't change our emission practices), No, that's not encouraging.
A few papers have recently suggested that Greenland apparently did not melt as much as previously thought during the Eemian. Which indicates that Antarctica, the other major store of ice, may be more vulnerable to temperatures than we thought - that portions of the West Antarctic ice sheet (and perhaps part of East Antarctica) melted during that period - otherwise the 5-7 meter sea level rise seen during the Eemian couldn't have occurred.
Whatever the source, 5-7 meters of sea level rise is still going to have a huge impact.
Is the doubling of CO2 under discussion here
(a) a doubling of current CO2 concentrations?
(b) a doubling of atmospheric CO2 relative to the pre-industrialization levels?
(c) other?
This (above) is my main reason for commenting, but if anyone wants to address the following comments as well, that'd be fine.
The IPCC recently came out with a proposed "carbon budget" which amounts, more or less, to allowing for a near doubling of current CO2 emissions since the beginning of the industrial age.
For what it is worth, the IPCC carbon budget strikes me as quite optimistic, given that the Arctic sea ice nearly disappeared in summer recently and is expected to do so within a few years. Combine this with the many positive feedback mechanisms which would likely occur as a result of this dramatic shift in the Arctic, and it appears our budget is probably already about consumed.
[JH] This comment thread is an appropriate venue for a discussion of your (a) and (b).
JamesRMarten @42:
1) If you are talking about the seciton of the original post which states, "The case for a most likely equilibrium climate sensitivity of around 2.5°C average surface warming in response to a doubling of CO2, as opposed to 3°C, is not yet very compelling, but it is certainly a possibility", then it does not matter. The temperature response for a doubling of CO2 is approximately the same whether we double from 280 to 560 ppmv (your case (a)) or from 393 to 786 ppmv (ie, from 2012 levels, or the equivalent of you (b)), or any other doubling in the range from 100 to several thousand ppmv. However, at extremely low levels or high levels of CO2, the approximately equivalent response to any doubling of CO2 will break down.
2) The IPCC AR5 WG1 Technical Summary states:
An increase of 1,000 Petagrams (or I,000 billion tonnes) of carbon (or 3,700 billion tonnes of CO2) is equivalent to 470 ppmv of CO2 in the atmosphere. However, only 55% of emissions actually enter the atmosphere, the rest being absorbed by the ocean and the biosphere. That leaves only 260 ppmv accumulating in the atmosphere. So yes, that does amount to the near doubling of CO2 over preindustrial levels.
The IPCC position is consistent, however with what is stated above. That is because they are looking at the TCRE, the Transient Climate Response to cumulative Emissions, whereas the above article is looking at the Equilibrium Climate Sensitivity (ECS). With a crucial caveate, it is the Transient Climate Response that is more important. That is because the time scale for temperatures to rise from the level of the Transient Climate Response to the Equilibrium Climate Response is approximately the same as the time scale for the initial slug of CO2 emitted to the atmosphere to be drawn down by equilibriating with the deep ocean. The result is that the Transient Climate Response approximates to the full temperature response over the coming centuries, and indeed, the coming millenia (as the slower draw down be chemical weathering occures on time scales comparable to the Earth System Climate Response.) I have a spreadsheet showing the approximate expected temperature response to various estimates of the available fossil fuel base at different time scales here.
The crucial caveat is that temperatures will only plateau at or near the transient climate response if there are no further net emissions. Further emissions will result in a continued slow rise in CO2 concentration, and emissions equivalent to 10-20% of peak emissions (depending on when they occur) will result in a rise sufficient that we will face the full Equilibrium Climate Response, ie, about 50% greater than the transient climate response. As it is impossible to avoid all emissions, policies based on a Transient Climate Response target commit future generations to deliberate, artificial carbon sequestration at some level.
There is a further caveat that the rate of draw down and the rate of temperature equilibriation are not certain. In particular Hansen thinks temperatures will equilibriate much faster than is generally believed, which again will result in a temperature spike significantly greater than the Transient Climate Response. His, however, is not the consensus opinion. Therefore, other than noting its existence I believe policy makers should adopt the IPCC figures for establishing current policy settings, and fine tune policy later as we gain more information.
PhilMorris #25, Tristan #26. Yep, the numbers are vital because they separate this sensible debate from the barrage of irrelevancies by some "skeptical" types. 900 ZettaJoules to melt 3 million km^3 of ice on Greenland. It's, what, ~300 ZJ added over the last many decades (25 ZJ in 2013) but of course hardly any of it will get to the Greenland ice. So it's a slower process than a few decades but it will be accelerating for sure. 5,600 ZettaJoules to heat oceans 1 Celsius but then they only heated 3.5C during the entire 10,000 year warm up from the "ice age". It's my understanding that Greenland ice would not slide into the ocean, so it requires air-warming or rain-warming, but some large West Antarctic glaciers might do that if their sea ice buttresses get eaten away. PhilMorris might want to review those aspects if time permits. Longer than a few decades I would think.
Dear SkepSci,
I'd like to see some material on actual scenarios, rather than long-term temp trend; a little more Ec and PolSci? More qual less quant.
We've seen drought ignite political instabilities and storms shut down grids and flood cities owing to infrastructure vulnerabilities. The real "worst case scenario" is that well before we hit +1.5-2°C extreme weather hits the worst places at the worst time, politically or economically.
For example, what if a major flood hit the Pearl River Delta displacing 20m pp, crippling 1/4 of China's manufacturing, and triggering a US bond sell-off - combined with recent QE - that collapses the already fragile global banking sector ?
Or, at what point do declines in Himalayan meltwater (cutting inflows to the largest rivers in Asia) escalate the India/Pakistan water conflict to a nuclear engagement?
Where is the worst place now to have another 1-in-500 year drought like the one that crippled Syria?
Where is the next Fukishima? Is it Kudankulam? Turkey Point? Plymouth?
Identifiying vulnerable infrastructure, economies, and political climates would (a) help focus people's attention a little better than "+1.5 vs +2 vs +5" and (b) help allocate resources based on risk?
There are loads of papers around on the above topics. Thoughts?
[PS] While I can in no way speak for John Cook and other authors on this site, I would note that mission of this site is to address climate myths with published science. There are other sites (eg climatesciencewatch or thinkprogress) with more interest in the Polsci or Ec issues.
Excellent analysis. The thing that troubles me most about scientists' predictions is that there is ONE variable crucial to which scenario turns out to be the real one that the scientists always get wrong: the political one.... they assume that AT SOME POINT in the next 60 years, we WILL decide to go all out to stop global warming. Thus the scientists factor in a point at which emissions start to decline.
I believe that they make a big mistake in doing that. I think it's likely that the strangle hold the energy polluters have on the American government, and the minds of manhy of the superstitious American people mean that the USA will as a nation prevent any meaningful action being taken to stop global warming until AFTER the most catastrophic consequences of global warming have struck the USA. Around 2065, with Miami going under water, Texas turning into the new Sahara, carbon dioxide at 750 to 1000 ppm, and the future already irretrievably lost, THEN the American people and government will graciously consent to let the rest of humanity begin a futile effort to try to survive.
It has now been 7 years since this article was published and so we have some more data available with which we can review the most likely scenarios.
Global CO2 emissions and atmospheric CO2 levels seem to me to suggest, at best, a RPC 4.5 trajectory. Have I misinterpreted the latest data or do others also think that things really are that bad?