


 Arguments


Recent Comments
Prev 784 785 786 787 788 789 790 791 792 793 794 795 796 797 798 799 Next
Comments 39551 to 39600:
-
Rob Honeycutt at 15:16 PM on 4 January 2014Medieval Warm Period was warmer
aristotelian... Three of the four references you provided are well known AGW denial sites. I've spent a large amount of time going through the MWP material shown on CO2 Science, in particular. Many of their written synoses of the research actually contradict the actual research they present. And they, curiously, do not (though they are clearly capable) endeavor to sythesize the data into any kind of multiproxy reconstruction.
The other thing you'll notice at CO2 Science is that, what they call the MWP does not occur at the same time in all the datasets. And this is clearly pointed out in most of the research, but CO2 Science goes to great lengths to hide this fact.
When you read the actual research papers what you find is that the MWP was "heterogeneous." That is, it's not homogenous. It occurs at different times, at different places. And it doesn't occur at all in still other places.
When people go to such lengths, as CO2 Science does, to hide this elemental fact, then yes, I call those denial websites.
-
michael sweet at 13:35 PM on 4 January 2014Medieval Warm Period was warmer
Aristolean,
This Skeptical Science article describes an article written by 78 climate researchers who combined data from around the world to make a graph of the temperature for the last 2000 years. The MWP does not show up in analysis that combine all the world data. The MWP was evident in some areas, but other areas were colder at the same time so the global temperature was not warmer. By contrast, in the current warming everywhere is warmer. It is possible to find warm areas somewhere in the World at almost any time in the past you choose, they are just balanced by other cold areas. Do you believe a careful analysis by 78 scientists or a blog post on WUWT? (note this confirms Mann's Hockey stick data, again)
In general, WUWT leaves out most of the data. You can make anything appear to be true if you leave out enough data. The IPCC report does not leave out any data and they find no MWP.
-
aristotelian at 12:47 PM on 4 January 2014Medieval Warm Period was warmer
Thanks, Tom. That makes more senese.
-
Tom Dayton at 12:38 PM on 4 January 2014Medieval Warm Period was warmer
aristotelian, you misinterpreted Rob's reply. When he wrote "where no MWP shows up at all" he did not mean absence of evidence of the temperature. He meant there is solid evidence of the temperature, and that temperature was not anomalously warm. That is existence of evidence, not absence of evidence. Click the Intermediate tab at the top of the original post on this page, to see more evidence.
-
aristotelian at 12:25 PM on 4 January 2014Medieval Warm Period was warmer
Also, one of these links is a video of a NYT reporter interview scientists. As a layman, who am I more likely to believe, some random website I found the immiediatly lables someone "a denier" which is a clear reference to the holocost deniers so is a gross ad hominin attack or some scientists interviewed by the NYT?
Moderator Response:[TD] Nearly every claim on Skeptical Science is backed up with references to, and often links to, scientifically peer reviewed publications. Those are even more reliable than interviews with scientists, because some scientists make claims in interviews, editorial writings, and web sites that they are unable to make in peer reviewed publications, due to the strict quality controls over peer reviewed publications.
-
aristotelian at 12:23 PM on 4 January 2014Medieval Warm Period was warmer
re: "aristotelian... Making the rounds at all the climate denial sites, I see.
What WUWT, CO2Science and Science&PublicPolicy are not going to tell you is that there are many places where no MWP shows up at all. Such as, the Tibetan Plateau."
Where talking about 1000 and 2000 (Roman Warm Period) years ago. I don't see how the absence of evidence is evidence of absence in this case.
-
Rob Honeycutt at 12:17 PM on 4 January 2014Medieval Warm Period was warmer
aristotelian... Making the rounds at all the climate denial sites, I see.
What WUWT, CO2Science and Science&PublicPolicy are not going to tell you is that there are many places where no MWP shows up at all. Such as, the Tibetan Plateau.
-
aristotelian at 12:03 PM on 4 January 2014Medieval Warm Period was warmer
What about these studies using senentments ect indicating the MWP was global?
http://wattsupwiththat.com/2013/10/31/new-paper-shows-medieval-warm-period-was-global-in-scope/ Shows a NYT reporter intervieweing 2 scientist who measured sentiment samples around Indonesia. Look at 11:15
http://www.sciencemag.org/content/342/6158/617
MWP in China http://www.co2science.org/subject/m/summaries/mwpchina.php
http://scienceandpublicpolicy.org/images/stories/papers/originals/mwp_asian_countries.pdf
-
Doug Hutcheson at 10:31 AM on 4 January 20142013 SkS Weekly News Roundup #52
One Planet Only Forever @ 11, you said:
"the best solution would be for humans to strive to minimize the impacts of their lifestyles"
The problem is our species' dependence upon energies greater than can be generated by muscle power, wind, sunlight and burning renewable organics. The only solution to that is for us all - globally - to reduce our expectations/desires/demands of life and that is what is impossible, for all practical purposes. We have had it too easy for too long and our profligacy is now coming home to roost.
-
Kevin C at 08:43 AM on 4 January 2014Hockey sticks to huge methane burps: Five papers that shaped climate science in 2013
Well, Cowtan and Way will also be listed as 2014 when it hits the print edition.
While the attention is very flattering, in scientific terms our paper is really only addressing a technical data analysis issue. If climate change skeptics had not managed to inflate the short term trend into the "most pressing" issue in climate science (according to BBC Newsnight) then it would not have attracted much interest. That's not to say that it didn't need doing, but as the Stoat said, "anyone could have done it".
In my view the real scientific breakthrough missing from this list is Kosaka and Xie.
-
michael sweet at 08:31 AM on 4 January 2014Hockey sticks to huge methane burps: Five papers that shaped climate science in 2013
Chriskoz,
While the paper you linked is very interesting, the original article in Nature is dated January 2. If the results hold up it might be one of the five top articles for 2014.
-
Synapsid at 08:12 AM on 4 January 2014Methane emissions from oil & gas development
Dallas showed high CH4 emissions. How much is known about emissions from natural-gas transmission and distribution networks in and between US cities and towns, and from such networks in industrial areas outside them--well, from transmission and distribution networks in the US? I've often wondered how these emissions compare to those associated with the fossil-fuel industries.
There are lots of old and poorly maintained gas lines; the San Bruno explosion south of San Francisco some years back underlined that.
-
Stephen Ferguson at 08:09 AM on 4 January 2014Methane emissions from oil & gas development
@gws, Do you concur with Joe Romm that the EPA are significantly understimating the global-warming potential of methane compared to the latest IPCC figure of 34 over a 100-year time scale?
"Amazingly, the EPA has been using a GWP of 21 for its estimate of how methane compares to carbon dioxide — a figure that is nearly twenty years out of date. That means methane is a whopping 60% stronger than EPA calculates in its GHG inventory. Back in April, EPA finally said it was thinking about raising the GWP — to 25!"Ref. http://thinkprogress.org/climate/2013/10/02/2708911/fracking-ipcc-methane/
-
chriskoz at 07:24 AM on 4 January 2014Hockey sticks to huge methane burps: Five papers that shaped climate science in 2013
The author has missed the latesat paper by Steven Sherwood from NSW uni, quantifying the cloud formation changes from H2O forcing:
Planet likely to warm by 4C by 2100, scientists warn
Several SkS commenters quoted that paper lately.
That late 2013 paper, has not "shaped climate science" yet, but it certainly will. It should put to bed the Lindzen's "negative cloud feadback". Then, I predict, it will cause IPCC to revise upwards their ECS.
-
rocketman at 06:55 AM on 4 January 2014Hockey sticks to huge methane burps: Five papers that shaped climate science in 2013
"Skeptics" don't cite a lot of papers.
As for these being the top 5, I would say that 1, 2 and 5 are well chosen. 3 and 4 were more media sensations than major contributions to climatology.
-
PluviAL at 06:39 AM on 4 January 2014Methane emissions from oil & gas development
Wili, I concur. My work is application oriented. I count on detail-oriented folks to keep the data and conclusion good, but the real world measurements seem more reliable to me than the menutia of inventory procedures. They have already been proven to be wrong, and it seems, manipulated by the industry. Real measurements by sampling seem much more reliable, but discounted in the article. In my book, I simply report EPA has been underestimating CH4 emissions measurements. Excellent work, though, Thanks.
-
scaddenp at 06:16 AM on 4 January 2014Hockey sticks to huge methane burps: Five papers that shaped climate science in 2013
Really? And which peer-reviewed papers would these be that tell an entirely different story?
-
gws at 05:01 AM on 4 January 2014Methane emissions from oil & gas development
deweaver, the atmosphere is not interested in which sources emit the methane, and the NOAA studies are not designed to study just oil&gas exploration emissions. However, they are still useful, and trustworthy, despite their integration over several possible sources, because the major non-oil&gas exploration sources (such as landfills and cow population) can be assessed independently, and then subtracted from the total. In addition, several tracers are used to distinguish between sources, such as co-emitted ethane and 13C-CH4.
Natural seepage cannot be easily distinguished from explorative sources, but while possibly large locally, the continental or global source is uncertain at best. There is, at this point, mostly speculation of how much it might contribute realtive to natural gas production. Dedicated measurements and careful extrapolation are needed.
Ruminants are a large anthropogenic source, approx. three to four times larger (75-95 Tg/yr) than the extrapolated termite source (20-30 Tg/yr), which has been investigated several decades ago. Your last statement is an interesting speculation, inferring that termite numbers would increase dramatically if you removed cattle production from a tropical area. Have any evidence for that?
-
OPatrick at 04:45 AM on 4 January 2014Hockey sticks to huge methane burps: Five papers that shaped climate science in 2013
Whilst these were all significant and interesting papers it seems a stretch to say that they were the five papers that 'shaped climate science' last year. I can imagine certain 'sceptics' selecting their own set of five papers to tell an entirely different story.
-
Tom Curtis at 04:43 AM on 4 January 2014It's waste heat
Old Sage @153:
1) "...the earth is a spheroid which will see its surface temperature vary by 1 deg K (around 300 say) for every 1.35% change in solar energy..."
A 1.35% alteration in the solar constant represents a 3.23 W/m^2 change in TOA forcing. That means OS is assuming a no net feedback climate sensitivity, ie, a climate sensitivity equivalent to 1.15 C per doubling of CO2. That figure disagrees with nearly all studies of the subject, and is almost certainly inconsistent with the past history of the Earth's temperature variation, as is shown by the IPCC AR5:

2) "...the difference between a cloud base at the bottom of the troposphere and top, ten miles, corresponds to a 0.5% change in the effective radiating surface area..."
The actual difference in area between sea level, and 10 km above sea level is 0.31%. That is not a 0.5% change in the effective radiative surface as the effective altitude of radiation to space is already approximately 5 km of altitude, meaning shifting the effective radiation to space to 10 km would only increase the effective radiation surface by 0.16%.
3) "It means that should the temperature rise by 1/3rd degree, it could be eliminated by increased radiation from elevated cloud cover."
This assumes 100% cloud cover. It also assumes the increased effective area of the clouds will have no effect on albedo. These, however, are trivial flaws by OS's standards. The beggest flaw is that he ignores the fact that the atmosphere cools with increased altitude. As IR radiation to space is proportional to the fourth power of temperature, that means increasing the altitude of effective radiation to space reduces the radiation to space (which is the essence of the greenhouse effect). Assuming a reduction in temperature of 6.5 K per kilometer of altitude, and an average surface temperature of 288 K, and allowing for the change in surface area, increasing the effective altitude of radiation to space from 0 to 10 km would reduce radiation to space by 64%. The reduction from increasing the current effective altitude of radiation to space to 10 km is reduces the radiation to space by 32%. This would require a substantial increase in the Earth's surface temperature to compensate (significantly greater than 10 C). (It should be noted that these figures are calculated using OS's black body assumption of all radiation coming from just one level, which is false. Using a realistic model the reduction in IR radiation, and hence the compensating temperaure increase prior to feedbacks would be less.)
4) "... it is a scientific fact that the major energy transfer agent from the surface is kinetic by gases."
In fact, within the troposphere the dominant form of energy transfer between atmospheric layers is by convection (ie, kinetic by gases). Contrary to KR, Trenberth adresses the different issue of transfer of heat between the Earth's surface (ie, dirt and rock, or water) and the atmosphere. So OS is correct on this one, but while correct he is irrelevant. The only form of energy transfer from the surface or atmosphere to space is by IR radiation (ignoring a very small amount of energy carried of by hydrogen and helium escaping to space). The kinetic transfer of energy in the atmosphere establishes a very clear gradient in temperature, which limits the IR radiation to space as the effective level of radiation to space is forced higher in the atmosphere by greenhouse gases.
5) "The physical mechanism for raising the emitting surface is that as water is the pervasive surface on earth ..."
As a side note, we see here that OS assumes the WV feedback rases the effective level of radiation to space, with together with the declining temperature with altitude makes it a strongly positive feedback. He is, of course, unaware of the implications because his grasp of the physics is so poor.
More importantly, water vapour is IR active. That is, it absorbs IR radiation in part of the spectrum in proportion to its emissivity, and emits in the same part of the spectrum in proportion to its emissivity, and as a function that increases with increasing temperature. Thus implicit in OS's argument is the fact that increasing the concentration of any IR actively gas (eg, CO2) in the atmosphere will increase temperature.
6) "As CO2 is 2.5 times heavier than H2O, I doubt that there is a significant CO2 effect trapping heat above the topmost cloud cover."
OS "doubts", but in the mean time observations* show the following:
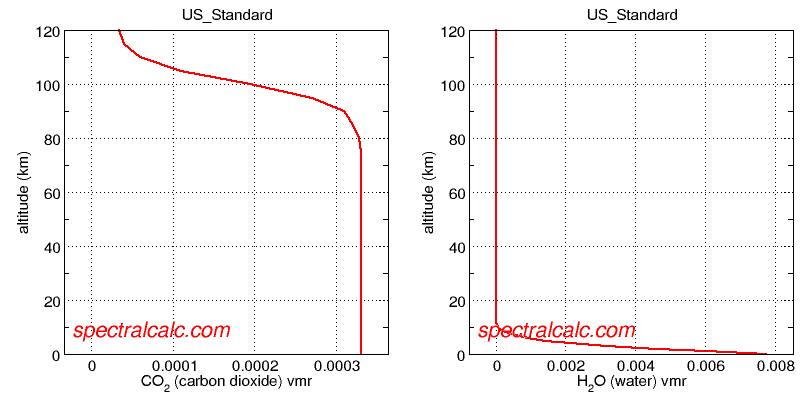
Note that while water vapour declines in concentration rapidly, being almost completely absent above 10 km in the atmosphere, CO2 remains near constant in the atmosphere up to 80 km in altitude. The decline in water vapour concentration is because it precipitates out of the increasingly cold atmosphere. Even in the tropics, atmospheric temperatures fall below freezing around 5 km of altitude, so that apart from in thunderstorms, water vapour is largely absent above that altitude.
Even better, we can see which has the most effect on IR radiation to space, as it has been observed from space:
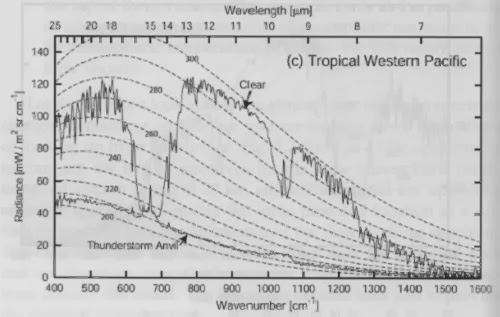
The black body curves show the average temperature of gas radiating at that level. As can be seen in the clear sky example, water vapour (to the left of the large notch at 650 cm^-1) has a brightness temperature in this example, of about 260-270 K, indicating its effective altitude of radiation is 4.6 km. The large notch, however, is due to CO2. Its brightness temperature is around 225 K, indicating an effective altitude of radiation of 11 km. The spike in the center of the trough is because where CO2 most effectively absorbs, its effective altitude of radiation is in the lower stratosphere, which is warmer than the upper troposphere.
Of course, you cannot fail to have noted the spectrum for the thunderstorm anvil, with a brightness temperature of 210 K, and hence an approximate altitude of 13 km. High altitude clouds are amazingly effective greenhouse agents, but only high altitude clouds can get above the warming effect of CO2; and they occupy only a small proportion of the Earth's surface.
These two observed spectrums (and countless others like them) show clearly, and by observational data, that OS's doubts exist only from failure to look at the evidence.
(*The graphs are for the US Standard Atmosphere which is a standard specification of average US atmospheric conditions, primarilly used in aviation. It is based on very detailed observations, but only approximates to those observations.)
7) "The upshot is that waste heat involves ..."
OS continues his evidence free ramblings. The facts are that waste heat is dissipated very rapidly to the rest of the Earth's surface by winds. For small wheather effects, that dissipation may not be fast enough so that it has some effect. For climate, however, the dissipation is sufficiently rapid that the feedbacks for waste heat occure at the same pace and geographic scale as the feedbacks from increased CO2 concentration. Therefore there effective impact on the Earth's climate is given to a first approximation by the scale of their globally averaged output. That is, waste heat has one hundredth of the impact of increased CO2.
In summary, OS demonstrates yet again that he has no clue about the basic physics involved in climate change, and a very poor, and in most areas, non-existent grasp of the relevant observational evidence. He never-the-less is "sage" enough to think he knows better than scientists who spend their life studying the subject, and have gone over the observations and basic physical principles with a fine tooth comb. His "sagacity" is, therefore, the sagacity of the witch-doctor rather than the scientist.
-
deweaver at 04:18 AM on 4 January 2014Methane emissions from oil & gas development
Living in an oil/gas area of the country and spending an early part of my life dealing with natural seepage problems, the topdown NASA approach may be very misleading. We have houses and buildings in the local area where the natural emissions are so high that we intalled permanent tiki torches, membranes and collection systems (some passive and some with active pumping) to prevent explosive levels in the buildings. These tiki torches are still burning after 40 years.
A few of the larger natural sources are now going into generators for small scale power generation.
In the LA basin, there is a strong relationship between locations of natural gas seeps and locations that became large oil producing areas, but the natural seeps existed before the oil/gas wells. Some of the largest natural seeps are within 1 km of active wells and the existance of natural seeps of both oil and gas were used to locate good drilling sites, both on shore and offshore, before 4-D seismic studies.
How can natural seeps and oil filed induced leaks be separated in a low resolution study? Why should we give credability to the low resolution NASA type study? If they had no data before the oil field development, they have no real information beyond political PR.
Articles that discusses methane discusse cattle and ruminants but never seems to mention termites, which utilize the same microbiology as rumiminates with methanogenic bacteria to eliminate excess hydrogen from fermentation of carbohydrates. In tropical areas full of termites, the cellose that would not be eaten were the numbers of cows to be reduced would be consumed by the termites, so the net production of methane would not be diminished by diminishing cattle production.
Moderator Response:[JH] Unnecessay white space eliminated.
-
gws at 02:35 AM on 4 January 2014Methane emissions from oil & gas development
Miguelito, continued hammering on the Petron et al. pilot study looks like a strawman at this point. As this post is trying to highlight, science has progressed much beyond that study. The Levi papers were included in our earlier post. His points are well taken, but I linked to the more detailed ClimateCentral study in this post.
-
gws at 02:25 AM on 4 January 2014Methane emissions from oil & gas development
Russ, your argument on the projections is a non sequitur. Of course the science community corrected the projections over time because science progresses; we learn, we do better. That said, the global inventory (remember: it is only an educated guess) likely still overestimates methane emissions, mostly due to assumptions of (too?) high emission rates from coal mining in east Asia.
There is evidence from measurements and modeling (see the van Amstel review I linked, or Katzenstein et al., PNAS 2003, for a regional persepective) that North American (NA) methane emissions have generally been underestimated in the past. It is, however, speculation to link global atmospheric abundance to what happens in NA. As included in our post last year (linked above), global ethane abundance has dropped, suggesting that global fossil fuel related methane emissions may have dropped, especially in the former Sowiet Union in the 90ies. That likely contributed to the methane mixing ratio plateau. In general though, the plateau is driven simply by an approach to steady state due to a near contant global methane emission rate (550 +- 50 Tg/yr) between the mid 80s and mid 2000s.
Is the renewed increase linked to what happens (fracking?) in NA? Again, likely not. The methane abundance pattern, see here, is generally driven by the largest natural source, wetlands, especially in the tropics. I encourage you to watch Ed Dlugokencky's talk at AGU, session U33A-04. The midlatitude contribution is thought to be related to anthropogenic sources increasing, such as in East Asia, but the coarse resolution of the global data is not helping in pinpointing sources (see e.g. Bergamaschi et al., 2013, in JGR-Atmospheres).
-
It's waste heat
old sage - I will also note that you are recycling much of the same nonsense you put forth earlier in the thread (here and subsequent discussion). Said assertions on your part were nonsense, and eventually moderated/snipped as sloganeering.
You do not appear to have added any actual content to your arguments at the current time.
-
Dikran Marsupial at 01:40 AM on 4 January 2014It's waste heat
Old Sage, you still appear to be labouring under a misapprehension over the basic operation of the greenhouse effect, that I pointed out to you earlier in the thread here.
You write "As CO2 is 2.5 times heavier than H2O, I doubt that there is a significant CO2 effect trapping heat above the topmost cloud cover."
The greenhouse effect depends on the temperature of the radiating layer in the atmosphere where outbound IR is not absorbed by CO2 (or H2O).
Note also that the atmosphere gets colder with height, which means that the atmosphere also gets drier with increasing altitude because the water vapour precipitates out.
"I remain a sceptic over the overarching significance of CO2 when set against that of H2O."
Well perhaps you should have read the realclimate article that I mentioned in my previous reply to your earlier comments.
-
It's waste heat
old sage - There are more errors in your posting than are worth the time to point out. I'll simply list a couple of them.
"Despite argument to the contrary, it is a scientific fact that the major energy transfer agent from the surface is kinetic by gases." False. See for example the Trenberth 2009 energy budgets, which note that ~97 W/m2 transfer from surface to atmosphere via evaporation and thermals, while ~396 W/m2 by IR, or a 4:1 ratio. Your assertion is not even close to reality.
"As CO2 is 2.5 times heavier than H2O, I doubt that there is a significant CO2 effect trapping heat above the topmost cloud cover." Again, False. CO2 is a well-mixed gas, present throughout the atmosphere. And in fact it's primary effect as a GHG occurs above where water vapor does. If your statement were correct, valleys would be uninhabitable due to CO2 levels, which is clearly _not_ the case.
Your post consists of pseudoscientific Woo - I would suggest doing some reading. The Discovery of Global Warming by Spencer Weart would be an excellent starting point.
-
old sage at 00:53 AM on 4 January 2014It's waste heat
I have speculated about a number of ways in which the earth can dissipate energy apart from i/r emissions and no doubt they play a part - especially if things get violent. However the relative importance of waste heat is coming up the conscience scale as models are now beginning to refer to 'urban hotspots'.
I think the following argument will show why waste heat is more important than the simplistic arguments which seek to dismiss it.
You have to return to the fundamental physical - not organic -phenomena which makes the earth's response to variations in incident energy so robust.
From afar, the earth is a spheroid which will see its surface temperature vary by 1 deg K (around 300 say) for every 1.35% change in solar energy - whether by orbit or output. So that degree of stability is pretty assured.
Next, the difference between a cloud base at the bottom of the troposphere and top, ten miles, corresponds to a 0.5% change in the effective radiating surface area. It means that should the temperature rise by 1/3rd degree, it could be eliminated by increased radiation from elevated cloud cover.
Despite argument to the contrary, it is a scientific fact that the major energy transfer agent from the surface is kinetic by gases.
The physical mechanism for raising the emitting surface is that as water is the pervasive surface on earth, any general heating increases the water vapour content. Being lighter than all other gases (except Helium) it takes latent heat and acquired kinetic energy up to a point where it condenses into droplets. These radiate extremely efficiently so that a cloud effectively becomes the conversion mechanism for kinetic to radiant discharge.
The effective radiating surface is not just the radius effect. Each droplet radiates isotropically so do all those droplets within five characteristic absorption lengths of the surface adding to the output. The surface also is lumpy with towering pillars of cloud. The mechanism deserves fuller treatment than I can cover here to show outbound exceeds downward but the net effect is to provide a temperature dependent height for a surface from which earth radiates.
As CO2 is 2.5 times heavier than H2O, I doubt that there is a significant CO2 effect trapping heat above the topmost cloud cover. I remain a sceptic over the overarching significance of CO2 when set against that of H2O.
The upshot is that waste heat involves a huge lag between its generation and the increase of H2O as required for temperature stability whereas all natural changes are immediate because the oceans are bathed by it. Waste heat is generated in concentrated areas over land and is different from the patterns which produce the jet stream and trade winds. That may have a greater impact on climate phenomena than anything. A mouse can upset a see saw balanced by two elephants.
Of one thing I am sure, waste heat is not ignorable.
Moderator Response:[JH] Unneccesary white space eliminated.
-
minglewood at 22:48 PM on 3 January 2014Methane emissions from oil & gas development
"With some work, it'd be a good tool as long as we remember it's a bridge". The problem I have always had with this statement, is that I do not see anyone laying the foundation, for the other side of this "bridge".
-
wili at 19:51 PM on 3 January 2014Methane emissions from oil & gas development
Methane concentration levels rose quite steadily for decades, plateaued briefly for a few years at the beginning of the century, then started rising again steadily from about 2006 on, just about the time that the boom in fracking really started to take off. (Graphs of these things are easily available on the web.)
I know that correlation does not necessarily prove causation, but let's not pretent that there is not a very strong correlation here, folks. It just makes you look as if you are trying to fudge the facts for some reason or other... -
One Planet Only Forever at 15:58 PM on 3 January 20142013 SkS Weekly News Roundup #52
davidnewell @ 10
I am an Engineer with an MBA so that does not make me an expert in climate science. However, it has given me a desire for trying to better understand what is going on. My perspective comes from reading things like Rachel Carson's "Silent Spring" and Paul Hawken's "The Ecology of Commerce", and writing by people like Noam Chomsky, as well as books by the WMO, and reviewing information on sites like this (and checking out what is presented on sites like WUWT).
In the introduction of your paper you suggest that global leaders are trying to stop the unsustainable and damaging activity. The facts would appear to be that the 'leaders without power and influence' are trying to get meaningful effective changes of behaviour from the powerful parties who are striving to 'maximize their competitive advantage any way they can get away with' to maintain 'popular support' among their populations which are filled with people who are inclined to be greedy by the socioeconomic system they are immersed in.
One thing I have noticed through the years is how many times 'unintended consequences' eventually came to be understood after significant damage had occurred from 'popular pursuits of benefit'. I have noticed this has increased, not declined, over the years. So we are not getting better at properly fully understanding what we are doing before we do it.
With each ‘better understanding’ that challenges the legitimacy of a pursuit of benefit there is a very strong PR pushback from the people who want to continue to benefit. We now understand things like how unsustainable it is to use antibiotics to address the health problems of cattle that are fed grain to get them to grow quicker. Those grain fed cattle are also the source of the now common poison meat if the digestive juices of such a cow touch any of the meat. Have you seen the cattle industry accept this? I have seen misleading messages from cattle producer associations in Canada trying to illegitimately justify their unsustainable and damaging practices. And they can get lots of support by saying ‘beef from grass fed cows would be more expensive’.
The real important lesson is that the best solution would be for humans to strive to minimize the impacts of their lifestyles while striving to most fully understanding the complexities of the environment we should be able to enjoy living in for billions of years. That means less chemicals, less consumption of non-renewable resources (full recycling is not consumption), less consumption of renewable resources. It basically requires ‘less’ to be ‘more’. And it definitely requires the greedy inconsiderate ones among us to never be able to succeed.
Truly sustainable ways of living need to be developed sooner rather than later. That will only happen if it is not possible for any humans to benefit from unsustainable, damaging or dangerous activities. This will require the wealthy and powerful to ‘willingly give up their opportunity for more’. If that does not happen there will not be a 'truly sustainable better future for all'. And I suspect that your suggested actions could be implemented before a full understanding of the implications can be developed (frankly, it could take decades, maybe centuries, to develop the required understanding), promoted by people who want to get more benefit for themselves any way they can get away with. Unfortunately, any ‘geo-engineered solution’ to the climate problem would likely be another unsustainable and ultimately damaging action. An additional consideration is that burning fossil fuels creates far more damage than the production of CO2 and its consequences. The activity simply needs to be ‘wound down’, the sooner the better (except for those who want to maximize their enjoyment through unsustainable damaging ways of living).
-
Joel_Huberman at 13:49 PM on 3 January 20142013 in Review: a Productive Year for Skeptical Science
Thanks for an excellent, interesting summary, Dana! Would it be possible to provide a higher-resolution version of the last figure (by Jos Hagelaars). I have difficulty telling where the red ends and the orange begins.
-
davidnewell at 13:05 PM on 3 January 20142013 SkS Weekly News Roundup #52
Two things:
i agree as usual with "one planet's" asessment of our human condition. Whatever we do, THAT issue will have to become obsolete, as we individually identify our "being" with the "WELL BEING of all.
"Think globally act locally??" That old saw has been around for decades, but not nearly as long as
"Do unto others as you would have them do unto you", or some such ascribed utterance from a couple thousand years ago.
I am somewhat surprised at the revulsion for "geoengineering" as a concept, since what we have "done" with burning fossil fuels can be regarded as IGNORANT geoengineering. What we need to do is be "unignorant" and emulate nature of which we are a part, and not let out "thinking minds" pretend that we are separate.
To this end, "I" will submit THIS paper, which constitutes a rational response to the issue, and which (in my considered opinion) will work quite well.
http://www.earththrive.net
Please note my website skills suck, butI hope to have up the support documents shortly.
We are all in this together.
David
PS: There are a heck of a lot of folks here that know more than I do: any comments appreciated. If it gets "shot down", that would be fine with me.
-
Russ R. at 11:13 AM on 3 January 2014Methane emissions from oil & gas development
So, despite the US boom in horizontal drilling and hydraulic fracturing that's described above, global methane emissions and concentrations are still significantly lower than projected by every single IPCC report.
It's also noteworthy that the IPCC's methane projections (along with others) migrated incrementally lower each time. (If you don't see why this pattern is noteworthy, I invite you to read Richard Feynman's 1974 comments about the replication and refinement of Milliken's oil drop experiment for measuring the charge of an electron.)
-
Russ R. at 10:57 AM on 3 January 2014Methane emissions from oil & gas development
gws.
I haven't modified any graphs. I haven't the time nor the inclination to do that sort of thing.
The original graph I linked (now helpfully removed by moderators) was from Figure 1.7 from the AR5 WG1 second draft (Octcober 2012). That document is no longer on the IPCC website (but it is avialable on the web...[-snip-]... you'll have to google it yourself.),
Obviously, the second draft has been replaced on the IPCC website by the June 2013 final draft ([-snip-] the link you provided will lead you to exactly the same document [-snip-]).
Moderator Response:[RH] Moderation complaints snipped.
-
Miguelito at 10:38 AM on 3 January 2014Methane emissions from oil & gas development
It's like comparing apples to oranges to grapefruit to lemons, actually, because it's a very complicated issue. What it's like in one region may not be what it's like in another (or in the same region at a different time).
The NOAA Colorado study has its issues. They measured the amount of propane in the atmosphere and then estimated methane contents by assuming and then applying a methane to propane ratio. The problem is that they used the state average for the ratio. While this would be great if they measured the amount of propane in the atmosphere across the state, they only measured emissions in Weld County, which is an area that produces alot of natural gas liquids and has many condensate tanks where some liquids-rich gas is simply vented into the atmosphere. Why is this relevant? The state average would very likely have a much higher methane:propane ratio than just Weld County, which would lead to a large overestimate.
Further, Levi (2012) was published as a reply comment in JGR. It used the NOAA's measurements of propane and butane to estimate methane contents and found that they were pretty close to the generally accepted 1.5% leakage rate. After the NOAA (2011) study replied to his reply, JGR pulished another followup reply in Levi (2013).
http://blogs.cfr.org/levi/files/2012/10/JGRCH4.pdf
http://blogs.cfr.org/levi/2012/10/12/revisiting-a-major-methane-study/
http://www.agu.org/pubs/crossref/pip/2012JD018487.shtml
http://blogs.cfr.org/levi/2013/03/06/one-more-round-in-the-methane-debate/
http://blogs.cfr.org/levi/files/2013/03/JGRResponse-Accepted.pdfFurther, Colorado wasn't a great area to examine emissions from shale gas production because there was virtually no shale gas production in Colorado at the time. What they were exploiting is tight gas, which is treated significantly differently from an operational perspective. Tight gas wells tend to flow at much lower rates and, therefore, operators would often just vent the methane to the atmosphere after fracking the well (small fracks, mind you, very different than fracking shale). This, of course, could lead to higher emissions, but is no reason to condemn shale gas (though is a reason to criticize tight gas development).
That's just the science behind the Colorado study. What about policy and regulations? The NOAA took its measurements in 2008. Why is this relevant? Because in 2009, the state introduced new regulations to crack down on methane emissions (going after that venting problem with tight gas). Since then, the state has made the regulations even tighter, calling for major improvements like mandatory green completions (all gas flowback must be captured into a pipeline instead of being vented or flared) and requiring all high-bleed valves on a well to be replaced by low-bleed valves. These regulations should serve as a model for the country (frankly, they're fantastic).
http://www.nytimes.com/2013/11/19/us/colorado-governor-proposes-strict-limits-on-greenhouse-gas-leaks-from-drilling.html
The Utah study I'm less familiar with, though probably would also be a tight gas operation and not shale gas. Utah's regulations on emissions are very poor and it isn't a big producer of natural gas to begin with (nor will it likely be one in the future), so it might not be very representative either.
As for the UT (2013) study, what it represents is tightly controlled shale-gas operations. Are all shale-gas operations like this? Maybe not, but many are. Most importantly, new regulations from the EPA are going to make green completions for shale-gas operations mandatory across the country (i.e. no venting and no flaring starting January 2015), which will probably make the UT (2013) study representative of almost all shale gas operations in the future.
http://www.epa.gov/airquality/oilandgas/pdfs/20120417changes.pdf
Of course, like you point out, emissions to do with oil development still have to be tackled (an absolute waste of energy to flare or vent that gas). The EPA's upcoming regulations won't apply to this, although it would be nice if they did. Then there are emissions from transmission and distribution, which are getting the study they deserve if we're to know how much of a problem they could really be.
Overall, alot of the emission problem from the upstream side of the industry is easily manageable, with some government bodies already addressing it. That's not to say everything is rosy (it isn't), but it doesn't mean natural gas has been written off as a valuable tool in the fight against global warming. With some work, it'd be a good tool as long as we remember it's a bridge and we bring production down in the long term.
-
gryffydd at 10:36 AM on 3 January 2014Sea Ice Volume is Not Recovering
@DavidBird, I understand what you are saying. The rounded edges of the volumes might also be contributing to the minimising effect. This is the unfortunate effect of working with 'cool' graphics.
Regardless of the graphics, 30% reduction in sea ice volume would have to be a signifigant cause for concern, because once the ice is gone, what is going to be absorbing the heat? It takes 334 joules of heat energy are needed to melt 1 gram of ice, but only 4.18 joules of heat energy to warm 1 gram of water by one degree.
Scary thought of the week? -
gws at 10:19 AM on 3 January 2014Methane emissions from oil & gas development
RH: all chapters are made available online by the IPCC here
http://www.ipcc.ch/report/ar5/wg1/#.UsYAr_vDswI
so we can discuss the contents.
Russ, the associate IPCC text is
"Because at the time the scenarios were developed (e.g., the SRES scenarios were developed in 2000), it was thought that past trends would continue, the scenarios used and the resulting model projections assumed in FAR through AR4 all show larger increasesthan those observed (Figure 1.6)."
Your graph is an adaptation of the actual IPCC graph, not the actual graph. Did you make it yourself, or where is it from?
-
gws at 10:08 AM on 3 January 2014Methane emissions from oil & gas development
Thanks Russ.
RE "predicted": that is the wording you used in your first post above, "predicted by climate modelers".
And yes, total global emissions have likely been lower than expected in earlier assement reports. If you follow the literature, there is a lively discussion since approx. 15 years on the reasons for the mixing ratio plateau reached roughly 10 years ago. It is now thought to be due to a new equilibrium having been reached (sources equal sinks). The renewed increase suggests that this equilibrium is no longer present, meaning sources outweigh sinks again.
-
Russ R. at 09:49 AM on 3 January 2014Methane emissions from oil & gas development
[-snip-]
And thank you, but I never suggested that models "predict" emissions. The chart is of concentrations, not emissions.
But the persistent difference between the projections and observations implies that either A) methane emissions have been significantly less than expected, B) methane's half-life in the atmosphere is significantly shorter than expected, or C) both.
Moderator Response:[RH] Deleted link to report stating "Do not cite, quote or distribute."
Russ... The very first page of that link clearly states: "A report accepted by Working Group I of the IPCC but not approved in detail."
-
gws at 09:22 AM on 3 January 2014Methane emissions from oil & gas development
Russ, could you please tell us where that graph is from? The timeline is odd.
Climate modelers do not "predict" methane emissions. They use the data assembled in the emissions projections, such as the RCPs used in AR5.
-
Russ R. at 08:33 AM on 3 January 2014Methane emissions from oil & gas development
While atmospheric methane levels are indeed several times higher than pre-industrial levels, the observed rate of increase has been substantially less than predicted by climate modelers.
Moderator Response:[RH] Deleted image from report stating "Do not cite, quote or distribute."
-
hank at 07:14 AM on 3 January 2014Still Going Down the Up Escalator
Is there a version of the escalator animated GIF that lays the uncertainty over the trend lines? (The uncertainty, or confidence limits, or probability, however you call it, the 'gray cloud' that the trend line represents overly precisely in the graph.
That would be a fat fuzzy line for the 7-year trend, with fewer data points (fewer data points; maybe different variability in each 7-year sample?) compared to a svelte fuzzy line for the long time trend, calculated with more data points and the overall variability).
-
One Planet Only Forever at 05:09 AM on 3 January 20142013 SkS Weekly News Roundup #52
Tom Curtis @ 7
The global socioeconomic-political system is the problem. The ‘competition’ for things that everyone cannot have encourages the development of attitudes of greed and intolerance. And when the greedy and the intolerant ‘succeed at any of the many unacceptable things they will try to get away with’, significant damage is produced with many others suffering the consequences.
Popularity of illegitimate beliefs and attitudes can easily be created. The burning fossil fuels illegitimately developing into such a large part of ‘the way people believe they can get away with obtaining personal benefit’ has created a large pool of easily impressed people.
Money obtained from illegitimate activities can be abused to create popular support among the easily impressed for the unjustified and illegitimate activities. That ‘illegitimate popularity’ is then claimed to be a justification for all manner of illegitimate activity. Expansions of fossil fuel burning are ‘justified’ by claims that the damages created today and risks to the future are ‘worth it’. The ridiculous evaluations go like this:
- The current people wanting to benefit from an unsustainable and damaging activity (like burning fossil fuels), evaluate what they believe ‘would not be gained by them if they were not allowed to do the unsustainable and damaging activity’
- They also evaluate what they believe to be the ‘costs of the damage of their desired unsustainable activity’. They will even go further and claim that any future cost is less important than a current day cost. And they will exclude any ‘cost they have no method to evaluate (or no interest in evaluating)’.
- They then justify doing the unsustainable and damaging activity by claiming their inflated personal benefits are worth the discounted and diminished costs faced by others.
The global leaders are simply pursuing popular support, regardless of how illegitimate and unsustainable and damaging that is.
The real problem is the socioeconomic system that ‘continues to be popular’ and the type of leaders who succeed. The more people there are who only care about what they can get for themselves, the more difficult it is for a sustainable better future for all life on this amazing planet to be developed by concerned, caring and considerate people (they cannot get the required leadership actions).
The burning of fossil fuels is not the only unacceptable activity keeping humanity from developing a sustainable better future for all. However, it is one of the clearest examples of ‘how wrong’ the socioeconomic systems are that encourage people to ‘compete to get the most benefit for themselves as quick as possible any way they can get away with’. The popularity of greed (and its partner in political crime, intolerance), is the real problem. A sustainable better future for all will never develop as long as the greedy and intolerant can ‘succeed’.
p.s. The link between greed and intolerance is simple. The greedy will do whatever they can get away with to get more for themselves. If they can get political power by partnering with the intolerant, they are willing to give the intolerant what they want because it ‘costs them nothing to do so’. The intolerant will partner with the greedy because they do not care how their intolerant attitudes are supported, and they will even contribute money to the promotion of a political party
-
Bob Loblaw at 02:57 AM on 3 January 2014More misleading Congressional climate testimony
Just to elaborate a bit on Dikran's second paragraph about selecting a null hypthesis:
The statistical test used to determine significance requires comparing the observed trend to the expected trend - specifically, you calculate the difference between the two, and compare that to the uncertainty of the observed trend.
When you use common english and say "the planet is warming", you are making an implicit comparison with "temperature is not changing", which is Dikran's "no warming" scenario. In such a case the "expected" value is zero.
When you use common english and say "the warming has paused", you are making an implicit comparison between the current trend and some past trend that was clearly not zero ("warming"). Thus, the expected value is that past trend. (Dikran suggests the IPCC projecton of 0.2C/decade, which is entirely appropriate if you want to claim that the observed data disproves the IPCC projection).
Howeverly politely Dikran describes Christy's behaviour, I personally think that Christy (and Roger Pielke Sr., who has made similar claims here at SkS) know and understand this. In British parliamentary tradition you are not supposed to call someone a lair, but I think you are allowed to say that they are deliberately misleading.
-
Dikran Marsupial at 22:45 PM on 2 January 2014More misleading Congressional climate testimony
Barry, the UAH measurements do contradict Christy's statement "As the global temperature failed to warm over the past 15 years...", so I think Dana's comment is essentially O.K. from a statistical point of view as he does not appear to be claiming that these measurements in isolation establish that there has been warming, merely that the data do not agree with Christy's statement, which is not the same thing, and a much weaker claim. While the confidence interval (and the corresponding credible interval from an equivalent Bayesian analysis) contains zero, the bulk of the confidence interval is clearly above zero which suggests that the UAH data do provide evidence that it is more likely that the planet has been warming than not, just not enough to effectively rule out the possibility that it hasn't been warming. This means that the UAH data suggest (fairly strongly, but not conclusively) that Christy's statement is incorrect.
Sadly frequentist statistics is fundamentally unable to assign a (non-trivial) probability to the truth of a particular hypothesis (as it is either true or false and has no long run frequency). Unfortunately this is what we actually want, and as a result frequentist hypothesis tests are rather counter-intuitive and easily misinterpreted.
Frequentist hypothesis tests however do provide a useful sanity check against getting carried away with ones' theories. We first set up a null hypothesis that expresses what we do not want to be true, and only proceed with our theory if the data are sufficiently unlikely to have been observed if the null hypothesis is true. Christy is not using hypothesis tests in this manner as he is using a null hypothesis (no warming) that agrees with his position, and hence it fails as even a sanity check. Christy should instead be using the IPCC projection of 0.2 degrees per decade as his null hypothesis and see if that can be rejected (it can't) before claiming that there has been no warming. Sadly if you fail to perform sanity checks, you run the risk of making public statements that are incorrect.
Now from the "warmist" perspective, the standard "zero trend" is a reasonable null hypothesis, and indeed, we should not claim warming based solely on the observed trend, unless it is statistically significant. However the "based solely on the observed trend" is quite important here, as the observed trend is not the only evidence we have that the planet is warming. There is also physics, measurements of ocean heat content and measurements of factors inducing internal variability, such as ENSO. If we take these things into account (e.g. Foster and Rahmstorf) the trend is statistically significant. These suggest that the planet is still warming, but redistribution of heat means that this has been less apparent in near surface temperatures than we would normall expect.
-
michael sweet at 12:35 PM on 2 January 20142013 SkS Weekly News Roundup #52
The problem with geoengineering is that it is likely to cause severe drought somewhere even if it reduces temperature. Who will get the cooler temperature and who will get the drought? We will have to rely on climate models to predict who will get what. Who trusts climate models that much? For example, if China gets drought and the USA gets cooler temperatures should we block the sun? What do the Chinese think about that? What if the USA gets the drought and China gets the lower temperatures? Climate will not necessairly be better, even if it is cooler, if major farmng regions are hit with drought.
It seems to me that whoever gets something they don't like will be angry and want to stop the geoengineering. Someone (everyone?) will be angry. There is also the question of cost of geoengineering forever, where the energy to do the geoengineering comes from, and if the geoengineering is ever stopped for even a short time temperatures will jump.
Perhaps geoengineering is not a life raft but a life preserver. Who wants to swim across the Atlantic?
-
wili at 10:45 AM on 2 January 20142013 in Review: a Productive Year for Skeptical Science
"We've got a couple posts coming up on Sherwood's paper."
When you do, you might want to include this brief, clear explanatory video featuring Sherwood himself:
Moderator Response:[PS] Fixed link
-
sailrick at 10:36 AM on 2 January 20142013 SkS Weekly News Roundup #51B
The link for the aricle on the Great Barrier Reef leads back here, instead of to the article at the Guardian
Moderator Response:[JH] Link fixed. Thank you for bringing this to our attention.
-
dana1981 at 10:24 AM on 2 January 20142013 in Review: a Productive Year for Skeptical Science
We've got a couple posts coming up on Sherwood's paper.
-
Tom Curtis at 09:36 AM on 2 January 20142013 SkS Weekly News Roundup #52
One Planet Only Forever @6, eloquently stated. It also, I believe ignores other aspects of the problem with geoengineering by reducing sunlight. Consequently I agree with you that mitigation is the best strategy at the moment.
Never-the-less, as world governments continue to dawdle in tackling climate change, they push up the costs of mitigation. Therefore continued dawdling may well push us into a situation where we must choose between pure, unmitigated climate change of +4 C or more, or reduction of CO2 emissions and concentration and reduction in insolation as a bridging method to avoid the worst consequences of global warming. That is, we may be forced to choose the least worst of two ills.
We are in the situation of the Titanic. If the captain does not turn and slow the ship soon, we may well be happy of the existence of life boats in the form of geoengineering, without in any way implying that life boats are a preffered method of crossing the Atlantic.
Prev 784 785 786 787 788 789 790 791 792 793 794 795 796 797 798 799 Next


