


 Arguments


More misleading Congressional climate testimony
Posted on 26 December 2013 by dana1981
On December 11th, the US Congress Committee on Science, Space, and Technology (labeled by many the House Anti-Science Committee for the unscientific views of many of its Republican members) held a hearing on the link between climate change and extreme weather events. Unfortunately, like many such hearings, the purpose of the event appeared to be more about reinforcing preconceived notions than educating committee members. This was made clear by a simple examination of the invited witnesses.
The Republicans on the committee invited two witnesses, John Christy and Roger Pielke Jr. House Republicans regularly invite Christy to testify on climate issues, because he's one of the less than 3 percent of climate experts whose research indicates that the human contribution to global warming is relatively small. Christy also reliably provides factually inaccurate testimony at these hearings, and this time around was no exception. In fact, Christy led off his written testimony with the following myth:
"As the global temperature failed to warm over the past 15 years..."
John Christy and Roy Spencer compile satellite measurements of the temperature of the Earth's atmosphere at the University of Alabama at Huntsville (UAH). Their data set estimates the warming of the lowest layer of the Earth's atmosphere at 0.21°C over the past 15 years, so Christy's opening statement is in direct contradiction with his own data. New estimates of average global surface temperatures also put the value at about 0.21°C global surface warming over the past 15 years.
Additionally, the warming of the atmosphere only accounts for about 2 percent of the warming of the global climate, which as a whole has accumulated heat at a rate equivalent to 4 Hiroshima atomic bomb detonations per second over the past 15 years. Perhaps the House Republicans keep inviting Christy to testify because he tells them what they want to hear regardless of its factual accuracy.
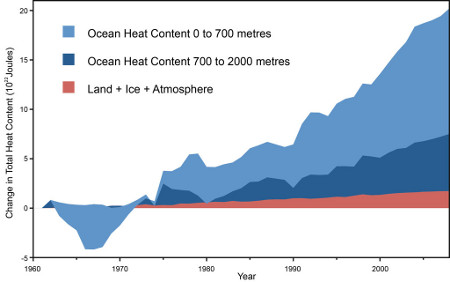
Global heat accumulation from Nuccitelli et al. (2012)
Roger Pielke Jr. was more factually accurate with his testimony, but conveniently for those who favor climate inaction, he's known for downplaying the link between human-caused climate change and extreme weather events. This link is often difficult to make because our records of some types of extreme weather measurements aren't very good, and because it's difficult to tease out human contributions from natural variation. Pielke tends to focus on the links we can't yet make while downplaying or ignoring the links that we can.
For example, human-caused global warming has increased the frequency and/or intensity of heat waves, extreme storms, floods in some areas, and droughts in some areas. We know that hurricane intensity in the North Atlantic has increased, and is expected to continue increasing as global warming continues, because warmer oceans are fuel for hurricanes. New preliminary research from James Elsner suggests that US tornadoes may be becoming more intense, and a new paper led by Kevin Trenberth suggests that global warming will also make droughts more intense.
Pielke also claimed,
"The United States is currently in a remarkable stretch with no major hurricane (Category 3+) landfalls"
While Sandy was technically a Category 1 hurricane when it made landfall, it was also more energetic than Hurricane Katrina at landfall, and inflicted about $50bn in damages. People living in New Jersey and New York would likely object to the claim that Sandy was not a major hurricane.
To counter the testimony from the Republican witnesses downplaying the risks from climate-amplified extreme weather, Democrats invited retired Navy Rear Admiral David Titley, who's now the director of the Center for Solutions to Weather and Climate Risk at Penn State. As his title suggests, Titley focused on approaching the problem from a risk management perspective. In his written testimony, Titley noted,
"The Absence of Evidence is not the Evidence of Absence ... to ignore the possibility of change is the same as assuming we have high confidence there will be no change - and that is simply not true."
In other words, while we can't yet confidently link human-caused climate change to some types of extreme weather, that doesn't necessarily mean there is no link. Titley also used his military background to draw an analogy to risk management in national defense, showing the following chart.


Unfortunately Republicans in Congress aren't interested in learning about or making any efforts to solve the climate problem. Their goal is to maintain the status quo, and to find witnesses who will give them the testimony to justify doing so. It's a huge problem that these people are in charge of one of the two major parties in the world's largest historical GHG emitting country.
The prescreening of experts to testify on issues that could have economic impact is the standard practice in a political system the runs on patronage. Actual facts and truth are not what are wanted nor expected, but ammunition for selected points of view that support those who give partonage to keep the polticals in their careers. This, among other reasons, is why the American poltical process is broke or effectively bogged down at best.
What else did you expect from a bunch of antidiluvian old fossils who prefer to wreck their own country rather than allow a black man who far exceeds them in intelligence, humanity and vision to succeed in pulling America out of the hole it has dug for itself. They have zero concern for the good of their country of of their citizens and even less (minus) for the good of the world we share with them.
[PS]. Please note the "No Politics" part of the Comments Policy. While this might be difficult on this topic, no more rants please.
And so it goes: "Extreme Whether" tells this story from our side! And we just received at $5000 matching grant from an angel who believes this play has to be widely seen. Any donation you now give is doubled! http://www.indiegogo.com/projects/extreme-whether
TonyW @6.
There can be many evaluations of the rate of change. Trend lines through the data sets can take many forms, as can the 'rate of change' of any portion of the data set.
Very simple evaluations of The NASA/GISS temperature data set show the following change has occurred over the past 15 years (from 1997 to 2012):
Just for fun, the same comparison can be done for 1998 to 2013 using te December to November Annual averages presented on NASA/GISS:
Similar results will be found in the other data sets, including the satellite data sets developed by Christy and Spencer.
Those who want to claim there has been no warming or little warming or cooling can find ways to 'show what they want people to believe', but they have to keep people unaware of all the rest of the information and what it shows.
That 'keeping people less aware' is the game played by everyone who is a cheater and knows they are a cheater (most of the Republicans, and even some of the Democrats). And on this issue it is very easy to 'fool many people'. Many people have been made greedy by the socioeconomic system. And they have also been made desperate by the same system. The greedy desperate ones are the most easily impressed by claims that the unsustainable and damaging activities they are familiar with getting benefit from cannot be blocked and must be allowed to increase. The easily fooled believe that is their best and only hope. They do not care that what they want to pursue is unsustainable and damaging. They are desperate and greedy.
Approx 2 billion hiroshima bombs of heat added since 1998. That sounds frightening. It would be informative to know the heat content of the oceans in hiroshima bombs in 1998?
Dana's figure of 0.21C over 15 years is a trend of 0.14C/decade. This figure comes from the new monthly updates to our hybrid data, using the period Nov 98-Oct 13. We're hoping to release the monthly updates in the next couple of weeks, but bearing in mind people may use this in papers we're being very careful.
(I've already made and fixed one mistake in reconstructing the Hadley land ensemble. Trying to maintain professional QA labels in your spare time is really hard.)
Yeah, what Kevin said :-)
Question on statement above. "While Sandy was technically a Category 1 hurricane when it made landfall, it was also more energetic than Hurricane Katrina at landfall, and inflicted about $50bn in damages." The Categories are based on windspeed, right? What is the "more energetic" assertion based on?
Additionally, level of property damage is not a good value to utilize in arguing about increases in storm intensities as that value very dependant on population growth in geographic areas and community preparedness for storms. If Sandy had hit an unpopulated, undeveloped area or hit an area that was very well prepared for storm surge and the resulting $ value of damage was very low, it would certainly NOT be evidence that climate change is not causing increased storm intensities.
joeygoze, the usual measurement is "accumulated cyclone energy".
Basically, hurricane Sandy was much larger than most storms. Category 1 winds covering nearly the entire US east coast is a much more powerful storm than Category 1 winds covering a few hundred square miles. The amount of rainfall, size of the storm surge, duration of high winds, et cetera, are all increased.
I'm a bit confused here, too. I followed the link to the the trend calculator, and using UAH data ["their data set"], I got a trend of 0.054C/dec, with an uncertainy of +/- 0.25C for the last 15 years (1998 - 2012 inclusive). I used the last 15 full years, having read Tamino on annual cycle issues.
The trend is not statistically significant, therefore warming cannot be said to have occurred using just this data set, and the warming revealed is 0.081C for the last 15 full years ignoring uncertainty, not 0.21C. I get the same figure as the article if I calculate to the last calendar month, but the uncertainty larger than trend remains.
1) Have I misunderstood the uncertainty issue?
2) Am I over-cautious regarding the annual cycle problem?
Number 1) seems to undermine the definitive claim of warming for the last 15 years - using only the UAH data set.
Happy New Year to all.
Barry @13, as you recognize @14, it is now 2014. The last 15 years, therefore, starts in January of 1999, from which date the trend calculator shows a trend of 0.146 +/- 0.215 C per decade. That misses the last one or two months data, including the December data which has not been released yet (and probably not yet calculated). Using WoodforTrees, and ensuring a full 15 years data from Dec 1998-Nov 2013, the trend is 0.135 C per decade.
Those figures are not the 0.21 C quoted in the OP, which appears to be a mistake. Never-the-less, it shows how precarious is the position of those who hang their "skepticism" on short "15 year" trends. No doubt it will be Christy's new year resolution to break that bad habit, and to now discuss only 16 year trends.
Having said which, Happy New Year.
Barry - Looking at the UAH data set there has been no significant warming since last Tuesday. That statement, while true, is about as useful as yours; a lack of statistical significance for short time periods (15 years is quite short for atmospheric temperatures) indicates insufficient data, not a "pause" or for that matter a sudden acceleration. You need enough data to actually make a determination.
[Source]
More complete data sets, such as those including ocean heat content, have sufficient data to discern trends from variation for shorter periods - and those show warming. As do all data sets if you look at enough data to make a distinction - warming.
Claims from insignificant time periods are simply making noise about noise.
Thanks for the replies.
KR - you and I are making the same point. It was this statement from the article caught my attention.
I would hesitate to describe that as 'making noise about noise', but it is odd to see a definitive trend value given at SkS when the uncertainty is greater than the trend. Seems out of place in an otherwise reasonable article.
Barry - Unfortunately, "15 years" is a bit vague; I would be reluctant to say yea or nay on a particular figure without knowing the exact beginning and end points of that trend calculation. I don't know how when, for example, this post was initially written, just when it was published, and that may make a difference.
Regardless - the UAH data shows an upward (albeit not statistically significant) trend over 1998-2013, and hence Christy's claim that "As the global temperature failed to warm over the past 15 years..." is demonstrably false.
So, John Christy conveniently neglects to mention the oceans - where 93.4% of global warming has been accumulating in the last several decades.
I wonder why?
KR, the OP was published on Dec 26th, 2013 with reference to testimony by John Christy on Dec 11th 2013. A claim by Christy made at that date is innaccurate if it refers to any period other than Dec 1998 to Nov 2013, or if he had not yet published the Nov 2013 temperatures, Nov 1998 to Oct 2013 (again 0.135 C/decade). If he instead relied on the trend of annual data from Jan 1998 to Dec 2012, he did so knowing that his own data now showed something quite different.
Even if we pretend its OK to use obsolete data in testifying to Congress when you know the up to date data shows something different, we still face the simple fact, well stated by babazoroni:
Every scientist knows about regression to the mean. Therefore every scientist knows that choosing a start date for a trend that lies well above the trend to that point will produce a trend less than the long term trend. Therefore Christy knows that choosing a 15 year trend up to mid 2013, and a 16 year trend now misrepresents the science. And to illustrate babazaroni's point:
UAH trend to Dec 1997: 0.044 +/- 0.161 C/decade
UAH trend from Jan 1998 to Nov 2013*: 0.059 +/- 0.226 C/decade
UAH trend to Nov 2013*: 0.138 +/- 0.07 C/decade
* trend calculated on SkS trend calculator, best estimate of terminal month
Tom Curtis - Agreed and agreed, the '15 years' bandied about by deniers is just nonsense. There is a good discussion by Tamino entitled Fifteen, showing how that period is well above the longer term mean - that slower increases have not yet dropped the temperatures as far below the long term trend as 1998 pushed them above. As to dates, I'm not certain when the most recent UAH data was made available, relative to the testimony and the OP.
Christy has an ongoing history of presenting flat graphs that are irrelevant, too short for significance (15 years, tornados, etc), un-normalized for observation history (max temp records, disasters), cherry-picked (Sierra or winter-only snowfalls ignoring continental yearly data), grossly manipulated (UAH to HadCRUT comparisons [mis]using a single extrema point for a baseline), etc., and attempting to use them as misleading rhetorical arguments against the existence of global warming. His Congressional testimony is just more of the same.
Tom, KR,
Christie's claim that the globe has failed to warm over the last 15 years is false.
But the SkS claim that UAH TLT data show a definitive warming of 0.21C - or indeed by any amount - over the last 15 years is not correct either. There is a statistical possibility the trend is zero, whichever start/end dates are chosen. (I am by no means trying to argue that there has been a 'pause' in global temperatures)
That one sentence in the article sticks out for someone who has followed the 'debate' closely for years. A trend value absent uncertainty estimates is a red flag as Tamino and others have noted. But perhaps I'm stepping on the troubled nexus between effective communication and scientific accuracy (assuming my points have merit).
Barry @22, clarrifying my inaccurate reading above, and as Kevin C points out @9 above, the article refers to the total warming over 15 years, not the 10 year trend over the last 15 years. Thus the 0.21 C/15 years is equivalent to 0.14 C/decade which is the correct value rounded to two significant figures. Consequently the trade off between effective communication and accuracy largely reduces to the appropriateness of the rounding, and of not quoteing error margins.
Note that whatever our view on this, if we have an issue with SkS's practise in this article, we must have a greater issue with Christy's comments before congress. Christy's "global temperature failed to warm over the past 15 years" equates to citing a trend of 0.0 C/decade with no error margin. That is, he rounded the (presumably) 1998-2012 rate to the nearest whole number and dropped the error margins. If you have a problem with SkS rounding to the nearest hundredth, you must think Christy's claims outrageous. Indeed, not a single error margin is to be found in his entire presentation.
On the matter of accuracy and effectiveness, however, the key points is that your communication must not mislead; and that must be part of a series of communications that invites people to find out more. Thus, in the case above, the 15 year trend without error margins is mentioned, but there is also a link to the SkS trend calculator so that those interested can find the full information, including error margins. Again this contrasts with Christy, who at several points in his talk refers to data that has not been published in peer reviewed papers, and which he does not provide sufficient background information for the data to be recreated.
There is a minor problem, however, with the SkS figure IMO. In calculating it, it appears as though they have first rounded the trend, then multiplied it out to 15 years. Had they reversed the procedure, they would have got a more accurate 0.2 C over 15 years (0.2025 without rounding).
Tom,
Thanks again for the reply.
Rounding is not what I take issue with. Maybe I'm not making my point clearly enough. I quote Tamino in case that helps.
If the uncertainty estimate is larger than the trend over the 15 years, then no definitive value or even sign for that trend can be claimed - by anyone. Dana compounds Christy's error on this point. Pointing to the mean estimate doesn't mitigate this, and we would instruct a contrarian on statistical significance if they did the same.
I believe the accuracy of the argument could be improved without undercutting it's effectiveness. KR's reference to Tamino's 'Fifteen' post lights one possible way.
barry - In light of the (frequent) denier claims that there has been no warming in the last 15-16 years, only occasionally qualified by "no statistical" warming - pointing out that there has indeed been warming at nearly statistical significance is entirely appropriate.
I had a conversation with someone on JoNova regarding this - they asked "...what if 2-3 years more data show cooling?". I replied that I would be very happy about it. But given that the 15 year record showed warming, that 2-3 more years would likely show statistically significant warming, and that the underlying physics hadn't changed, their hypothetical would require massive drops in temperature to produce a downward trend. Something on the line of the McLean nonsense; which I considered rather unlikely...
"No statistically significant warming" does not mean "no warming", and false 'skeptic' arguments based on semantic ambiguity should be pointed out.
Barry, the UAH measurements do contradict Christy's statement "As the global temperature failed to warm over the past 15 years...", so I think Dana's comment is essentially O.K. from a statistical point of view as he does not appear to be claiming that these measurements in isolation establish that there has been warming, merely that the data do not agree with Christy's statement, which is not the same thing, and a much weaker claim. While the confidence interval (and the corresponding credible interval from an equivalent Bayesian analysis) contains zero, the bulk of the confidence interval is clearly above zero which suggests that the UAH data do provide evidence that it is more likely that the planet has been warming than not, just not enough to effectively rule out the possibility that it hasn't been warming. This means that the UAH data suggest (fairly strongly, but not conclusively) that Christy's statement is incorrect.
Sadly frequentist statistics is fundamentally unable to assign a (non-trivial) probability to the truth of a particular hypothesis (as it is either true or false and has no long run frequency). Unfortunately this is what we actually want, and as a result frequentist hypothesis tests are rather counter-intuitive and easily misinterpreted.
Frequentist hypothesis tests however do provide a useful sanity check against getting carried away with ones' theories. We first set up a null hypothesis that expresses what we do not want to be true, and only proceed with our theory if the data are sufficiently unlikely to have been observed if the null hypothesis is true. Christy is not using hypothesis tests in this manner as he is using a null hypothesis (no warming) that agrees with his position, and hence it fails as even a sanity check. Christy should instead be using the IPCC projection of 0.2 degrees per decade as his null hypothesis and see if that can be rejected (it can't) before claiming that there has been no warming. Sadly if you fail to perform sanity checks, you run the risk of making public statements that are incorrect.
Now from the "warmist" perspective, the standard "zero trend" is a reasonable null hypothesis, and indeed, we should not claim warming based solely on the observed trend, unless it is statistically significant. However the "based solely on the observed trend" is quite important here, as the observed trend is not the only evidence we have that the planet is warming. There is also physics, measurements of ocean heat content and measurements of factors inducing internal variability, such as ENSO. If we take these things into account (e.g. Foster and Rahmstorf) the trend is statistically significant. These suggest that the planet is still warming, but redistribution of heat means that this has been less apparent in near surface temperatures than we would normall expect.
Just to elaborate a bit on Dikran's second paragraph about selecting a null hypthesis:
The statistical test used to determine significance requires comparing the observed trend to the expected trend - specifically, you calculate the difference between the two, and compare that to the uncertainty of the observed trend.
When you use common english and say "the planet is warming", you are making an implicit comparison with "temperature is not changing", which is Dikran's "no warming" scenario. In such a case the "expected" value is zero.
When you use common english and say "the warming has paused", you are making an implicit comparison between the current trend and some past trend that was clearly not zero ("warming"). Thus, the expected value is that past trend. (Dikran suggests the IPCC projecton of 0.2C/decade, which is entirely appropriate if you want to claim that the observed data disproves the IPCC projection).
Howeverly politely Dikran describes Christy's behaviour, I personally think that Christy (and Roger Pielke Sr., who has made similar claims here at SkS) know and understand this. In British parliamentary tradition you are not supposed to call someone a lair, but I think you are allowed to say that they are deliberately misleading.