


 Arguments


Recent Comments
Prev 787 788 789 790 791 792 793 794 795 796 797 798 799 800 801 802 Next
Comments 39701 to 39750:
-
gws at 02:25 AM on 4 January 2014Methane emissions from oil & gas development
Russ, your argument on the projections is a non sequitur. Of course the science community corrected the projections over time because science progresses; we learn, we do better. That said, the global inventory (remember: it is only an educated guess) likely still overestimates methane emissions, mostly due to assumptions of (too?) high emission rates from coal mining in east Asia.
There is evidence from measurements and modeling (see the van Amstel review I linked, or Katzenstein et al., PNAS 2003, for a regional persepective) that North American (NA) methane emissions have generally been underestimated in the past. It is, however, speculation to link global atmospheric abundance to what happens in NA. As included in our post last year (linked above), global ethane abundance has dropped, suggesting that global fossil fuel related methane emissions may have dropped, especially in the former Sowiet Union in the 90ies. That likely contributed to the methane mixing ratio plateau. In general though, the plateau is driven simply by an approach to steady state due to a near contant global methane emission rate (550 +- 50 Tg/yr) between the mid 80s and mid 2000s.
Is the renewed increase linked to what happens (fracking?) in NA? Again, likely not. The methane abundance pattern, see here, is generally driven by the largest natural source, wetlands, especially in the tropics. I encourage you to watch Ed Dlugokencky's talk at AGU, session U33A-04. The midlatitude contribution is thought to be related to anthropogenic sources increasing, such as in East Asia, but the coarse resolution of the global data is not helping in pinpointing sources (see e.g. Bergamaschi et al., 2013, in JGR-Atmospheres).
-
It's waste heat
old sage - I will also note that you are recycling much of the same nonsense you put forth earlier in the thread (here and subsequent discussion). Said assertions on your part were nonsense, and eventually moderated/snipped as sloganeering.
You do not appear to have added any actual content to your arguments at the current time.
-
Dikran Marsupial at 01:40 AM on 4 January 2014It's waste heat
Old Sage, you still appear to be labouring under a misapprehension over the basic operation of the greenhouse effect, that I pointed out to you earlier in the thread here.
You write "As CO2 is 2.5 times heavier than H2O, I doubt that there is a significant CO2 effect trapping heat above the topmost cloud cover."
The greenhouse effect depends on the temperature of the radiating layer in the atmosphere where outbound IR is not absorbed by CO2 (or H2O).
Note also that the atmosphere gets colder with height, which means that the atmosphere also gets drier with increasing altitude because the water vapour precipitates out.
"I remain a sceptic over the overarching significance of CO2 when set against that of H2O."
Well perhaps you should have read the realclimate article that I mentioned in my previous reply to your earlier comments.
-
It's waste heat
old sage - There are more errors in your posting than are worth the time to point out. I'll simply list a couple of them.
"Despite argument to the contrary, it is a scientific fact that the major energy transfer agent from the surface is kinetic by gases." False. See for example the Trenberth 2009 energy budgets, which note that ~97 W/m2 transfer from surface to atmosphere via evaporation and thermals, while ~396 W/m2 by IR, or a 4:1 ratio. Your assertion is not even close to reality.
"As CO2 is 2.5 times heavier than H2O, I doubt that there is a significant CO2 effect trapping heat above the topmost cloud cover." Again, False. CO2 is a well-mixed gas, present throughout the atmosphere. And in fact it's primary effect as a GHG occurs above where water vapor does. If your statement were correct, valleys would be uninhabitable due to CO2 levels, which is clearly _not_ the case.
Your post consists of pseudoscientific Woo - I would suggest doing some reading. The Discovery of Global Warming by Spencer Weart would be an excellent starting point.
-
old sage at 00:53 AM on 4 January 2014It's waste heat
I have speculated about a number of ways in which the earth can dissipate energy apart from i/r emissions and no doubt they play a part - especially if things get violent. However the relative importance of waste heat is coming up the conscience scale as models are now beginning to refer to 'urban hotspots'.
I think the following argument will show why waste heat is more important than the simplistic arguments which seek to dismiss it.
You have to return to the fundamental physical - not organic -phenomena which makes the earth's response to variations in incident energy so robust.
From afar, the earth is a spheroid which will see its surface temperature vary by 1 deg K (around 300 say) for every 1.35% change in solar energy - whether by orbit or output. So that degree of stability is pretty assured.
Next, the difference between a cloud base at the bottom of the troposphere and top, ten miles, corresponds to a 0.5% change in the effective radiating surface area. It means that should the temperature rise by 1/3rd degree, it could be eliminated by increased radiation from elevated cloud cover.
Despite argument to the contrary, it is a scientific fact that the major energy transfer agent from the surface is kinetic by gases.
The physical mechanism for raising the emitting surface is that as water is the pervasive surface on earth, any general heating increases the water vapour content. Being lighter than all other gases (except Helium) it takes latent heat and acquired kinetic energy up to a point where it condenses into droplets. These radiate extremely efficiently so that a cloud effectively becomes the conversion mechanism for kinetic to radiant discharge.
The effective radiating surface is not just the radius effect. Each droplet radiates isotropically so do all those droplets within five characteristic absorption lengths of the surface adding to the output. The surface also is lumpy with towering pillars of cloud. The mechanism deserves fuller treatment than I can cover here to show outbound exceeds downward but the net effect is to provide a temperature dependent height for a surface from which earth radiates.
As CO2 is 2.5 times heavier than H2O, I doubt that there is a significant CO2 effect trapping heat above the topmost cloud cover. I remain a sceptic over the overarching significance of CO2 when set against that of H2O.
The upshot is that waste heat involves a huge lag between its generation and the increase of H2O as required for temperature stability whereas all natural changes are immediate because the oceans are bathed by it. Waste heat is generated in concentrated areas over land and is different from the patterns which produce the jet stream and trade winds. That may have a greater impact on climate phenomena than anything. A mouse can upset a see saw balanced by two elephants.
Of one thing I am sure, waste heat is not ignorable.
Moderator Response:[JH] Unneccesary white space eliminated.
-
minglewood at 22:48 PM on 3 January 2014Methane emissions from oil & gas development
"With some work, it'd be a good tool as long as we remember it's a bridge". The problem I have always had with this statement, is that I do not see anyone laying the foundation, for the other side of this "bridge".
-
wili at 19:51 PM on 3 January 2014Methane emissions from oil & gas development
Methane concentration levels rose quite steadily for decades, plateaued briefly for a few years at the beginning of the century, then started rising again steadily from about 2006 on, just about the time that the boom in fracking really started to take off. (Graphs of these things are easily available on the web.)
I know that correlation does not necessarily prove causation, but let's not pretent that there is not a very strong correlation here, folks. It just makes you look as if you are trying to fudge the facts for some reason or other... -
One Planet Only Forever at 15:58 PM on 3 January 20142013 SkS Weekly News Roundup #52
davidnewell @ 10
I am an Engineer with an MBA so that does not make me an expert in climate science. However, it has given me a desire for trying to better understand what is going on. My perspective comes from reading things like Rachel Carson's "Silent Spring" and Paul Hawken's "The Ecology of Commerce", and writing by people like Noam Chomsky, as well as books by the WMO, and reviewing information on sites like this (and checking out what is presented on sites like WUWT).
In the introduction of your paper you suggest that global leaders are trying to stop the unsustainable and damaging activity. The facts would appear to be that the 'leaders without power and influence' are trying to get meaningful effective changes of behaviour from the powerful parties who are striving to 'maximize their competitive advantage any way they can get away with' to maintain 'popular support' among their populations which are filled with people who are inclined to be greedy by the socioeconomic system they are immersed in.
One thing I have noticed through the years is how many times 'unintended consequences' eventually came to be understood after significant damage had occurred from 'popular pursuits of benefit'. I have noticed this has increased, not declined, over the years. So we are not getting better at properly fully understanding what we are doing before we do it.
With each ‘better understanding’ that challenges the legitimacy of a pursuit of benefit there is a very strong PR pushback from the people who want to continue to benefit. We now understand things like how unsustainable it is to use antibiotics to address the health problems of cattle that are fed grain to get them to grow quicker. Those grain fed cattle are also the source of the now common poison meat if the digestive juices of such a cow touch any of the meat. Have you seen the cattle industry accept this? I have seen misleading messages from cattle producer associations in Canada trying to illegitimately justify their unsustainable and damaging practices. And they can get lots of support by saying ‘beef from grass fed cows would be more expensive’.
The real important lesson is that the best solution would be for humans to strive to minimize the impacts of their lifestyles while striving to most fully understanding the complexities of the environment we should be able to enjoy living in for billions of years. That means less chemicals, less consumption of non-renewable resources (full recycling is not consumption), less consumption of renewable resources. It basically requires ‘less’ to be ‘more’. And it definitely requires the greedy inconsiderate ones among us to never be able to succeed.
Truly sustainable ways of living need to be developed sooner rather than later. That will only happen if it is not possible for any humans to benefit from unsustainable, damaging or dangerous activities. This will require the wealthy and powerful to ‘willingly give up their opportunity for more’. If that does not happen there will not be a 'truly sustainable better future for all'. And I suspect that your suggested actions could be implemented before a full understanding of the implications can be developed (frankly, it could take decades, maybe centuries, to develop the required understanding), promoted by people who want to get more benefit for themselves any way they can get away with. Unfortunately, any ‘geo-engineered solution’ to the climate problem would likely be another unsustainable and ultimately damaging action. An additional consideration is that burning fossil fuels creates far more damage than the production of CO2 and its consequences. The activity simply needs to be ‘wound down’, the sooner the better (except for those who want to maximize their enjoyment through unsustainable damaging ways of living).
-
Joel_Huberman at 13:49 PM on 3 January 20142013 in Review: a Productive Year for Skeptical Science
Thanks for an excellent, interesting summary, Dana! Would it be possible to provide a higher-resolution version of the last figure (by Jos Hagelaars). I have difficulty telling where the red ends and the orange begins.
-
davidnewell at 13:05 PM on 3 January 20142013 SkS Weekly News Roundup #52
Two things:
i agree as usual with "one planet's" asessment of our human condition. Whatever we do, THAT issue will have to become obsolete, as we individually identify our "being" with the "WELL BEING of all.
"Think globally act locally??" That old saw has been around for decades, but not nearly as long as
"Do unto others as you would have them do unto you", or some such ascribed utterance from a couple thousand years ago.
I am somewhat surprised at the revulsion for "geoengineering" as a concept, since what we have "done" with burning fossil fuels can be regarded as IGNORANT geoengineering. What we need to do is be "unignorant" and emulate nature of which we are a part, and not let out "thinking minds" pretend that we are separate.
To this end, "I" will submit THIS paper, which constitutes a rational response to the issue, and which (in my considered opinion) will work quite well.
http://www.earththrive.net
Please note my website skills suck, butI hope to have up the support documents shortly.
We are all in this together.
David
PS: There are a heck of a lot of folks here that know more than I do: any comments appreciated. If it gets "shot down", that would be fine with me.
-
Russ R. at 11:13 AM on 3 January 2014Methane emissions from oil & gas development
So, despite the US boom in horizontal drilling and hydraulic fracturing that's described above, global methane emissions and concentrations are still significantly lower than projected by every single IPCC report.
It's also noteworthy that the IPCC's methane projections (along with others) migrated incrementally lower each time. (If you don't see why this pattern is noteworthy, I invite you to read Richard Feynman's 1974 comments about the replication and refinement of Milliken's oil drop experiment for measuring the charge of an electron.)
-
Russ R. at 10:57 AM on 3 January 2014Methane emissions from oil & gas development
gws.
I haven't modified any graphs. I haven't the time nor the inclination to do that sort of thing.
The original graph I linked (now helpfully removed by moderators) was from Figure 1.7 from the AR5 WG1 second draft (Octcober 2012). That document is no longer on the IPCC website (but it is avialable on the web...[-snip-]... you'll have to google it yourself.),
Obviously, the second draft has been replaced on the IPCC website by the June 2013 final draft ([-snip-] the link you provided will lead you to exactly the same document [-snip-]).
Moderator Response:[RH] Moderation complaints snipped.
-
Miguelito at 10:38 AM on 3 January 2014Methane emissions from oil & gas development
It's like comparing apples to oranges to grapefruit to lemons, actually, because it's a very complicated issue. What it's like in one region may not be what it's like in another (or in the same region at a different time).
The NOAA Colorado study has its issues. They measured the amount of propane in the atmosphere and then estimated methane contents by assuming and then applying a methane to propane ratio. The problem is that they used the state average for the ratio. While this would be great if they measured the amount of propane in the atmosphere across the state, they only measured emissions in Weld County, which is an area that produces alot of natural gas liquids and has many condensate tanks where some liquids-rich gas is simply vented into the atmosphere. Why is this relevant? The state average would very likely have a much higher methane:propane ratio than just Weld County, which would lead to a large overestimate.
Further, Levi (2012) was published as a reply comment in JGR. It used the NOAA's measurements of propane and butane to estimate methane contents and found that they were pretty close to the generally accepted 1.5% leakage rate. After the NOAA (2011) study replied to his reply, JGR pulished another followup reply in Levi (2013).
http://blogs.cfr.org/levi/files/2012/10/JGRCH4.pdf
http://blogs.cfr.org/levi/2012/10/12/revisiting-a-major-methane-study/
http://www.agu.org/pubs/crossref/pip/2012JD018487.shtml
http://blogs.cfr.org/levi/2013/03/06/one-more-round-in-the-methane-debate/
http://blogs.cfr.org/levi/files/2013/03/JGRResponse-Accepted.pdfFurther, Colorado wasn't a great area to examine emissions from shale gas production because there was virtually no shale gas production in Colorado at the time. What they were exploiting is tight gas, which is treated significantly differently from an operational perspective. Tight gas wells tend to flow at much lower rates and, therefore, operators would often just vent the methane to the atmosphere after fracking the well (small fracks, mind you, very different than fracking shale). This, of course, could lead to higher emissions, but is no reason to condemn shale gas (though is a reason to criticize tight gas development).
That's just the science behind the Colorado study. What about policy and regulations? The NOAA took its measurements in 2008. Why is this relevant? Because in 2009, the state introduced new regulations to crack down on methane emissions (going after that venting problem with tight gas). Since then, the state has made the regulations even tighter, calling for major improvements like mandatory green completions (all gas flowback must be captured into a pipeline instead of being vented or flared) and requiring all high-bleed valves on a well to be replaced by low-bleed valves. These regulations should serve as a model for the country (frankly, they're fantastic).
http://www.nytimes.com/2013/11/19/us/colorado-governor-proposes-strict-limits-on-greenhouse-gas-leaks-from-drilling.html
The Utah study I'm less familiar with, though probably would also be a tight gas operation and not shale gas. Utah's regulations on emissions are very poor and it isn't a big producer of natural gas to begin with (nor will it likely be one in the future), so it might not be very representative either.
As for the UT (2013) study, what it represents is tightly controlled shale-gas operations. Are all shale-gas operations like this? Maybe not, but many are. Most importantly, new regulations from the EPA are going to make green completions for shale-gas operations mandatory across the country (i.e. no venting and no flaring starting January 2015), which will probably make the UT (2013) study representative of almost all shale gas operations in the future.
http://www.epa.gov/airquality/oilandgas/pdfs/20120417changes.pdf
Of course, like you point out, emissions to do with oil development still have to be tackled (an absolute waste of energy to flare or vent that gas). The EPA's upcoming regulations won't apply to this, although it would be nice if they did. Then there are emissions from transmission and distribution, which are getting the study they deserve if we're to know how much of a problem they could really be.
Overall, alot of the emission problem from the upstream side of the industry is easily manageable, with some government bodies already addressing it. That's not to say everything is rosy (it isn't), but it doesn't mean natural gas has been written off as a valuable tool in the fight against global warming. With some work, it'd be a good tool as long as we remember it's a bridge and we bring production down in the long term.
-
gryffydd at 10:36 AM on 3 January 2014Sea Ice Volume is Not Recovering
@DavidBird, I understand what you are saying. The rounded edges of the volumes might also be contributing to the minimising effect. This is the unfortunate effect of working with 'cool' graphics.
Regardless of the graphics, 30% reduction in sea ice volume would have to be a signifigant cause for concern, because once the ice is gone, what is going to be absorbing the heat? It takes 334 joules of heat energy are needed to melt 1 gram of ice, but only 4.18 joules of heat energy to warm 1 gram of water by one degree.
Scary thought of the week? -
gws at 10:19 AM on 3 January 2014Methane emissions from oil & gas development
RH: all chapters are made available online by the IPCC here
http://www.ipcc.ch/report/ar5/wg1/#.UsYAr_vDswI
so we can discuss the contents.
Russ, the associate IPCC text is
"Because at the time the scenarios were developed (e.g., the SRES scenarios were developed in 2000), it was thought that past trends would continue, the scenarios used and the resulting model projections assumed in FAR through AR4 all show larger increasesthan those observed (Figure 1.6)."
Your graph is an adaptation of the actual IPCC graph, not the actual graph. Did you make it yourself, or where is it from?
-
gws at 10:08 AM on 3 January 2014Methane emissions from oil & gas development
Thanks Russ.
RE "predicted": that is the wording you used in your first post above, "predicted by climate modelers".
And yes, total global emissions have likely been lower than expected in earlier assement reports. If you follow the literature, there is a lively discussion since approx. 15 years on the reasons for the mixing ratio plateau reached roughly 10 years ago. It is now thought to be due to a new equilibrium having been reached (sources equal sinks). The renewed increase suggests that this equilibrium is no longer present, meaning sources outweigh sinks again.
-
Russ R. at 09:49 AM on 3 January 2014Methane emissions from oil & gas development
[-snip-]
And thank you, but I never suggested that models "predict" emissions. The chart is of concentrations, not emissions.
But the persistent difference between the projections and observations implies that either A) methane emissions have been significantly less than expected, B) methane's half-life in the atmosphere is significantly shorter than expected, or C) both.
Moderator Response:[RH] Deleted link to report stating "Do not cite, quote or distribute."
Russ... The very first page of that link clearly states: "A report accepted by Working Group I of the IPCC but not approved in detail."
-
gws at 09:22 AM on 3 January 2014Methane emissions from oil & gas development
Russ, could you please tell us where that graph is from? The timeline is odd.
Climate modelers do not "predict" methane emissions. They use the data assembled in the emissions projections, such as the RCPs used in AR5.
-
Russ R. at 08:33 AM on 3 January 2014Methane emissions from oil & gas development
While atmospheric methane levels are indeed several times higher than pre-industrial levels, the observed rate of increase has been substantially less than predicted by climate modelers.
Moderator Response:[RH] Deleted image from report stating "Do not cite, quote or distribute."
-
hank at 07:14 AM on 3 January 2014Still Going Down the Up Escalator
Is there a version of the escalator animated GIF that lays the uncertainty over the trend lines? (The uncertainty, or confidence limits, or probability, however you call it, the 'gray cloud' that the trend line represents overly precisely in the graph.
That would be a fat fuzzy line for the 7-year trend, with fewer data points (fewer data points; maybe different variability in each 7-year sample?) compared to a svelte fuzzy line for the long time trend, calculated with more data points and the overall variability).
-
One Planet Only Forever at 05:09 AM on 3 January 20142013 SkS Weekly News Roundup #52
Tom Curtis @ 7
The global socioeconomic-political system is the problem. The ‘competition’ for things that everyone cannot have encourages the development of attitudes of greed and intolerance. And when the greedy and the intolerant ‘succeed at any of the many unacceptable things they will try to get away with’, significant damage is produced with many others suffering the consequences.
Popularity of illegitimate beliefs and attitudes can easily be created. The burning fossil fuels illegitimately developing into such a large part of ‘the way people believe they can get away with obtaining personal benefit’ has created a large pool of easily impressed people.
Money obtained from illegitimate activities can be abused to create popular support among the easily impressed for the unjustified and illegitimate activities. That ‘illegitimate popularity’ is then claimed to be a justification for all manner of illegitimate activity. Expansions of fossil fuel burning are ‘justified’ by claims that the damages created today and risks to the future are ‘worth it’. The ridiculous evaluations go like this:
- The current people wanting to benefit from an unsustainable and damaging activity (like burning fossil fuels), evaluate what they believe ‘would not be gained by them if they were not allowed to do the unsustainable and damaging activity’
- They also evaluate what they believe to be the ‘costs of the damage of their desired unsustainable activity’. They will even go further and claim that any future cost is less important than a current day cost. And they will exclude any ‘cost they have no method to evaluate (or no interest in evaluating)’.
- They then justify doing the unsustainable and damaging activity by claiming their inflated personal benefits are worth the discounted and diminished costs faced by others.
The global leaders are simply pursuing popular support, regardless of how illegitimate and unsustainable and damaging that is.
The real problem is the socioeconomic system that ‘continues to be popular’ and the type of leaders who succeed. The more people there are who only care about what they can get for themselves, the more difficult it is for a sustainable better future for all life on this amazing planet to be developed by concerned, caring and considerate people (they cannot get the required leadership actions).
The burning of fossil fuels is not the only unacceptable activity keeping humanity from developing a sustainable better future for all. However, it is one of the clearest examples of ‘how wrong’ the socioeconomic systems are that encourage people to ‘compete to get the most benefit for themselves as quick as possible any way they can get away with’. The popularity of greed (and its partner in political crime, intolerance), is the real problem. A sustainable better future for all will never develop as long as the greedy and intolerant can ‘succeed’.
p.s. The link between greed and intolerance is simple. The greedy will do whatever they can get away with to get more for themselves. If they can get political power by partnering with the intolerant, they are willing to give the intolerant what they want because it ‘costs them nothing to do so’. The intolerant will partner with the greedy because they do not care how their intolerant attitudes are supported, and they will even contribute money to the promotion of a political party
-
Bob Loblaw at 02:57 AM on 3 January 2014More misleading Congressional climate testimony
Just to elaborate a bit on Dikran's second paragraph about selecting a null hypthesis:
The statistical test used to determine significance requires comparing the observed trend to the expected trend - specifically, you calculate the difference between the two, and compare that to the uncertainty of the observed trend.
When you use common english and say "the planet is warming", you are making an implicit comparison with "temperature is not changing", which is Dikran's "no warming" scenario. In such a case the "expected" value is zero.
When you use common english and say "the warming has paused", you are making an implicit comparison between the current trend and some past trend that was clearly not zero ("warming"). Thus, the expected value is that past trend. (Dikran suggests the IPCC projecton of 0.2C/decade, which is entirely appropriate if you want to claim that the observed data disproves the IPCC projection).
Howeverly politely Dikran describes Christy's behaviour, I personally think that Christy (and Roger Pielke Sr., who has made similar claims here at SkS) know and understand this. In British parliamentary tradition you are not supposed to call someone a lair, but I think you are allowed to say that they are deliberately misleading.
-
Dikran Marsupial at 22:45 PM on 2 January 2014More misleading Congressional climate testimony
Barry, the UAH measurements do contradict Christy's statement "As the global temperature failed to warm over the past 15 years...", so I think Dana's comment is essentially O.K. from a statistical point of view as he does not appear to be claiming that these measurements in isolation establish that there has been warming, merely that the data do not agree with Christy's statement, which is not the same thing, and a much weaker claim. While the confidence interval (and the corresponding credible interval from an equivalent Bayesian analysis) contains zero, the bulk of the confidence interval is clearly above zero which suggests that the UAH data do provide evidence that it is more likely that the planet has been warming than not, just not enough to effectively rule out the possibility that it hasn't been warming. This means that the UAH data suggest (fairly strongly, but not conclusively) that Christy's statement is incorrect.
Sadly frequentist statistics is fundamentally unable to assign a (non-trivial) probability to the truth of a particular hypothesis (as it is either true or false and has no long run frequency). Unfortunately this is what we actually want, and as a result frequentist hypothesis tests are rather counter-intuitive and easily misinterpreted.
Frequentist hypothesis tests however do provide a useful sanity check against getting carried away with ones' theories. We first set up a null hypothesis that expresses what we do not want to be true, and only proceed with our theory if the data are sufficiently unlikely to have been observed if the null hypothesis is true. Christy is not using hypothesis tests in this manner as he is using a null hypothesis (no warming) that agrees with his position, and hence it fails as even a sanity check. Christy should instead be using the IPCC projection of 0.2 degrees per decade as his null hypothesis and see if that can be rejected (it can't) before claiming that there has been no warming. Sadly if you fail to perform sanity checks, you run the risk of making public statements that are incorrect.
Now from the "warmist" perspective, the standard "zero trend" is a reasonable null hypothesis, and indeed, we should not claim warming based solely on the observed trend, unless it is statistically significant. However the "based solely on the observed trend" is quite important here, as the observed trend is not the only evidence we have that the planet is warming. There is also physics, measurements of ocean heat content and measurements of factors inducing internal variability, such as ENSO. If we take these things into account (e.g. Foster and Rahmstorf) the trend is statistically significant. These suggest that the planet is still warming, but redistribution of heat means that this has been less apparent in near surface temperatures than we would normall expect.
-
michael sweet at 12:35 PM on 2 January 20142013 SkS Weekly News Roundup #52
The problem with geoengineering is that it is likely to cause severe drought somewhere even if it reduces temperature. Who will get the cooler temperature and who will get the drought? We will have to rely on climate models to predict who will get what. Who trusts climate models that much? For example, if China gets drought and the USA gets cooler temperatures should we block the sun? What do the Chinese think about that? What if the USA gets the drought and China gets the lower temperatures? Climate will not necessairly be better, even if it is cooler, if major farmng regions are hit with drought.
It seems to me that whoever gets something they don't like will be angry and want to stop the geoengineering. Someone (everyone?) will be angry. There is also the question of cost of geoengineering forever, where the energy to do the geoengineering comes from, and if the geoengineering is ever stopped for even a short time temperatures will jump.
Perhaps geoengineering is not a life raft but a life preserver. Who wants to swim across the Atlantic?
-
wili at 10:45 AM on 2 January 20142013 in Review: a Productive Year for Skeptical Science
"We've got a couple posts coming up on Sherwood's paper."
When you do, you might want to include this brief, clear explanatory video featuring Sherwood himself:
Moderator Response:[PS] Fixed link
-
sailrick at 10:36 AM on 2 January 20142013 SkS Weekly News Roundup #51B
The link for the aricle on the Great Barrier Reef leads back here, instead of to the article at the Guardian
Moderator Response:[JH] Link fixed. Thank you for bringing this to our attention.
-
dana1981 at 10:24 AM on 2 January 20142013 in Review: a Productive Year for Skeptical Science
We've got a couple posts coming up on Sherwood's paper.
-
Tom Curtis at 09:36 AM on 2 January 20142013 SkS Weekly News Roundup #52
One Planet Only Forever @6, eloquently stated. It also, I believe ignores other aspects of the problem with geoengineering by reducing sunlight. Consequently I agree with you that mitigation is the best strategy at the moment.
Never-the-less, as world governments continue to dawdle in tackling climate change, they push up the costs of mitigation. Therefore continued dawdling may well push us into a situation where we must choose between pure, unmitigated climate change of +4 C or more, or reduction of CO2 emissions and concentration and reduction in insolation as a bridging method to avoid the worst consequences of global warming. That is, we may be forced to choose the least worst of two ills.
We are in the situation of the Titanic. If the captain does not turn and slow the ship soon, we may well be happy of the existence of life boats in the form of geoengineering, without in any way implying that life boats are a preffered method of crossing the Atlantic.
-
One Planet Only Forever at 08:39 AM on 2 January 20142013 SkS Weekly News Roundup #52
I will attempt to clarify the issue of why artificially blocking sunlight is an unacceptable option for addressing the current and imminent challenge caused by increasing CO2 emissions.
The first statement in the article that needs to be understood is:
“If you make the atmosphere warmer, but keep the sunlight the same, evaporation increases by 2% per degree of warming. If you keep the atmosphere the same, but increase the levels of sunlight, evaporation increases by 3% per degree of warming.”
This highlights that evaporation changes would occur from a ‘geo-engineered solution’. The following statement from later in the article highlights the risks of messing with the evaporation.
“To change the pattern and degree of evaporation would inevitably disturb weather systems and disrupt agriculture, with unpredictable and potentially catastrophic consequences.”
So it may be possible to change things in a way that is speculated to ‘control the surface temperature’ but there would be added risk of increased uncertainty of evaporation and resulting weather patterns.
A related issue is the way some people only look at regional ‘longer growing seasons’ from global warming and claim a ‘benefit’ is being obtained. However, as the temperature increases the added uncertainty of predicting the likely weather, and precipitation patterns, for the upcoming growing season in any location would negate any potential benefits of an extended growing season. The added risk of damage from more likely extreme weather events further reduces the potential benefit.
Of course another reason not to attempt to geo-engineer a ‘solution’ is the simple fact that an absolute understanding of every interaction and consequence of the human imposed alteration would need to be in place before ‘beginning to experiment’ with things. There is certainly ‘no time’ to develop the required understanding to allow such ‘ambitious and potentially damaging activities’ to be started.
-
wili at 08:03 AM on 2 January 20142013 SkS Weekly News Roundup #52
Here's a link to an abstract for the article in Nature:
http://www.nature.com/nature/journal/v505/n7481/full/nature12829.html
"Spread in model climate sensitivity traced to atmospheric convective mixing" by Steven C. Sherwood,Sandrine Bony & Jean-Louis Dufresne
And here's a link to a short video with discussion by one of the authors (Sherwood) of the article linked above:
http://climatestate.com/2013/12/31/planet-likely-to-warm-by-4c-by-2100-scientists-warn/
As I understand it, this study pretty much does away with all the models that predict global warming sensitivity at anything less than 3 degrees C for every doubling of atmospheric CO2.
So what's left are the models that show warming of between 3 and about 5 degrees C for every doubling. And it is sure looking like we are heading to at least a doubling by century's end if not much sooner (especially with carbon feedbacks kicking in and carbon sinks about to turn into sources...).
Basically, all those low-balling models had an unrealistic circulatory mechanism behind their models and so can be ruled out.
This is pretty damn big new, folks, if it's right. Worthy of a main post here, perhaps??
Moderator Response:[JH] Links activated.
-
More misleading Congressional climate testimony
barry - In light of the (frequent) denier claims that there has been no warming in the last 15-16 years, only occasionally qualified by "no statistical" warming - pointing out that there has indeed been warming at nearly statistical significance is entirely appropriate.
I had a conversation with someone on JoNova regarding this - they asked "...what if 2-3 years more data show cooling?". I replied that I would be very happy about it. But given that the 15 year record showed warming, that 2-3 more years would likely show statistically significant warming, and that the underlying physics hadn't changed, their hypothetical would require massive drops in temperature to produce a downward trend. Something on the line of the McLean nonsense; which I considered rather unlikely...
"No statistically significant warming" does not mean "no warming", and false 'skeptic' arguments based on semantic ambiguity should be pointed out.
-
StBarnabas at 00:29 AM on 2 January 20142013 in Review: a Productive Year for Skeptical Science
Dana
thanks for this. And to Chriskoz for the link. There is also a Guardian article on Sherwood's paper on P9 of today's paper (1/1/14) Here is a link to the online version
http://www.theguardian.com/environment/2013/dec/31/planet-will-warm-4c-2100-climate
Moderator Response:[JH] Link activated.
-
garethman at 23:11 PM on 1 January 2014Provisional Statement on Status of Climate in 2013
Rocketman @ 10. The reason for my posting is that I was impressed by the discussion over on 'And then there is Physics' regarding communication. When I discuss why science is so confident about climate science or why the climate is still warming despite the oft qouted slowdown, their eyes start to glaze over if I get into too much detail. I wondered whether we could express a truth in shorter soundbites which are logical but convey a complex message. We know people understand complex subjects when being given information in small chunks. Hence the idea that if there are only 3 options and two are excluded, there is a fair chance the third is the correct information. A small, uncomplex chunk of information which may be useful. By the the way with regard to trend, the one I think that is important at present is the one you have refferred to regarding anomolous warming over the last 100 years.
-
chriskoz at 18:15 PM on 1 January 20142013 in Review: a Productive Year for Skeptical Science
Doug@3,
A new study (via Mike Mann's facebook) :
Climate: Cloud Mixing Means Extra Global Warming
is another nail into the coffin of "Iris hypothesis" by Dick Lindzen. Clouds, if anything, may amplify the forcing of GHG such as H20. And that's consistent with generally higher CS value deduced from paleo record rather than from direct observations. How much more evidence is needed before we finally put to bed Lindzen's sticky idea? Incredible.
-
barry1487 at 17:50 PM on 1 January 2014More misleading Congressional climate testimony
Tom,
Thanks again for the reply.
Rounding is not what I take issue with. Maybe I'm not making my point clearly enough. I quote Tamino in case that helps.
...there’s not enough data in 16 years to tell for sure, statistically speaking, which way [the trend is] going. That always happens — always — when the time span is short.
If the uncertainty estimate is larger than the trend over the 15 years, then no definitive value or even sign for that trend can be claimed - by anyone. Dana compounds Christy's error on this point. Pointing to the mean estimate doesn't mitigate this, and we would instruct a contrarian on statistical significance if they did the same.
I believe the accuracy of the argument could be improved without undercutting it's effectiveness. KR's reference to Tamino's 'Fifteen' post lights one possible way.
-
dana1981 at 17:40 PM on 1 January 20142013 in Review: a Productive Year for Skeptical Science
BC @4 - I don't know where they get 57% from. The IPCC report did say the mythical 'pause' is due to about half changes in external forcings and about half due to internal variability. My sense was that they were just being very non-specific and saying 'about half and half' because they didn't have the confidence to be any more precise than that. Personally I think that recent research (including several studies discussed in the above post, published after the IPCC AR5 cutoff date) make a strong case that internal variability (ocean cycles) are responsible for more of the slowdown in surface warming than changes in external forcings, but there's not a consensus about that yet.
-
2013 in Review: a Productive Year for Skeptical Science
Congratulations to SKS on their achievements in 2013. Amongst much else I have appreciated the weekly news summary from John Hartz.
I'm interested in any comments about the following. In this posting there's the following statement - "External factors, like decreased solar and increased volcanic activity, have also played a role in the slowed surface warming, but internal variability due to ocean cycles appears to be the main culprit."
However in John's recent weekly news (28 Dec) the 3rd article (Climate change 2013: Where we are now - not what you think) contained - "The new IPCC report tells us that half of warming (57%) that should have already occurred has been masked by aerosols mostly emitted since the turn of the century in rapidly developing Asian nations (yes, warming would double if cooling smog pollutants were suddenly cleaned up in Asia)."
-
Tom Curtis at 15:14 PM on 1 January 2014More misleading Congressional climate testimony
Barry @22, clarrifying my inaccurate reading above, and as Kevin C points out @9 above, the article refers to the total warming over 15 years, not the 10 year trend over the last 15 years. Thus the 0.21 C/15 years is equivalent to 0.14 C/decade which is the correct value rounded to two significant figures. Consequently the trade off between effective communication and accuracy largely reduces to the appropriateness of the rounding, and of not quoteing error margins.
Note that whatever our view on this, if we have an issue with SkS's practise in this article, we must have a greater issue with Christy's comments before congress. Christy's "global temperature failed to warm over the past 15 years" equates to citing a trend of 0.0 C/decade with no error margin. That is, he rounded the (presumably) 1998-2012 rate to the nearest whole number and dropped the error margins. If you have a problem with SkS rounding to the nearest hundredth, you must think Christy's claims outrageous. Indeed, not a single error margin is to be found in his entire presentation.
On the matter of accuracy and effectiveness, however, the key points is that your communication must not mislead; and that must be part of a series of communications that invites people to find out more. Thus, in the case above, the 15 year trend without error margins is mentioned, but there is also a link to the SkS trend calculator so that those interested can find the full information, including error margins. Again this contrasts with Christy, who at several points in his talk refers to data that has not been published in peer reviewed papers, and which he does not provide sufficient background information for the data to be recreated.
There is a minor problem, however, with the SkS figure IMO. In calculating it, it appears as though they have first rounded the trend, then multiplied it out to 15 years. Had they reversed the procedure, they would have got a more accurate 0.2 C over 15 years (0.2025 without rounding).
-
barry1487 at 13:32 PM on 1 January 2014More misleading Congressional climate testimony
Tom, KR,
Christie's claim that the globe has failed to warm over the last 15 years is false.
But the SkS claim that UAH TLT data show a definitive warming of 0.21C - or indeed by any amount - over the last 15 years is not correct either. There is a statistical possibility the trend is zero, whichever start/end dates are chosen. (I am by no means trying to argue that there has been a 'pause' in global temperatures)
That one sentence in the article sticks out for someone who has followed the 'debate' closely for years. A trend value absent uncertainty estimates is a red flag as Tamino and others have noted. But perhaps I'm stepping on the troubled nexus between effective communication and scientific accuracy (assuming my points have merit).
-
Doug Hutcheson at 12:56 PM on 1 January 20142013 in Review: a Productive Year for Skeptical Science
"The cloud feedback question is one of the largest remaining uncertainties in future climate predictions, so this is an important new paper. Unfortunately it finds that clouds will act to amplify global warming, suggesting that the planet will warm at least 3°C in response to a doubling of atmospheric carbon dioxide, which also suggests at least 4°C global surface warming by 2100 if we continue with business as usual policies."
There goes another favourite meme of the denialisti, that clouds will cool the planet (not that I wish to appear to be celebrating bad news). Ironic that BAU will result in such a change in the environment that big business will become no more than a despised memory. 4°C is nothing to look forward to, but that's where we are tracking. Homo Stupidus stupidus.
-
chriskoz at 09:38 AM on 1 January 2014Provisional Statement on Status of Climate in 2013
grindupBaker@9,
I share your opinion how the aparent GW "pause" matters. It is the best response to garethman@1 question.
Let us remember that IPCC AR5 have lowered the bounds of equilibrium climate censitivity from 2K to 1.5K based on that. IMO, they did not have grounds to this adjustment, because the surface temp "pause" have been explained by multiple lines of evidence: e.g. current ElNino/LaNina cycles, deep ocean heat uptake and lately by CW2013 hybrid temps adjustment.
Needless to say, giving so much importance to the tiny fraction (3%) of the overall heat data towards the global climate sensitivity is not smart science, but they (IPCC) nevertheless did it in AR5. I've been saying for two years already, that we should switch to ocean heat content as the primary measure of climate change because it constitutes the most (90%) of it and we now measure can it. The other important measure, IPCC should consider in their ECS estimation is the paleo data. And that data consitently points ECS to be 3K or higher and no bias have been discovered in it since AR4. Therefore AR5 had no grounds to lower their ECS.
-
dana1981 at 09:34 AM on 1 January 20142013 in Review: a Productive Year for Skeptical Science
Thanks Dawei!
-
Dawei at 09:27 AM on 1 January 20142013 in Review: a Productive Year for Skeptical Science
Great summary Dana. To you and everyone else on the team, great work, everything you guys put out gets more and more impressive. The level of intellectual sophistication and creativity in the way it's communicated just keeps improving.
By the way can you add the link to Nuccitelli et al. (2012)? I don't remember which one that was.
-
More misleading Congressional climate testimony
Tom Curtis - Agreed and agreed, the '15 years' bandied about by deniers is just nonsense. There is a good discussion by Tamino entitled Fifteen, showing how that period is well above the longer term mean - that slower increases have not yet dropped the temperatures as far below the long term trend as 1998 pushed them above. As to dates, I'm not certain when the most recent UAH data was made available, relative to the testimony and the OP.
Christy has an ongoing history of presenting flat graphs that are irrelevant, too short for significance (15 years, tornados, etc), un-normalized for observation history (max temp records, disasters), cherry-picked (Sierra or winter-only snowfalls ignoring continental yearly data), grossly manipulated (UAH to HadCRUT comparisons [mis]using a single extrema point for a baseline), etc., and attempting to use them as misleading rhetorical arguments against the existence of global warming. His Congressional testimony is just more of the same.
-
Tom Curtis at 08:11 AM on 1 January 2014More misleading Congressional climate testimony
KR, the OP was published on Dec 26th, 2013 with reference to testimony by John Christy on Dec 11th 2013. A claim by Christy made at that date is innaccurate if it refers to any period other than Dec 1998 to Nov 2013, or if he had not yet published the Nov 2013 temperatures, Nov 1998 to Oct 2013 (again 0.135 C/decade). If he instead relied on the trend of annual data from Jan 1998 to Dec 2012, he did so knowing that his own data now showed something quite different.
Even if we pretend its OK to use obsolete data in testifying to Congress when you know the up to date data shows something different, we still face the simple fact, well stated by babazoroni:
"The 'pause' is easily shown to be a sham, by noting that it starts well above the the trend line. The long term temp trend also increases when the pause is included Why aren't these facts stated every time someone claims there has been a pause? I've only seen Gavin Schmidt note this, here: http://www.realclimate.org/index.php/archives/2012/11/short-term-trends-another-proxy-fight/"
(Link made live)
Every scientist knows about regression to the mean. Therefore every scientist knows that choosing a start date for a trend that lies well above the trend to that point will produce a trend less than the long term trend. Therefore Christy knows that choosing a 15 year trend up to mid 2013, and a 16 year trend now misrepresents the science. And to illustrate babazaroni's point:
UAH trend to Dec 1997: 0.044 +/- 0.161 C/decade
UAH trend from Jan 1998 to Nov 2013*: 0.059 +/- 0.226 C/decade
UAH trend to Nov 2013*: 0.138 +/- 0.07 C/decade
* trend calculated on SkS trend calculator, best estimate of terminal month
-
Rob Painting at 08:00 AM on 1 January 2014More misleading Congressional climate testimony
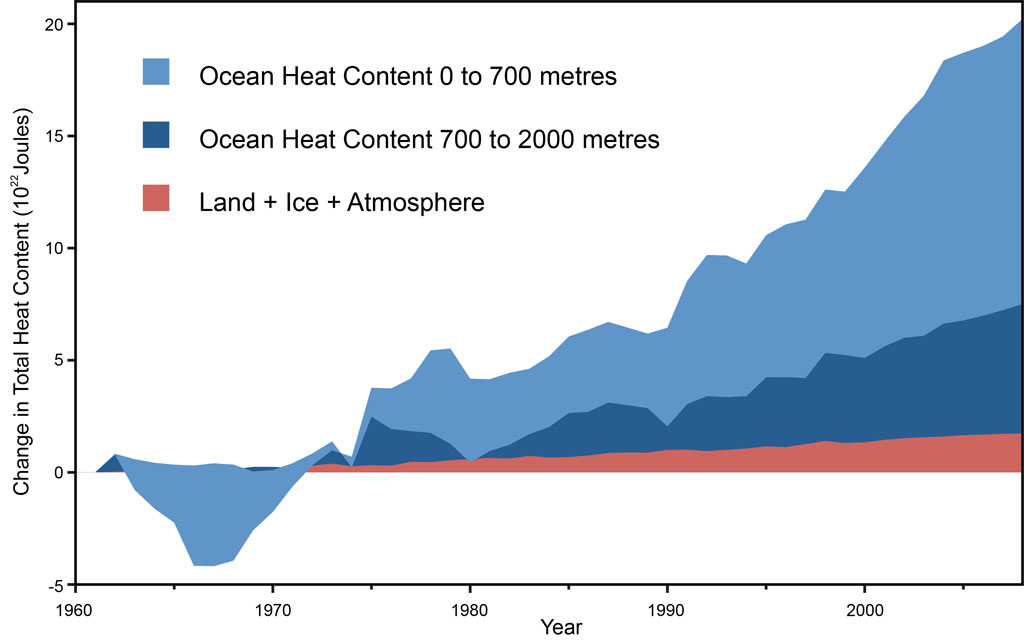
So, John Christy conveniently neglects to mention the oceans - where 93.4% of global warming has been accumulating in the last several decades.
I wonder why?
-
More misleading Congressional climate testimony
Barry - Unfortunately, "15 years" is a bit vague; I would be reluctant to say yea or nay on a particular figure without knowing the exact beginning and end points of that trend calculation. I don't know how when, for example, this post was initially written, just when it was published, and that may make a difference.
Regardless - the UAH data shows an upward (albeit not statistically significant) trend over 1998-2013, and hence Christy's claim that "As the global temperature failed to warm over the past 15 years..." is demonstrably false.
-
barry1487 at 06:32 AM on 1 January 2014More misleading Congressional climate testimony
Thanks for the replies.
KR - you and I are making the same point. It was this statement from the article caught my attention.
"Their data set estimates the warming of the lowest layer of the Earth's atmosphere at 0.21°C over the past 15 years"
I would hesitate to describe that as 'making noise about noise', but it is odd to see a definitive trend value given at SkS when the uncertainty is greater than the trend. Seems out of place in an otherwise reasonable article.
-
rocketman at 05:40 AM on 1 January 2014Provisional Statement on Status of Climate in 2013
@garethman You are right that the climate is not cooling or staying the same, but you are wrong when you say there is no long term trend. We know with high confidence from paleoclimate research that from about 5000 years Before Present up until 100 BP that the global average temperature was slowly but steadily falling. Over that 4900 year period it fell about 0.7°C - not in a perfectly straight line of course, but probably never more than +/- 0.2°C away from it. Now, in the last 100 years or so the global average temperatue has suddenly risen by about 0.7°C. That is the other point regarding your up-down-sideways comment. There are infinitely more than three options. It could be going down slowly at a rate of 0.7°C per 5000 years or up suddenly at a rate of 0.7°C per 100 years.
Since it is not entirely clear (to me at least) what point you are trying to make, I will add that the above mentioned sudden rise in global average temperature was quantitatively predicted as early as 1938 on the basis of human emissions of CO2.
-
grindupBaker at 05:29 AM on 1 January 2014Provisional Statement on Status of Climate in 2013
garethman #5 Yes on the soft science of "explanation" but it's the Climate Sensitivity that's up for grabs if one pushes aside the large eclectic mix of babble. Needs many more thermometers in the oceans to reduce the interpolation needed because that can be an accurate measure of warming from year to year. The MST gets pushed around the planet a lot because of innumerable vagaries. It's more of a symptom than a prime indicator (of course, it's the symptoms that get discussed).
Prev 787 788 789 790 791 792 793 794 795 796 797 798 799 800 801 802 Next


