


 Arguments


Recent Comments
Prev 865 866 867 868 869 870 871 872 873 874 875 876 877 878 879 880 Next
Comments 43601 to 43650:
-
Composer99 at 06:00 AM on 17 July 2013Trenberth on Tracking Earth’s energy: A key to climate variability and change
This is practically impossible with CO2 molecules. CO2 molecules at STP are in the ground state - where do they get the energy to radiate? Your claim that they do is purely and simply due to external stimulation. CO2 is simply an agent, a receptor if you like, for radiation generated elswhere it then will obviously participate in transitions as it seeks to return to its groundstate. You confuse scattering, which involves re-transmission of a proportion of incident energy with spontaneous emission - which again cannot happen.
What parts of CO2 absorbs longwave IR from the Earth surface (or from radiating molecules elsewhere in the atmosphere) and CO2 molecules receive thermal energy from collisions with other molecules in the atmosphere are you having trouble understanding? Certainly these seem to qualify as "external stimulation" allowing CO2 molecules the opportunity to "get the energy to radiate".
Seriously, absorption and emission of longwave IR by greenhouse gases is observed & measured (as per graphs & sources provided in comments responding to you). Insofar as there is any actual contradiction between your claim (as quoted in this comment) and what is observed, you are putting readers into the position of having to accept one of the following:
- Observed and measured phenomena, consistent with known radiative physics, are false.
- old sage's claims are false
I put it to you that the choice is obvious (and unfavourable to you).
-
KR at 05:38 AM on 17 July 2013Trenberth on Tracking Earth’s energy: A key to climate variability and change
old sage - What I have been discussing is thermal radiation, observed in all matter at a temperature greater than absolute zero - where kinetic energies cause dipole oscillations and accelerated charges, and result in photon emission.
A significant percentage of CO2 at standard temperature and pressure is indeed above ground state, and radiating, as can be shown with IR spectroscopy. And that energy could come from incoming IR at CO2 absorption wavelengths or perhaps from a heated wire - spontaneous thermal emission, not scattering. The emission spectra is dependent on gas temperature, not on any incoming IR.
Again, your physics claims regarding thermal emission from gases are simply nonsense, contradicted by hundreds of years of both theory and observations.
-
Composer99 at 05:38 AM on 17 July 2013CO2 effect is saturated
Stealth:
Appeals to personal qualifications and arguments from incredulity such as on display in #236 and #238 are not terribly convincing.
All this:
Being a software modeler myself (for 30+ years) dealing with RF energy through atmosphere, I understand that what is measured in the lab, what is model in software, and what the real world does are almost always very different. The real world is so noisy and chaotic that I have found models are almost useless in predicting what will really happen in the real world. I would be stunned if this is not also true for this forcing equation, and GCMs in general.
Trying to measure this value for the real world, on average, is probably impossible given that the atmosphere is so different moment to moment and place to place, and changes in long term trends may be hard to determine since we have so little empirical measurement data.
I admit it *might be* correct, but I cannot prove or disprove it, nor can anyone else. This isn’t meant as a criticism of experts in this field, only a realization of my experience that the atmosphere is impossible to model accurately. [Emphasis mine.]
Your assertion that this is basic physics and models match the real world simply cannot be true. I understand physics (I have a physics degree) and I build software models for living (I also have a computer science degree) so I think I am qualified to speak to models and physics.
The climate is not that simple – far from it – so my assertion of uncertainty is, I believe, completely accurate and true.
strikes me as practically equivalent to:
I know what I'm talking about, trust me & not the data.
I don't believe this is true, therefore it is not true.
although I am sure it was not your intent to communicate such sentiments.
(I have highlighted in the quotes from your comments the three words that are often the butt of jokes on medical blogs: "in my experience" or variants there of are sometimes called "the most dangerous words in medicine". I see no reason why this maxim should not generally be applicable to other scientific domains, particularly when the person asserting it is arguing against the weight of evidence, as you are.)
-
KR at 05:17 AM on 17 July 2013CO2 effect is saturated
Stealth - Perhaps you should re-read just what you have quoted:
...net energy balance... This uncertainty is an order of magnitude larger than the changes to the net surface fluxes associated with increasing greenhouse gases in the atmosphere.
Since what we are discussing WRT Myhre 1998 are radiative transfer codes, and the change in forcings due to changes in atmospheric composition, we are indeed speaking of the 'net surface fluxes' which have far lower uncertainties. You seem to be conflating uncertainties in accounting for multiple energy flows into a total budget with uncertainties in computing atmospheric spectral response - applying an entire collection of uncertainties to a tiny portion of the puzzle.
If you wish to discuss the total energy budget, the sum of individual components (and their uncertainties) of the energy budget, there is an appropriate thread. However, the radiative transfer codes are well proven, giving results within under 1% of observations (Chen et al 2007) including dealing with compositional changes - arguing any significant uncertainties in that regard (as you have) is quite frankly unsupportable.
-
old sage at 05:13 AM on 17 July 2013Trenberth on Tracking Earth’s energy: A key to climate variability and change
I've made the physics as clear as a pike staff. The reason a solid emits as a black body is because the coming together of nuclei in close proximity forces the outer electronic bands so close together that they form a continuum of energy levels. Co-operative movements due to thermal oscillation means that lattice waves involving many nuclei, phonons if you will, in collision have sufficient energy to cause photon energy level transitions in the electron bands. It all goes on at the boundary layer as i/r cannot penetrate a solid for more than a skin effect depth so i/r cannot emerge from anything other than the skin.
This is practically impossible with CO2 molecules. CO2 molecules at STP are in the ground state - where do they get the energy to radiate? Your claim that they do is purely and simply due to external stimulation. CO2 is simply an agent, a receptor if you like, for radiation generated elswhere it then will obviously participate in transitions as it seeks to return to its groundstate. You confuse scattering, which involves re-transmission of a proportion of incident energy with spontaneous emission - which again cannot happen. Get your text book out.
I could also explain to you how phonon waves at very low temperature cause electrons to attract each other in pairs over very large distances (compared with the atomic diameter) but if you don't understand the above, you certainly wont understand that!
MA Roger - I just assumed stefans law with T 300 radiating to a body at 0K. -
MA Rodger at 04:54 AM on 17 July 2013The anthropogenic global warming rate: Is it steady for the last 100 years? Part 2.
KK Tunk @192.
I think this dialogue would benefit from my restating of the question @188. If you feel that you have answered this question adequately @190 & @192 then do say (although I would be surprised if this were so).
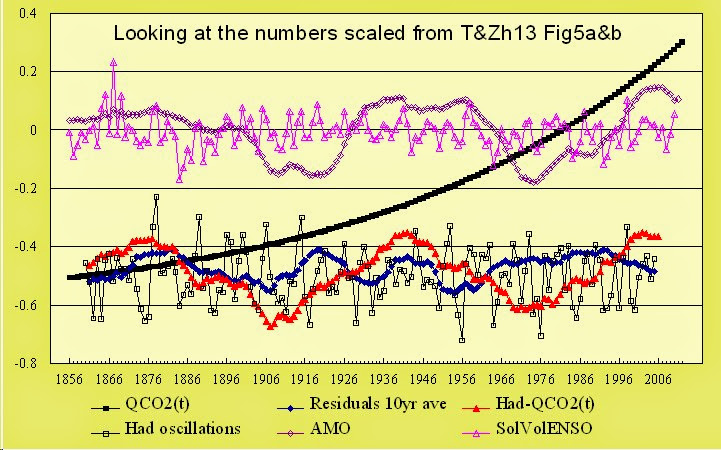
I here introduce a graph below showing the data from Tung&Zhou2013 Figs 5A&B. It presents quite a few questions but I will kick off here by asking about the wobbles in the blue trace.
The blue trace is the 10-year rolling average of residuals from the MLR obtained by subtracting the QCO2(t) function (introduced in your first SkS post) from the data presented in Fig 5B, and obviously re-based for clarity's sake. According to Zhou &Tung 2013 which covers your MLR analysis more fully than T&Zh13 "The residual ... should only consist of climate noise if the MLR is successful..." This conforms to my understanding of it.
Yet the blue trace showing the residuals from the MLR analysis in Tung&Zhou2013 shows a lot more than "noise." There are distinct wobbles and these are not small wobbles being 43% that of the original HadCRUT4 wobbles (red trace). The residuals thus contain a very significant part of the HadCRUT4 signal which the MLR analysis has failed to attribute.A cynic would point to such wobbles within the residuals as being indicative of curve-fitting.
For myself, I am more charitable and rather see the problem being that these wobbles have gone unreported in Tung&Zhou2013. Indeed, a very similar trace can also be derived from Fig 1B Zhou&Tung2013 yet that paper says of the data in Fig 1B "The global-mean temperature adjusted this way shows mostly a monotonic trend with some scatter." This blue trace is definitely not "scatter."
(Note that the graph below features data derived from your Fig 5A&B in Tung&Zhou2013 as there are other feature beyond the blue trace that I see requiring explanation & which I hope we can address in later comments.)Could you thus explain why this wobble is present in the residuals and why its presence has remained unreported?
-
John Hartz at 04:22 AM on 17 July 2013CO2 effect is saturated
@StealthAircraftSoftwareModeler:
Out of curiousity, which climate models have you analyzed in depth?
-
StealthAircraftSoftwareModeler at 04:13 AM on 17 July 2013CO2 effect is saturated
KR @237 To be honest, I’m fairly stunned by your response and I am not sure how to address it. Just out of curiosity, what is your background?
You seem to be asserting that the alpha coefficient of 5.35 of the CO2 forcing function is both accurate and precise because it has been empirically measured. That cannot be true, otherwise people would not be building models as a way to attempt to arrive at these values. Correct? Why build a model when you can just measure it. Your assertion that this is basic physics and models match the real world simply cannot be true. I understand physics (I have a physics degree) and I build software models for living (I also have a computer science degree) so I think I am qualified to speak to models and physics.
The climate is not that simple – far from it – so my assertion of uncertainty is, I believe, completely accurate and true. As further evidence to “prove” that there is enormous uncertainty in the climate, just read the TOA energy balance paper Stevens et al that was referenced by Tom Curtis @ 226. This is great paper! It is peer reviewed. At the end it states: “The net energy balance is the sum of individual fluxes. The current uncertainty in this net surface energy balance is large, and amounts to approximately 17 Wm–2. This uncertainty is an order of magnitude larger than the changes to the net surface fluxes associated with increasing greenhouse gases in the atmosphere.”
Think about that – the uncertainty in the energy budget is ten times larger than the fluxes associated with GHGs. This is clearly proof that my assertions of uncertainty are completely warranted.
-
KK Tung at 04:06 AM on 17 July 2013The anthropogenic global warming rate: Is it steady for the last 100 years? Part 2.
In reply to MA Rodger at post 191:As I said, I didn't quite understand your question and so it would help if you could ask it again if my reply in post 190 was not satisfactory. In that reply I was trying to address your corrected version---note that it did not address the incorrect references to Figure 2. It contains two parts, the first part was that you should not take the wobbles in Figure5AB as the original interannual variation in HadCRUT4. It is Figure 4A that should serve that purpose. The second part was the last two sentences, which explain what the residual should contain in practice. Ideally, the residual (after the anthropogenic response) should contain only climate noise, but in practice, especially in early decades of the data record, it could contain data inadequacies. Some of these data problems could also be amplified by the MLR procedure: Some of the timing of the occurrences of El Nino warming events in the HadCRUT4 data may not be consistent with the ENSO index we used a century ago. So the MLR may produce a negative spike, while the warming spike still remains. We could allow a lag in response that optimizes the removal of ENSO variations in the early decades, but the same lag then messes up the recent decades, which have better data.
-
KR at 03:37 AM on 17 July 2013CO2 effect is saturated
Stealth - Regarding Myhre 1998:
"I doubt it is realistic or correct relative to what is really happening in the real world."
You would be wrong. Those model results have been proven out, empirically measured by the satellite observations, such as those discussed in the opening post (Harries et al 2001 in particular). Have you read the opening post of this thread?
Yes, the Myhre results are based on numeric models of radiative absorption/emission - using column estimates from three multiple latitudes, three different models to minimize bias and atmospheric variation. And they have been confirmed - the satellite spectra show the same outgoing radiation as predicted by those models. And therefore the modelling of slightly different atmospheric compositions is trustworthy. There is really no doubt about them, no significant uncertainties in direct forcing calculations.
If your model reproduces observations from basic physics, it's a good model. Your issues about uncertainties are unwarranted.
-
DSL at 03:32 AM on 17 July 2013Sea level rise is exaggerated
Earthling, does that fact somehow make rapid sea level rise somehow benign?
-
John Fisher at 03:16 AM on 17 July 2013They didn't change the name from 'global warming' to 'climate change'
Here is one such example provided by Anthony Watts:
"Global warming" suggests a steady linear increase in temperature, but since that isn't happening, proponents have shifted to the more universal term "climate change," which can be liberally applied to just about anything observable in the atmosphere.
Climate Change without Catastrophe: Interview with Anthony Watts, oilprice.com, 11 March, 2013
-
rockytom at 02:33 AM on 17 July 2013Global warming games - playing the man not the ball
To Brett N, #5. Your comment is one of the best I have seen in a long time. Indeed, this site is one of the best, if not the best, to try to educate the deniers. The problem is that most of them don't read or understand the material discussed here. The impetus for John Cook and I in writing our textbook (Climate Change Science: A Modern Synthesis) was to make the climate science/global warming truth available to college students perhaps taking their first class in science at the introductory college level. All we can do is throw the facts and truth ih the direction of the deniers and hope that some of it sticks. John's work in climate change science communication is extremely importand as is that of Dana and others, Mann, Mandia, Abraham, Santor, McKibbon, and many other climate scientists (the 97%).
-
Earthling at 02:33 AM on 17 July 2013Sea level rise is exaggerated
If sea level was falling, Earth would be in an ice age and that wouldn't be nice for any of us.
-
StealthAircraftSoftwareModeler at 02:04 AM on 17 July 2013CO2 effect is saturated
KR @222. I went and read Myhre 1998 that produced the ΔF = 5.35*ln(C/C0) W/m2 estimate for CO2 forcing. The issue I have with this is that the alpha coefficient of 5.35 is derived from three different models, which assume that the models are accurate relative to the global atmosphere.
Being a software modeler myself (for 30+ years) dealing with RF energy through atmosphere, I understand that what is measured in the lab, what is model in software, and what the real world does are almost always very different. The real world is so noisy and chaotic that I have found models are almost useless in predicting what will really happen in the real world. I would be stunned if this is not also true for this forcing equation, and GCMs in general.
Trying to measure this value for the real world, on average, is probably impossible given that the atmosphere is so different moment to moment and place to place, and changes in long term trends may be hard to determine since we have so little empirical measurement data. So while this is the “best go-to reference” we have, I doubt it is realistic or correct relative to what is really happening in the real world. I admit it *might be* correct, but I cannot prove or disprove it, nor can anyone else. This isn’t meant as a criticism of experts in this field, only a realization of my experience that the atmosphere is impossible to model accurately.
Tom Curtis @226: I think you made a minor math error. If the average global temperature is 15C, or 288K, then 0.5% of this is 1.44K. I love the energy balance diagram by Stevens et al 2012. I went and read the paper and I found it quite interesting. Since Kevin Trenberth has generated a topic on the energy budget (http://www.skepticalscience.com/news.php?n=865), I am going to take my questions and comments about the energy budget over there.
Scaddenp @227. Just because warmer air can hold more water vapor, doesn’t mean it will. Charts I have seen (http://www.climate4you.com/GreenhouseGasses.htm) of humidity for the atmosphere over time has been about the same at low levels, but at higher altitudes relative humidity has been decreasing. If these charts are correct, this seems to suggest that water vapor has not increased as the atmosphere has warmed over this time period (65 years).
Moderator Response:[TD] For your comment on water vapor, please read the counterargument to "Humidity is Falling," and if you disagree with the peer-reviewed evidence presented there, please comment there. Regarding water vapor in the stratosphere, see "What is the role of stratospheric water vapor in global warming?" Anyone who responds to Stealth's comment here about water vapor, please, please do so on those other threads, not here. Everybody must help to keep the conversations on the appropriate threads. Thank you.
[TD] Thank you for recognizing that another post is the right place to talk about energy budget!
-
KR at 23:59 PM on 16 July 2013Trenberth on Tracking Earth’s energy: A key to climate variability and change
old sage - You make several absurd claims:
"CO2 does not radiate as a black body, it merely scatters and absorbs - that is until you get it up to several thousand degrees, and I don't know how many, but it doesn't occur where you assert it does!"[ ] ...Sorry, CO2 in gaseous form cannot convert kinetic to photon energy except under the rare circumstances I suggest..."
I cannot emphasize enough how wrong those statements are. CO2 (and CH4, and ozone, and CFCs) absorb (not scatter) and emit over a broad IR spectra, with photon emission coming from electron orbital relaxation, and electron excitation being easily converted between orbital and vibrational modes, with a corresponding ability to interchange kinetic and electronic energy. Ionized plasmas are simply not required.
You might find it useful to read up on Kirchhoff's law of thermal radiation, which states that "for an arbitrary body emitting and absorbing thermal radiation in thermodynamic equilibrium, the emissivity is equal to the absorptivity", meaning that the emission spectra at radiative equilibrium is identical to the absorption spectra.
Your assertions regarding gaseous IR emission, to be blunt, are total nonsense contradicted by physics and observations. If as you state you have a background in thin film superconductors, you should know better. Until and unless you decide to discuss physics, rather than Just So Stories, your posts are not worth anyones time.
-
Composer99 at 23:45 PM on 16 July 2013Trenberth on Tracking Earth’s energy: A key to climate variability and change
old sage claims:
CO2 does not radiate as a black body, it merely scatters and absorbs - that is until you get it up to several thousand degrees, and I don't know how many
Just so I'm clear here, old sage, which of the two below are you suggesting:
- CO2 does not radiate electromagnetic energy as a perfect blackbody, while still radiating electromagnetic energy.
- CO2 does not radiate electromagnetic energy at all until reaching very high temperatures.
I'm assuming, based on the clause after the dash, that you are claiming #2.
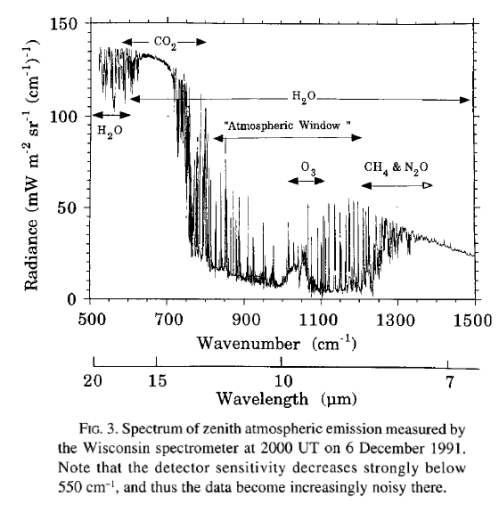
Even based on less-reliable "common sense" inference this claim is plainly false, to say nothing of empirical measurements of the outgoing E/M emission spectrum of the Earth by satellite, which are consistent with emissions of longwave IR at temperatures well below "several thousand degrees".
As an approximation I would describe the Earth's emission spectrum as a composite of of blackbody-like curves between 220-320 K, consistent with the evidence presented by Tom (and others) and inconsistent with the bizarre claim you are attempting to advance.
(Incidentally, it seems to me that, for the purposes of E/M emission into space, you have got the wrong boundary.)
-
MA Rodger at 23:42 PM on 16 July 2013Trenberth on Tracking Earth’s energy: A key to climate variability and change
old sage.
I think I am beginning to discern the bridge more clearly here. You say @223 that "I calculate that earth surface emits 56 w/m2 and what doesn't get straight out goes into gas kinetic energy." I would be interested to see how you calculate the 56 w/m2.
And with this, you also assert @227 that "CO2 in gaseous form cannot convert kinetic to photon energy except under the rare circumstances." You appear to be proposing that gases do not emit radiation. It would be useful to know where do you get this idea from. -
MA Rodger at 23:15 PM on 16 July 2013The anthropogenic global warming rate: Is it steady for the last 100 years? Part 2.
KK Tung.
Your reply @190 describes itself as being a reply to me @188. I have to say that I am not entirely clear that it is.
I can see that it is a reply to me @170. But as I point out in my first paragraph @188, my comment @170 mistook Fig 2b in your 1st SkS post as being equivalent to Fig 5b of T&Zh13. And it is this Fig 2b that strangely still features the HadCRUT4 signal. Thus such a reply as yours @190 is commenting on a mistaken thesis - not a productive use of words.
My first paragraph @188 was solely by way of an apology for my mistaking that Fig 2b for Fig 5b (although the strangness of Fig 2b does remain unexplained and this may be an issue for yourself).But enough of that initial paragraph @188.
You will surely note that @188 I present more than one paragraph. You will note that the second, third and fourth paragraph are the ones that lead up to my question which is the point at issue @188. Any response to my comment @188 would hopefully address these paragraphs and that question.
Now, it is not impossible that the final two sentences of your comment @190 could be construed as some sort of response to these final paragraphs. Yet they are so indirect and carry such implication that I find it hard to see them as a reply. If they are your reply, could you confirm as such. If they are not, a reply would be good.
-
old sage at 23:05 PM on 16 July 2013Trenberth on Tracking Earth’s energy: A key to climate variability and change
I have just looked back at the reference you made TC refuting a previous post of mine about co2 radiating - and quite rude it was too. (CO2 obviously re-radiates a proportion of the energy by which it gets excited but your back-radiation - which will increase with concentration of CO2 - simply means more comes back becasue the number of scattering centres is denser.) Sorry, CO2 in gaseous form cannot convert kinetic to photon energy except under the rare circumstances I suggest, it would just defy the most basic conservation of energy rules. Dense concentrations in solids have that capacity by a process you seem to understand.
-
old sage at 22:45 PM on 16 July 2013Trenberth on Tracking Earth’s energy: A key to climate variability and change
jmorpuss - very good reference that, that is where I am coming from because from a global viewpoint - and any radiating surface - it is the boundary conditions which determine the performance and earths boundary is a shimmering mass of charged particles. Various lens-like changes occur with height. (I should point out my research - a long time ago - was in thin film superconductors of the second kind where magnetic field breaks down into quantised vortices) I imagine such movements high up generating long wave radiation correlated with atmospheric energy levels (hopefully).
TC you repeat what I said in 1 but ignore the consequences. CO2 does not radiate as a black body, it merely scatters and absorbs - that is until you get it up to several thousand degrees, and I don't know how many, but it doesn't occur where you assert it does!
-
Tom Curtis at 21:48 PM on 16 July 2013Trenberth on Tracking Earth’s energy: A key to climate variability and change
Old Sage @223:
1) Solids, like all elements and molecules, absorb and emit radiation at discrete wavelengths corresponding with the discrete energy levels of electron shells, molecular bonds and rotational and vibrational patterns. In solids there are so many elements, so closely packed that the number of such discrete wavelengths is very large so that the radiation will often closely approximate to that of a black body. Nevertheless, the discrete wavelengths of radiation and absorption are there, and are no different in principle in behaviour than that of gases.
2) I have already shown this to be wrong by observational evidence here.
3) Like all substances, CO2 radiates at specific frequencies. The intensity with which it radiates at those frequencies is a function of temperature, based on the laws of black body radiation.
4) At least you got this correct, if nothing else. Unfortunately everything that follows is wrong.
You write:
"If co2 does not stop radiation completely in a clear sky from escaping, it is having little effect, even if it does it accounts for what, 1 % of the spectrum."
This illustrates the absurdity of your position. To actually claim that if CO2 stops 99% or IR radiation, it will have no effect because it is not 100% (ie, completely) is not only wrong, it is nonsensical.
You further write:
"On the quantum front, I suspect solar radiance is worked out by multiplying the normal figure by cross-section."
You are again wrong. The mean solar irradiance is calculated as the Total Solar Irradiance divided by the ratio between the surface area the Earth, and of a disc with the radius of the Earth perpendicular to the Sun's rays (which ratio happens to be 4) - then multiplied by one minus the bond albedo of the Earth. The bond albedo is the reflectance averaged over all angles. Therefore, the standard formula actually incorporates the information you say is ignored, and which you say is not measured.
You write:
"I calculate that earth surface emits 56 w/m2"
Again, you are simply wrong. Below are radiative fluxes at the surface as measured over Lake Ontario. The upwelling surface flux is given as a negative value (dashed line) because it is in the opposite direction to the net short wave radiation (red line, consisting of incoming sunlight minus reflected sunlight) and the back radiation (short dashed line). Note that the surface flux never drops below 200 W/m^2 (as measured), nearly four times your estimated maximum value. It would be much larger in tropical areas, which constitute 50% of the Earth's surface.

-
jmorpuss at 19:47 PM on 16 July 2013Trenberth on Tracking Earth’s energy: A key to climate variability and change
@ Old Sage Is this the angle your comming from link
-
old sage at 18:27 PM on 16 July 2013Trenberth on Tracking Earth’s energy: A key to climate variability and change
Let me just give a little lesson in physics as I understand it - tell me if I'm wrong.
1) earth's surface radiates a spectrum because it is a solid and the energy levels are practically continuous because atoms are forced together. The spectrum varies with the temperature - oscillation of lattice - and character of surface (water, ice, grass, etc).
2) gas molecules are so far apart, their excitation levels require a statistically insignificant collision of several of them to 'stop' say three and leave a fourth spinning off with photon levels of energy. You could work the figures out but it would not necessarily be a carbon level, that would be even less likely (Gases do not radiate!)
3) Carbon dioxide absorbs electromagnetic energy just as does any interfering substance the amplitude falling off exponentially as heat is dissipated in the dielectric. (goes for beta, gamma, wireless - anything, not alpha of course, not e/m radiation)
4) Water droplets in a cloud approach the solid situation, spectrum wil depend on size and T. This means clouds can radiate, the energy comes from somewhere - condensation if growing, sunlight if on the lit side and the surrounding gases in all cases. They do not conjure up energy from nowhere.
If co2 does not stop radiation completely in a clear sky from escaping, it is having little effect, even if it does it accounts for what, 1 % of the spectrum. Clouds simply provide an additional staging post for energy conversion and re-conversion.On the quantum front, I suspect solar radiance is worked out by multiplying the normal figure by cross-section. Well, much e/m energy strikes the earth at a glancing angle, I don't expect anyone has worked out the amount totally reflected at the various boundaries for various frquencies - experiments I know have been carried out looking at i/r. But that would be fairly marginal given the scale of error introduced by that solar balance diagram on top of this thread.
I calculate that earth surface emits 56 w/m2 and what doesn't get straight out goes into gas kinetic energy. Follow the kinetic I say, find out where it goes and discover the cooling effect of radiation from the ionosphere!
-
Tom Curtis at 17:42 PM on 16 July 2013CO2 was higher in the late Ordovician
CBlargh @6, a large increase in the quantity of plants would show up in the fossil record as an increase in dC13 as the C12 isotope in CO2 was preferentially taken up in photosynthesis. The release of O2 by photosynthesis would also show up as elevated oxygen levels. However, this effect would have been very minor in the Ordivician when land plants were small, non-woody plants resembling liverworts, and mostly confined to shore lines, at least according to wikipedia.
However, as plants evolved and colonized the land, that is exactly what happened. At least, it was what happened until the evolution of land animals reduced the extent of forestation and reduced the time from photosynthesis to decay/metabolism, thereby restoring the balance:

-
CBlargh at 16:57 PM on 16 July 2013CO2 was higher in the late Ordovician
I feel like the evolution of land plants at the same general time of the Silurian-Ordovician glaciation is not a coincidence. It seems to me, this should have had a similar effect on climate as the initial evolution of plant life.
If these plants were to have drawn down atmospheric carbon into swamps and bogs which remained there until being digested by newly evolved animals or burned because of retreating water, this wouldn't show in the strontium signal, right?
How would it be possible to detect such an event? Would the ¹³C delta be higher because marine organisms were carbon-deficient and picking it up more frequently? -
Bob Loblaw at 14:58 PM on 16 July 2013Understanding the long-term carbon-cycle: weathering of rocks - a vitally important carbon-sink
Patrick:
Yes, specialized conditions come into play. That's why salt mines and potash mines are are found in some places, but not most. Shallow seas, in hot locations, where evaporation is high. Most of the potash that I know of is from ancient seas, currently far from any salt water body. Ditto for many salt deposits.
I'm not a geologist, so I don't know offhand where such deposits may be currently forming, but I know where I'd start to look.
-
Patrick 027 at 11:36 AM on 16 July 2013Understanding the long-term carbon-cycle: weathering of rocks - a vitally important carbon-sink
Bob Loblaw - thank you - (I sure hope I'm soluble enough to help) - but I assume those types of deposits form under rather restricted/special conditions - a body of water has to be isolated from the rest of the ocean to some extent (maybe not completely - epeiric seas) so that it can dry up enough to form NaCl deposits, for example (I don't know as much about potash). I didn't think the oceans continually become more saline over time in between such evaporite deposits forming. I've heard that ocean chemistry is maintained over geologic type via cycling through hydrothermal vents - are they a sink for these elements? Is biogenic sediment a significant sink?
-
gws at 11:15 AM on 16 July 2013Agnotology, Climastrology, and Replicability Examined in a New Study
I find the comment by Chris G very interesting. I agree that many people probably believe what they are saying, certainly many lay people who get their (mis-)information from "skeptical" websites or friends, do seem to believe what they are saying.
However, it is also true IMHO that when one is exposed to an enormous amount of fact contrary to one's viewpoint, one does usually concede the point or at least retreats, i.e. stops arguing the obviously false. To take ChrisG's analogy: Certain mistakes made by students may be common, but those same students sooner or later realize their mistakes and either switch major or stop making the same mistakes and learn ...
Not true for a large group if not all "contrarians". They insist on making the same mistakes using the same false logic over and over and over again. Solheim and Ellestad from Klimarealistene are prime examples. They cannot be called "wrong" any more, they clearly behave like/are denialists, only clothing themselves as "skeptics"; and I think the ESDD paper comments (again) show that. When I exposed Ellestad's denialist methods online, he simply repeated the same tactics in reply, very similar to his comment on this manuscript. No evidence, no coherent argument, only rhetoric ala "everybody knows that the Hockey Stick is broken".
I have trouble believing that people like Ellestad have simply "slipped a gear", as seemingly that is what Chris G suggests in his last paragraph. The difference is between ordinary denial, well researched in pschycology and underlying the examples given by Chris G, and denialism as defined by Chris Hoofnagle as
"[...] the employment of rhetorical tactics to give the appearance of argument or legitimate debate, when in actuality there is none.”
The latter is clearly employed by Klimarealistene and others, and, as a result, does warrant a search for evidence that they, as others, "intentionally" make mistakes in trying to disprove the facts. This paper makes a large step in that direction, kudos to Benestad and colleagues.
-
JasonB at 10:53 AM on 16 July 2013Patrick Michaels: Cato's Climate Expert Has History Of Getting It Wrong
glhoffman,
With regard to post no. 34, there are more fundamental problems with current models in making projections because they are largely unverifiable.
That's a bold claim, supported by the following:
Decadal predictions have a high profile in the climate science community and beyond, yet very little is known about their skill.
Emphasis mine.
Can you see the difference?
In the context of repeated statements about the fact that the signal:noise ratio is too high over short time periods to even be able to confirm global warming is still happening over those short periods — purely because of that signal:noise ratio, not because it isn't still happening! — what makes you think that saying it's difficult to verify model predictions over those same time scales is saying something profoundly important about their skill?
Of course models are verifiable, and there have been plenty of model predictions that have been verified, including multiple cases where the data apparently falsified the models at the time and then it was discovered that the data was wrong! The trick is that we just have to be patient purely and simply because the signal:noise ratio does not allow us to verify these models until enough time has passed for the short-term weather noise to cancel out revealing the underlying climate change. If you do that, then even quite simple models do a decent job of hindcasting the last hundred years or so.
-
Tom Curtis at 10:44 AM on 16 July 2013Greenhouse Effect Basics: Warm Earth, Cold Atmosphere
Old Sage @71, IMO, whether or not CO2 radiates at normal atmospheric pressures and temperatures is the crux of your argument. In fact, that CO2 does radiate in the IR at normal atmospheric temperatures and pressures is resoundingly confirmed by experiment.
Line by Line and broad band radiation models model the transfer of radiation within the atmosphere. For line by line models, the atmosphere is divided up into a number of layers. For each layer radiative transfer is calculated, with the total upward radiation at the top of that layer being the total upward radiation at the top of the next lower layer, less the radiation absorbed by the layer, plus the upward emissions by that layer. For line by line models, this is calculated seperately for each wave number. For broad band models, it is calculated seperately for groups or wave numbers (ie, the bands). All such models assume that each layer emits an amount based on their emissivity times the radiation expected for that wave number (or band) by a black body of the same temperature of the layer. The emissivity, of course, equals the absorptivity.
If CO2 did not radiate at normal atmospheres and pressures, such models would be massively inaccurate. Instead, they are stunningly confirmed by observations (see the section "Settled Science" in the main article, and my comment number 42). These models have not just been confirmed by observations from space, but also by observations by aircraft looking both upwards and downwards at various altitudes. Indeed, they have also been confirmed by aircraft observations looking sidewards, as the original research was done in the interests of developing accurate Infrared guided air to air missiles. They have also been confirmed by observations looking upwards from the ground. Here (courtesy of Science of Doom) is a comparison between modelled and observed back radiation:

Science of Doom has more graphs of measurments of back radiation on this page.
The back radiation is particularly devestating to your theory. As I understand it, you claim that CO2 absorbs, but does not reradiate IR radiation, except in the "electromagnetic soup" at the top of the atmosphere, ie, the ionosphere. If that were the case, there would be no IR back radiation. Any IR back radiation from the ionosphere would be as completely absorbed by the intervening atmosphere as would IR radiation from the surface. With no intervening radiation (according to your theory), the result would be a complete lack of IR radiation at the surface at bands where CO2 was strongly aborbing. Instead, we see the opposite, with the strongest IR back radiation at those wavelengths where CO2 is most strongly aborbing:
Further, nearly all of that back radiation comes from the lowest km of the Earth's atmosphere. For that reason, typically, the brightness temperature, ie, the incoming energy normalized by black body radiation curve, closely matches the surface. The exceptions are when the upper troposphere is signicantly warmer than the surface (as with Antarctica in the winter) which results in warmer wings (where CO2 is less absorptive, and hence originates from higher in the atmosphere in the case of back radiation) then does the more strongly absorbing center:

In contrast to your theory, the theory that CO2 radiates IR at normal atmospheric temperatures and pressures results in not just accurate predictions of the total energy radiated, but accurate predictions of the detailed profile of the emission spectrum given knowledge of the atmospheric temperature profile. (For the upward case, see the section "Settled Science" in the main article.
In contrast to this mass of detailed prediction and confirmation, you offer us a counter theory which has not even reached the back of envelope calculation stage. There is a reason that it has gone no further. If you take it further it immediately breaks down and is shown to be contradicted by the evidence. Given that, your choice at the moment is very clear. Embrace science by rejecting the nonsense you are currently espousing - or show clearly that it is pseudo-science you love and expouse by repeating the same old nonsense yet again.
-
Glenn Tamblyn at 10:30 AM on 16 July 2013Greenhouse Effect Basics: Warm Earth, Cold Atmosphere
old sage
see my comment here
-
Ken in Oz at 10:14 AM on 16 July 2013Patrick Michaels: Cato's Climate Expert Has History Of Getting It Wrong
Barry @18 -
I'm guessing that the focus on surface air temperatures is because 1), it is only recently that ocean heat content indicea have been collated, 2) impact of global warming (for humans anyway) will be experienced mostly at the surface.
This is true, however most of the discussion about statiscally significant warming and the false climate denier conclusion that warming has slowed or stopped for 17years that has followed our comments looks kind of pointless in light of the clear and measurable global warming - 4 Hiroshima bombs per second worth - that has been occurring during this period of "no significant warming". Even if temperature records for oceans don't go back as far as surface air temperatures (because existing meteorological records was where much initial effort was spent looking for climate change signal) they are adequate now to measure a fundamental change in the climate system's energy balance - which SAT's do not.
Of course this is just one way to frame the discussion - alternatives include focus on the known natural oscillations, cycles and underlying climate processes. In order for the deniers and obstructors to maximise the spin value (spun falsewards) it is necessary for them to falsely imply that if SAT's don't rise consistently year to year, decade to decade then something besides GHG's are responsible - and other things besides are indeed responsible for most of any short term up or down but the deniers and obstructors assiduously avoid examining them closely. Flattening of SAT's presents a window of opportunity to mislead the public and the public's political representatives. As I said before, when el Nino hits, "global" temperatures hit new highs, they will rediscover selected natural phenomena like ENSO that, when applied to the current period, reveal the lack of foundation for their 'warming has stopped, climate scientists are wrong' arguments.
Foster and Rahmstorf showed clearly that when you take the known natural influences out of the SAT records much of the internal variation disappears and a clearer look at the underlying trend is revealled. ie there is no 17 years of no warming. It's entirely an artifact of an artificial argument, intended to obfuscate the seriousness of a global problem of unparalleled extent.
But they overlay a strong clear warming trend with ups and downs. Well, ups and levelling offs because of that underlying warming. That's worth pointing out; if there was no underlying global warming those would indeed be ups and downs - 'statistically significant' periods of SAT's going unmistakeably down. Short lived periods, of course, because the bulk of those variations are due to oscillations like ENSO.
If global heat content were THE measure of change to our climate system all these arguments about statistically significant trends over 'x' number of years become more clearly what they are - time wasting distractions.
-
Glenn Tamblyn at 10:06 AM on 16 July 2013Trenberth on Tracking Earth’s energy: A key to climate variability and change
old sage @216
It isn't just CO2, its all the GH gases. And the other non-GH molecules in the atmosphere are bumping into them all the time. In fact the kinetic energy of those collisions is the source of the energy that the GH molecules are radiating.
All the IR radiation in the atmosphere originates from the GH molecules, the non-GH molecules, O2 and N2 particularly cannot radiate in the IR wavelengths required. The radiation from the GH molecules comes from the fact that the individual atoms in the molecule are joined by flexible bonds between the atoms. So the atoms in the molecule are always vibrating, jiggling around like balls on springs. Essentially kinetic energy is stored in the bonds between the atoms. Some of this energy can then be released as a photon of IR radiation, resulting in the GH molecule vibrating a little less. However, the continuous collisions between molecules can quickly 're-energize' the GH molecule so that it is able to radiate again.
When you think of the energy being radiated from the atmosphere as coming from the combined energy of all the molecules in the atmosphere it may not sound so strange. It is just that in order to be radiated it has to be channelled through the GH molecules to 'get out'. -
scaddenp at 09:54 AM on 16 July 2013Trenberth on Tracking Earth’s energy: A key to climate variability and change
Old Sage - your inability to understand something does not make wrong. You have been pointed to the text book stuff. Why dont you actually start there? I should also point out that the spectroscopy tests of theory have been repeated numerous times and the Radiative Transfer Equations predict the results of experiments with exquisite accuracy. If your conception of physics is at odds with experimental observations, then its time to revise your conceptions of physics. Pick up a text book.
-
Tom Curtis at 09:47 AM on 16 July 2013Greenhouse Effect Basics: Warm Earth, Cold Atmosphere
Old Sage @7, this initial comment is just to clear up some (frankly silly) arguments so as to not distract from the main substance.
1) The radiator analogy: A radiator of a car in motion will not boil if it has sufficient coolant and the water pump is working. It is only if the car is stationary that disconnecting the radiator fan is sufficient to cause the radiator to boil. Further, pointing out that radiators do not loose most of their heat by radiation is irrelevant. "Radiator" remains their name, and the analogy merely points out that if you maintain a constant energy input, but decrease the energy output, the system will warm. A significant number of AGW deniers deny that basic fact.
2) The CO2 concentration in the atmosphere is measured in parts per million by volume (ppmv), not parts per million by mass. The atmospheric concentration is now 400 ppmv, so it is 4 moles of CO2 for every 9996 moles of other gases; or if you like 1 molecule of CO2 for every 2499 molecules of other gases.
3a) Your quotation of 2.9 W/m^2 forcing ignores the forcing from aerosols, which is negative. Therefore it overstates the total forcing by nearly a factor of two. Further, it is the forcing, which is the difference in top of atmosphere (TOA) radiative imbalance for a given change of radiative conditions prior to any responses to that change, including increases in temperature. Feedbacks and increases in temperature will further alter the TOA energy imbalance, with positive feedbacks increasing it, and negative feedbacks and increases in temperature reducing it. As it happens, the increase in temperature since 1750 (the reference date for forcings) has reduced the TOA energy imbalance to 0.6 W/m^2.
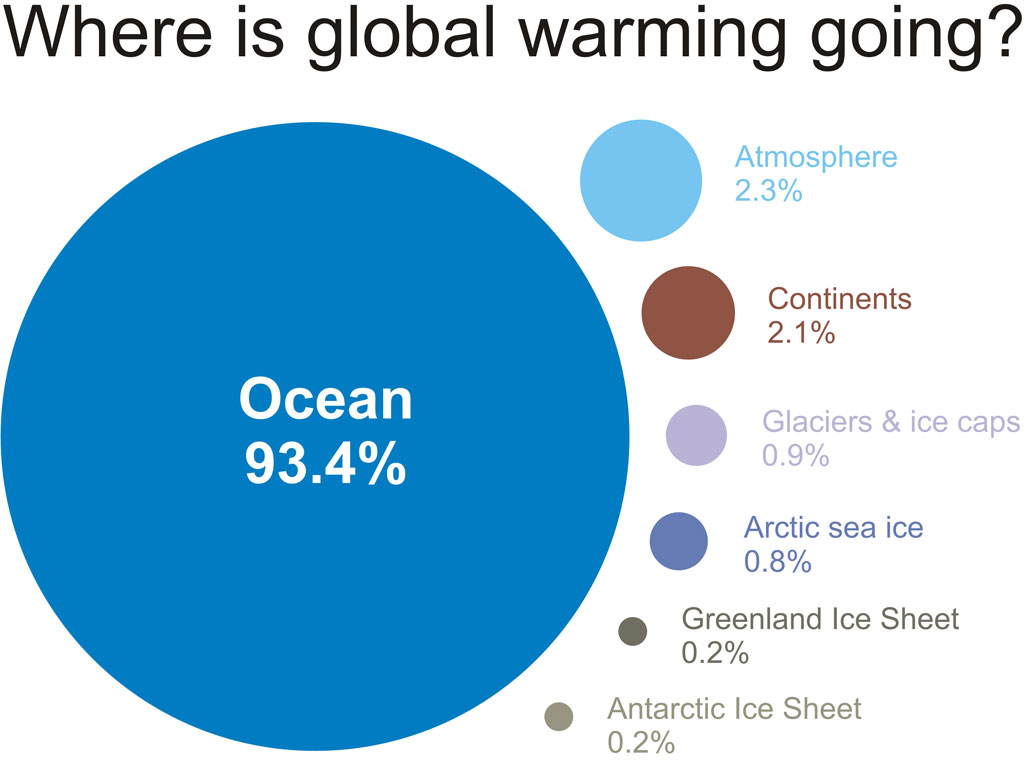
3b) The energy increase caused by the greenhouse effect is distributed among all Earth's surface components. That includes the upper few meters of soil, the melting of snow and ice, the increase of temperature of the ocean and the increase in temperature of the atmosphere. It even includes any increase of storage of chemical energy resulting from the CO2 fertilization effect, although that amount is (comparitavely) too small to consider. Of these components, the atmosphere absorbs around 2% (1.4% according to Church et al, 2011) of the heat, while the ocean absorbs over 90%.
If you want to pursue this line of argument, this link leads to an appropriate thread.
-
sylas at 09:24 AM on 16 July 2013It's waste heat
A comment on convection and transfer of heat...
Where there is a hot spot or heat source on the surface (from waste heat, for example) convection is a crucial way that excess heat is carried away and up into the atmosphere. As I understand it, convection is extremely effective; and it transfers heat much faster than radiation in the atmosphere -- as long as there is an energy imbalance to drive the convection.
Convection, however, is capped; it cannot carry heat away out into space. So it will tend to bring the atmosphere into a state of convective equilibrium. This equilibrium is called the "lapse rate". This is the temperature profile of the atmosphere where there is no transfer of heat energy as a "packet" of air moves up or down. The temperature change of the atmosphere at different altitudes matches the temperature change from expansion or compression with the pressure change (and condensation, in the case of a moist atmosphere). An "unstable" atmosphere is one where convection will restore the equilibrium, and this cannot last for long before convection restores the conventional lapse rate. This is caused by heat at the surface or low altitude.
You can also get cases where air at higher altitude is warmer than you would expect from the lapse rate; but this case is called “stable”, because convection doesn’t move hot air downwards. This condition of the atmosphere is broken up usually by winds and horizontal circulations, or else by loss of heat from radiation of the hot air – a much slower process than convection.
This doesn’t support Old Sage’s claims; the actual energy flows from convection are pretty small by comparison with radiation. Convection is fast, but as with any spontaneous thermal process, it works to remove the conditions which drive it. Radiation works more slowly, but this energy flow is not capped at the top of the atmosphere, so there’s a continuous ongoing flow of radiation out into space.
The lapse rate in the atmosphere – the fall in temperature with altitude – is a crucial part of how the greenhouse effect works. The capacity of the atmosphere to absorb and emit IR radiation means that a much of the Earth’s emissions to space comes from emissions high in the atmosphere; where it is cooler than the surface. In order to shed the heat Earth absorbs from the Sun, temperatures overall must be that much hotter to get a balancing emission of energy back to space.
Summary sentence: the efficiency and speed of convection maintains the atmosphere close to conditions of a convective equilibrium – in which the major energy flows by far are from radiation.
-
KR at 09:21 AM on 16 July 2013Trenberth on Tracking Earth’s energy: A key to climate variability and change
Bob Loblaw - Ah, that would certainly explain the difference in numbers; my misunderstanding then.
That back-of-the-envelope calculation would require specifying the transient climate sensitivity, and/or the mass directly involved. Timing is everything, after all...
-
Bob Loblaw at 09:17 AM on 16 July 2013Understanding the long-term carbon-cycle: weathering of rocks - a vitally important carbon-sink
Patrick 027:
Ever wondered where table salt comes from? Perhaps mined from sodium chloride precipitated from the sea? How about potash (potassium salts). which are mined extensively for use as fertilizer?
As they say, if you aren't part of the solution, you're part of the precipitate...
-
Bob Loblaw at 09:11 AM on 16 July 2013Trenberth on Tracking Earth’s energy: A key to climate variability and change
Actually, KR, Phil was talking about the change per year, not the total change. If the 2.9W/m2 is held steady, it would take a little over 100 years to cause a total change of 1 degree.
I'm guess that Phil just took a mean water depth and heat capacity to get his number. One catch is that the entire ocean depth is not evenly mixed. Thus, the heat tends to warm the upper layers faster, so a surface temperature response will see a greater increase than the 0.082K per year in the early years, and the deep ocean takes a while before it shows heating.
Phil could explain the assumptions behind his back-of-the-envelope calculation a in bit more detail.
-
Patrick 027 at 08:54 AM on 16 July 2013Understanding the long-term carbon-cycle: weathering of rocks - a vitally important carbon-sink
(haven't commented here in a while; wow, this looks different)...
K, Na - don't ordinarily form carbonates - so what happens to them to remove them from the ocean? When more CO2 is making the ocean more acidic, would more Na and K ions act the same way on pH as dissolving CaCO3?
How much more more CaCO3 would be in solution if precipitation were all abiogenic?
-
Utahn at 08:25 AM on 16 July 2013Global warming games - playing the man not the ball
Ok, it only makes sense if you have an inaccurate view of that analogy...Whoops
-
Utahn at 08:22 AM on 16 July 2013Global warming games - playing the man not the ball
Thanks for fighting. Incidentally, when I first saw this post I was thinking, "man" = global energy imbalance, and "ball" = surface temperature, and I thought that's a great analogy I haven't seen before!
-
Artful Dodger at 08:19 AM on 16 July 2013Global warming games - playing the man not the ball
"It has clowns, hockey sticks, and witches"
And don't forget: T*R*O*L*L*S !
-
glhoffman at 07:53 AM on 16 July 2013Patrick Michaels: Cato's Climate Expert Has History Of Getting It Wrong
With regard to post no. 34, there are more fundamental problems with current models in making projections because they are largely unverifiable.
Moderator Response:[PW] Discussion of 'models are wrong' are veering a bit off-topic for this thread: further discussion should be posted here.
-
KK Tung at 07:35 AM on 16 July 2013The anthropogenic global warming rate: Is it steady for the last 100 years? Part 2.
In reply to MA Rodger at post 188: I had trouble understanding your original posts---that was the reason I didn't respond to them then. I may still not be understanding it; so please correct me if I misinterpret your points. You are looking at the interannual variation of the original data in HadCRUT4. This was shown in Figure 4A, not Figure 5A of Tung and Zhou (2013), PNAS. Figure 5A is the result of one round of MLR, after removal of ENSO, vol and solar influences. Figure 5B is the adjusted data, and it contains everything that remains after removal of ENSO, sol and solar, plus AMO influence. It should contain anthropogenic response plus climate noise ideally. In reality it also contains errors in observation and the interpolation that was used to come up with the global mean, especially in the early decades in the 20th century; the 50 years prior to that was especially bad, datawise. You can see that after 1970s, the variations about a linear trend do look smaller and like random noise.
-
KR at 07:22 AM on 16 July 2013Trenberth on Tracking Earth’s energy: A key to climate variability and change
Phil - Actually, a 2.9 W/m2 top of atmosphere forcing should directly raise temperatures by about 0.877 C, not including feedbacks.
Calculation: start with the Stefan-Boltzmann relationship of

or Power = emissivity * SB constant * Area * Temperature4
The Stefan-Boltzmann constant is 5.670373*10-8 Wm-2K-4, surface temperature in Kelvin averages 15 C + 273.15 = 288.15 K, and for area we can assume one square meter.
Starting effective Earth emissivity = Power / (SB constant * T4) = 240 W/m2 /(SB * 1 * 288.154) = 0.6139
With 2.9 W/m2 missing, effective emissivity = 237.1 W/m2 /(SB * 1 * 288.154) = 0.60652
To radiate 240 watts with a lower effective emissivity, and remove the energy imbalance, a higher temperature is required. T = (240 W/m2 / (SB * 0.60652)) -4 = 289.03 K = 15.877 C. That's a direct, pre-feedback temperature difference of 0.877 C.
Moderator Response:[DB] updated image link per request.
-
Brett N at 07:13 AM on 16 July 2013Global warming games - playing the man not the ball
Twenty years ago I thought the science was complete enough to begin a plan of action to slow the advance of climate change. Sadly, I was naive enough to think our politicians would do the right thing and start to implement the changes required. Silly me, while I went off and lived my life a drama of truly epic proportions was being played out. Heroes and villains, dark forces pulling the strings of puppets ensnared in a web of greed, subtext and innuendo abounding. Shakespeare be dammed, scientists rock!My thanks go out to all of you who have advanced our fight for survival. More than once, I have descended into the twisted rabbit hole of a denier site. Such a pretty argument, so simple, so easy to be sucked in, only to find myself lost in a maze of half truths and sound bites. Yes, more than once, a lifeline thrown by the posters on this site have saved me. Your selfless dedication to the truth, and boundless patience in educating even the slow ones such as myself, should be recognized by all, as truly heroic. -
Phil at 06:56 AM on 16 July 2013Trenberth on Tracking Earth’s energy: A key to climate variability and change
The 2.9 Wm-2 surplus doesn't heat the atmosphere; it heats the entire planet. My back-of-envelope calculation (literally !) suggests that should result in an annual temperature rise of 0.0082K
-
supak at 06:52 AM on 16 July 2013Patrick Michaels: Cato's Climate Expert Has History Of Getting It Wrong
Tom Curtis @ 17
While some of what you said went over my head, I appreciate your input and will definitely try to hunt down some of the information you offered.
jdixon1980 @ 36
"so that I wouldn't end up having a financial stake in "rooting" for the human race to continue to drive itself into devastation."
That's funny, and what my wife often laments about my propensity to want to gamble on the future of the human race. I don't have these qualms because I don't have to root for a bad outcome. It's already going to happen.
My guess is that even if he has millions in the bank, he has no plans to pay out on any such bet, so I'm probably wasting my time. But I am keeping what he's saying and plan to make a blog post out of it at some point. I'm just looking to get some input from you guys so I don't look like a fool.
See, while I understand a lot of this stuff, I'm really just a gambler who is always looking for a sure thing. I cannot think of anything much more sure than the fact that we are going to see significant warming of surface temps in the next 25 years.
I do, however, like the comment from Ken in Oz @ 16 that going by surface temps alone is a fool's errand. We shoud be sure to always mention that the vast majority of the warming has gone to the oceans. If only there were some accurate measure of ocean warmth I could get Micheals to agree on, then I'd include that as a seperate bet.
Prev 865 866 867 868 869 870 871 872 873 874 875 876 877 878 879 880 Next


