


 Arguments


Recent Comments
Prev 884 885 886 887 888 889 890 891 892 893 894 895 896 897 898 899 Next
Comments 44551 to 44600:
-
Dumb Scientist at 09:07 AM on 11 June 2013The anthropogenic global warming rate: Is it steady for the last 100 years? Part 2.
... I need to reiterate the basic premise of parameter estimation: if A is the true value and B is an estimate of A but with uncertainty, then B should not be considered to underestimate or overestimate A if A is within the 95% confidence interval (CI) of B. ... Not taking CI of the estimate into account is not the only problem in your post 117. ... [KK Tung]
My Monte Carlo histograms estimated the confidence intervals. To make these 95% confidence intervals more explicit, gaussians are now fit to the histograms. For comparison, 95% confidence intervals from the post-1979 trend regressions are also reported now.
A more serious problem is your creation of an almost trivial example for the purpose of arguing your case. ... I said this is an almost trivial example because if this small "regional" noise were zero it would have been a trivial case (see later). Even with the small regional noise, your n_atlantic is highly correlated with your global data at higher than 0.8 correlation coefficient at all time scales. [KK Tung]
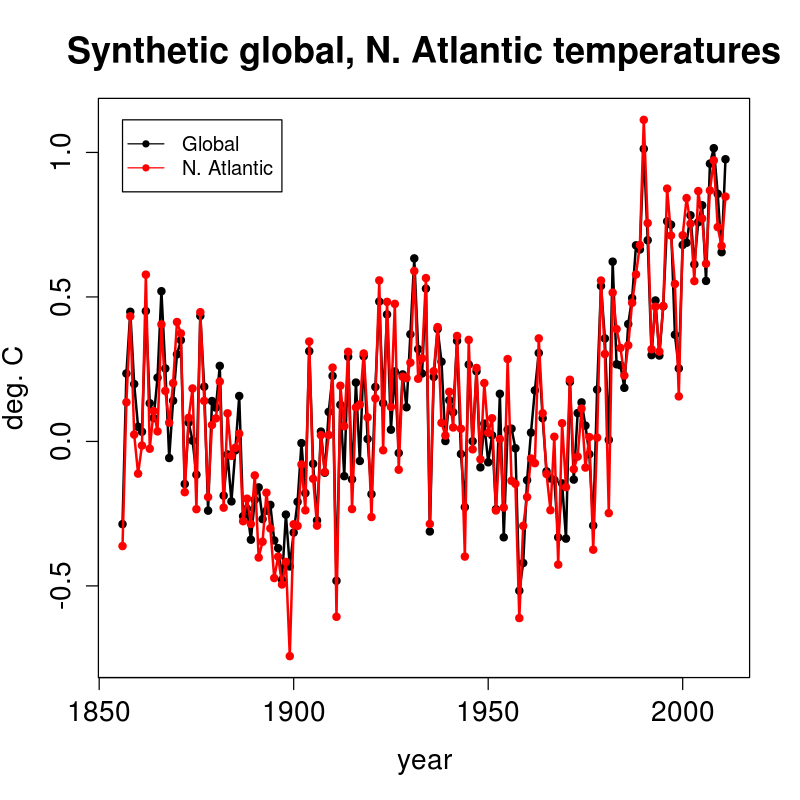
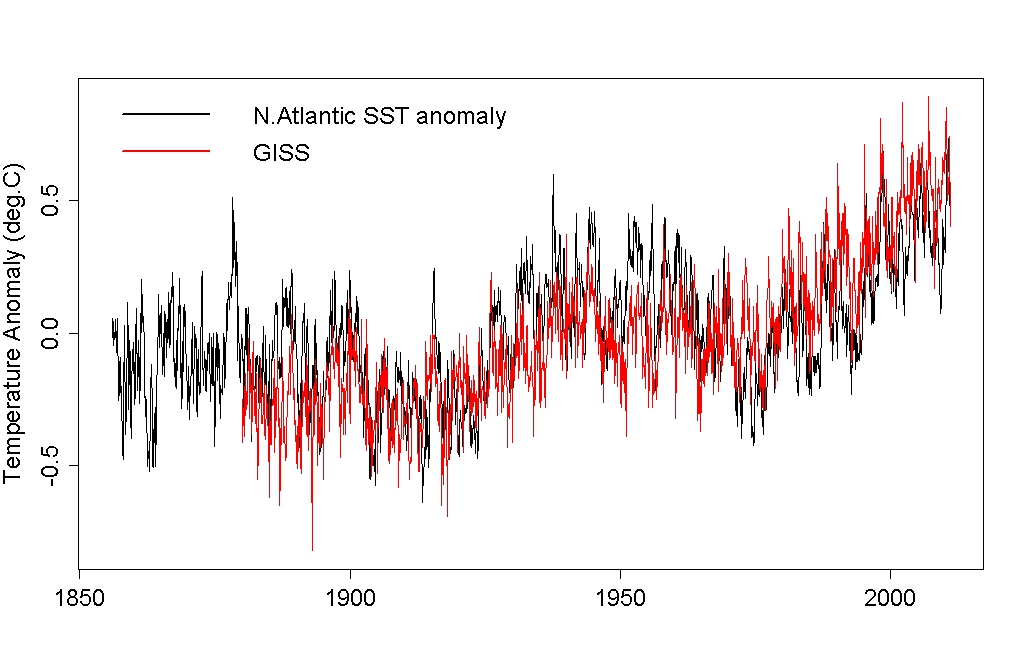
My original timeseries were simply chosen to look like these real timeseries from GISS and NOAA.
I wrote a new R program that downloads the HadCRUT4 annual global surface temperatures, and calculates annual averages of NOAA's long monthly AMO index and N. Atlantic SST:

The correlation coefficient between annual HadCRUT4 and N. Atlantic SST is 0.79. Linear regression is based on correlations, so my original synthetic timeseries were too highly correlated. Thanks for pointing this out, Dr. Tung.
To make your synthetic data slightly more realistic while retaining most of their features that you wanted we could either increase the standard deviation of the regional noise from 0.1 to 0.3---this change is realistic because the regional variance is always larger than the global mean variance... [KK Tung]
In my original simulation, the regional variance was already larger than the global mean variance because the regional noise was added to the global noise. In reality, the annual N. Atlantic SST variance is 0.04°C^2 but the annual global HadCRUT4 variance is 0.07°C^2. Adding 0.3°C of regional noise yields a reasonable correlation coefficient, but it doesn't look realistic:

Or we could retain the same combined standard deviation as your two noise terms in n_atlantic, but from a different draw of the random variable than the random variable in global... [KK Tung]
That looked more realistic but the average correlation coefficient over 10,000 runs was 0.64±0.08, which is too small. So I chose new simulation parameters to match the real correlation coefficient (0.79) and produce more realistic timeseries:
human = (t-t[1])^7
human = 0.7*human/human[length(t)]
nature = 0.15*cos(2*pi*(t-2000)/70)
global = human + nature + rnorm(t,mean=0,sd=0.11)
n_atlantic = human + nature + rnorm(t,mean=0,sd=sqrt(0.11^2+0.11^2))Now the AMO's amplitude is 0.15°C and the total human contribution is 0.7°C, both of which match the lower bounds in Tung and Zhou 2013. The nonlinearity is now 7th order to keep the true post-1979 human trend at 0.17°C/decade.

Averaged over 10,000 Monte Carlo runs, the synthetic correlation coefficient was 0.74±0.06, which contains the real value (0.79). The synthetic global variance is 0.06±0.01°C^2 which contains the real value (0.07°C^2). The synthetic N. Atlantic variance is 0.07±0.01°C^2, which is still larger than the real value (0.04°C^2). However, the discrepancy has shrunk and the LOWESS smooth removes fast fluctuations anyway.
You can also make your example less deterministic and hence less trivial, by smoothing your AMO index as we did in our paper. [KK Tung]
A 25-year LOWESS smooth was applied to the real and synthetic AMO index to match your paper:
smoothed_amo = lowess(t,amo,f=25/n)$y
amo = smoothed_amo

Here are the real residuals:

Here are the synthetic residuals:

Here are the real results:

(For easier comparison, the true human curve was shifted so it has the same post-1979 mean as the estimated human trend.)
Those results only use a white-noise model for comparison to the simulations. The real data are autocorrelated, and the caption of Fig. 1 in Zhou and Tung 2012 says the noise is order AR(4), which yields a trend of +0.12±0.05°C/decade.
Here are the synthetic results:

Averaged over 10,000 runs, the synthetic post-1979 trends and 95% confidence intervals are +0.09±0.04°C/decade. This histogram provides another similar estimate:

The true quadratic term is +5.15x10^(-5)°C/year^2, but the estimated value and its 95% confidence interval is +3.24±0.72x10^(-5)°C/year^2. The estimated human influence is still signficantly more linear than the true human influence, which is actually 7th order.
... In the MLR analysis of the real observation the degree of collinearity is much smaller, hence our error bars are much smaller, and so our MLR analysis gave useful results while your artificially constructed case did not yield useful results. ... [KK Tung]
Despite smoothing the AMO index and choosing simulation parameters that yield timeseries and correlation coefficients that are more realistic, the true post-1979 trend of 0.17°C/decade is still above the 95% confidence interval. The same procedure applied to real data yields similar trends and uncertainties. Therefore, I still think Tung and Zhou 2013 is a circular argument.
In our PNAS paper, we said that because of the importance of the results we needed to show consistency of the results obtained by different methods. The other method we used was wavelet. Applying the wavelet method to your example and to all the cases mentioned here we obtain the correct estimate of the true value foranthropogenic warming rate over 98% of the time. The wavelet method does not involve detrending and can handle both linear or nonlinear trends. [KK Tung]
The wavelet method may have its own problems, but these problems are orthogonal to the problem of the MLR as no detrending is involved. [KK Tung]
The wavelet method is just another way to curve-fit, which is also inadequate because attribution is really a thermodynamics problem. Again, your curve-fitting claim that ~40% of the surface warming over the last 50 years can be attributed to a single mode of internal variability contradicts Isaac Held and Huber and Knutti 2012 who used thermodynamics to conclude that all modes of internal variability couldn't be responsible for more than about 25% of this surface warming.
-
MA Rodger at 08:38 AM on 11 June 2013The anthropogenic global warming rate: Is it steady for the last 100 years? Part 2.
KK Tung @149.
Well, here is the statement from your first SkS Post and, as written, its context is quite clear. Figure 3 applies to the "final adjusted data" not to the "first step," not to any "intermediate step." Yet the presence of the "minor negative trend" is clearly accepted and while the rest of it is plainly described as "almost just noise" despite it still containing half the de-trended signal for 90 years of the 160 year of the MLR (as shown @148 above). This situation is described as "successful."
The arbitrary comment is made that this "small negative trend" can be added back from residual into anthropogenic regressor, but as written this is continuing to treat the "small negative trend" as one entirely negligable in consequence (because no consequences are described).
"Of the different regressors we tried the single anthropogenic regressor that is closest to the final adjusted data turns out to the QCO2(t) function given in Figure 1b. This is shown in Figure 3. The difference between the adjusted data and the QCO2 regressor is the Residual, which is shown in the inset. Except for s a minor negative trend in the last decade in the Residual, it is almost just noise. So the MLR with QCO2 as the anthropogenic regressor is successful. That small negative trend in the Residual, when added back to QCO2, yields a more linear trend in the adjusted data, similar to what we found in Tung and Zhou and in Figure 2b here. (The physical interpretation of why the net anthropogenic warming appears to follow the radiative heating by CO2 alone and with so little lag between forcing and response is rather tricky and will not be discussed here.)"
-
jdixon1980 at 08:17 AM on 11 June 2013The 5 characteristics of global warming consensus denial
DS @ 78: But what if they say, no, the scientists have come up with a better scheme than trying to sell uncertainty as to human cause, because there is only so long they could drag that out before their funders threw their hands up and said look, we've given you enough money, and if you're not sure by now, we must not be causing it. Instead, their scheme is to present a united front on human cause, and claim that they need enormous sums to create and continually refine computer models, study the impacts of various projected scenarios, propose and periodically revise emissions targets, periodically reassess climate sensitivity, etc. etc., thus creating an inherently self-perpetuating stream of research funding. Unlike the "uncertainty" approach which is bound to wear thin eventually, with this strategy there will be no point at which the gravy will stop, because the "so-called 'consensus'" as to human cause and seriousness of the problem attaches great importance to the research pertaining to details.
Of course, it's silly - those who are so inclined can always come up with convoluted rationalizations for believing in grand conspiracies. And John Hartz @ 79 is probably right - by trying to get inside their heads and preemptively refute every kooky thing they may come up with, I will never succeed in guiding them to sanity, but I may succeed in driving myself insane!
-
Lanfear at 06:28 AM on 11 June 2013An estimate of the consensus project paper search coverage
"Perhaps one of them is the one that turns around the whole of climate science."
Then it would need to be a thick one, since it needs to overthrow a sizeable chunk of the known, and settled, science.
Or, of course, the explanation is dispersed over a number of papers.
Either way, both cases are testable, either look into the thick research papers and see if they provide an alternative explanation which covers all the known detected anomalities. Or see if there are number of papers that does the same, being referred by each other.
After all, ~900 papers should not be that hard to read through. That's less than 3 years with 1 paper per day and I'm pretty sure you can automate this.
What are the odds of pseudosceptics picking up this task?
-
mspelto at 05:14 AM on 11 June 2013An estimate of the consensus project paper search coverage
Your comment fit well with my mass balance work on glaciers, "impacts papers are more inclined to mention the phenomenon causing the impacts they are studying, whereas for climate scientists it might go without saying that they are studying climate change related issues and they are perhaps more concentrated on studying the little details of the issue." All of my results indicate the impacts of global warming on glaciers, but the focus in word choice in the abstract will be more on negative mass balance, glacier retreat due to warming in the region. Since we are studying a locality that is the focus, and so it sometimes goes unsaid that it is all driven by global warming. .
-
Dikran Marsupial at 05:05 AM on 11 June 2013The anthropogenic global warming rate: Is it steady for the last 100 years? Part 2.
Prof. Tung. I deliberately separated the example from the discussion of AMO and relabelled the variables essentially at your request. The discussion is focussed on the form of the regression analysis, the exact nature of the variables is entirely unimportant, except for the fact that one of the variables (D) is only observed (C) in a form that is contaminated with the other two (A and B). Please can you answer the question, as posed: do you agree that in this example, the MLR regression method significantly underestimates the effect of signal A on signal Y?
please accept my appologies, I'm obviously having a bad day and am too grumpy to be posting. There was an error, it should be
B = 0.1*sin(2*pi*T/150);
however, the exact nature of the signals is unimportant other than that D is only observed contaminated with A and B as signal C. The plots and confidence intervals etc. should be O.K.
-
KK Tung at 04:51 AM on 11 June 2013The anthropogenic global warming rate: Is it steady for the last 100 years? Part 2.
Question to Dikran Marsupial on post 134: I don't quite understand your thought experiment. What is an "unobserved signal D"? Whatpurpose did you intend it to serve in this thought experiment? Isn't it the same as B? You can combine D with B and get:
C=0.5*A+(0.05+0.05)*sin(3.7*pi*T/150)
So it should simply be
C=0.5*A+B
Y=A+(0.1+0.05)sin(3.7*pi*T/150)+0.1*radn((size(T))
So it should simply be
Y=A+1.5*B+0.1radn((size(T)).
Maybe there was a typo on the sinusoidal function?
-
KK Tung at 04:09 AM on 11 June 2013The anthropogenic global warming rate: Is it steady for the last 100 years? Part 2.
Replying to MA Rodger in posts 147 and 148: You missunderstood the context of that statement about a minor negative trend in the residual. In the method of MLR that we used, the residual is added back to the regressed "anthropogenic" signal in the first round to obtain the "adjusted data" from which then the anthropogenic trend was finally determined. The result from the first step is not considered final if there is a trend in the residual. One should not attribute it in the intermediate step of the procedure to anything until the process is complete.
-
BaerbelW at 04:01 AM on 11 June 2013Live Feed of the AGU Chapman Conference on Climate Communication starting... now!
According to the Web Session Schedule, John's session on Wednesday will be broadcast online:
2:00 p.m. — 2:15 p.m.
The Importance of Consensus Information in Reducing the Biasing Influence of Worldview on Climate Change Attitudes -
miffedmax at 02:51 AM on 11 June 2013Lu Blames Global Warming on CFCs (Curve Fitting Correlations)
Thanks again for such a clear, concise rebuttal.
But I have to admit I got completely lost in the comments. This is an informative, if sometimes scary place, for us right-brainers. -
ShineNet at 02:28 AM on 11 June 2013Live Feed of the AGU Chapman Conference on Climate Communication starting... now!
Will these live feeds be recorded and available later? Thanks!
Response:[John Cook] I asked AGU about the question of archiving and they said probably yes, they will be available down the track.
-
Tom Curtis at 22:16 PM on 10 June 2013Imbers et al. Test Human-Caused Global Warming Detection
SASM @45, I have responded here.
-
Tom Curtis at 22:15 PM on 10 June 2013CO2 effect is saturated
Elsewhere, SASM asked some questions that were snipped for being off topic. They are on topic here, so I will address them. He says:
"Is it true that CO2 is nearly fully saturated in the IR bands? I have read (http://www.skepticalscience.com/saturated-co2-effect.htm) and it clearly shows that CO2 is dimming some IR to space in the 700 to 760 wavenumber bands, which is mid-wave IR around 13-14 um. Brightness is reduced by about 1.5K, but what is this in watts/m^2 or how much warming does this blockage produce? My speculation is that this is not very much. WUWT has a post (http://wattsupwiththat.com/2013/06/08/by-the-numbers-having-the-courage-to-do-nothing/#more-87809) that states that 94.9% of the IR is absorbed by 400 ppm CO2. The increase from 300 ppm to 400 ppm (the amount from early 1900 until now) only blocks 2.3% more than what is naturally occurring (i.e., 92.6% absorption for 300 ppm CO2). Do you all agree with these numbers, and if not what numbers do you have? How much additional warming is directly caused by the increase from 280 ppm to 400 ppm today? Don’t include forcing, feedback, or anything like that – just effects of CO2"
Turning to the WUWT post, it is complete nonsense. It does not indicate how the values of any of its tables were determined, and makes absurd false statements such at that at least 200 ppmv is required in the atmosphere for plant life to grow (CO2 concentrations dropped to 182.2 ppmv at the Last Glacial Maximum, giving the lie to that common claim).
More importantly, the claim that the "...proportional values shown above present are universally accepted by skeptics and Global Warming alarmists alike..." (PDF) is complete bunk. They are not accepted universally by AGW "skeptics" and are accepted by no defenders of climate science. Specifically, the "universally accepted" formula for radiative forcing is RFt = 5.35* ln(ct/c0). That is, the radiative forcing due to CO2 at time, t, relative to time, 0, equals 5.35 times the natural log of the CO2 concentration at time t divided by the CO2 concentration at time 0. The equilibrium temperatue response to that radiative forcing is a linear function of the radiative forcing, so that it follows the same logarithmic relationship.
An immediate consequence of that logarithmic relationship is that the temperature response for a doubling of CO2 concentration is the same for any doubling of CO2 concentration across the range over which that formula is valid (it clearly does not apply for very low values of CO2). That is, if the temperature response for increasing CO2 from 100 to 200 ppmv is X, then the temperature response for increasing it from 200 to 400, or 300 to 600, or 400 to 800, or 500 to 1000 ppmv will also be x.
Contrary to that relationship, however, Hoskins shows the increase from 100 to 200 as being 10.1% of some unknown value; that from 200 to 400 as being 7.3% of the same value; that from 300 to 600 as being 5.2%; that from 400 to 800 as being 4.6%, and that from 500 to 1000 as being 2.1% (PDF). As such his tables contradict the best known, and most widely accepted formula in climate science. Even worse, he then goes on to say that "beyond 1000+ ppmv the effect of increasing levels of CO2 can only ever be
absolutely minimal even if CO2 concentrations were to increase indefinitely." (PDF) That claim is the basis of setting the temperature response to 1000 ppmv as 100%, but is complete bunk. As per the standard formula, the temperature response of an increase in CO2 level from 1000 to 2000 ppmv is the same as the the temperature response for an increase from 100 to 200 ppmv.Hoskins does not even apply his formula consistently. Based on his first table, the increase in temperature for a given increase in CO2 concentration expressed as a ratio of earlier increases should be constant regardless of whether you use IPCC values, or "skeptical" values. Yet in his second table (WUWT post) that condition is not met. In other words, his calculated temperature responses in his second table are inconsistent with those in his first table.
Anyway, with the standard IPCC climate sensitivity of 3 C per doubling of CO2, increasing CO2 from 400 to 1000 ppmv will increase temperature by 3.9 C. That will represent a 5.4 C increase over pre-industrial levels - an increase equivalent to the difference in temperature between the coldest period of the last glacial and the pre-industrial.
-
ajki at 20:49 PM on 10 June 20132013 SkS Weekly Digest #23
Wow, this is a magazine that did understand this "sustainability" thing right by reusing its own covers :-D
May I use the opportunitiy to point the SkS team to one journalist who really tries hard to promote the many difficult issues around global warming and especially the arctic regions: Irene Quaile with her blog "Ice Blog" on dw.de (Deutsche Welle, a state owned broadcast). Throughout the years I've really learned to love her coverage and the great photo material on her blog.
-
Paul Pukite at 14:43 PM on 10 June 2013Lu Blames Global Warming on CFCs (Curve Fitting Correlations)
I commented at #4 with a double-check on Lu's regression analysis. Lu claims he did an analysis where he removed the effects of the solar component. What is interesting is I used his correlation recipe but only sliding by a lag of 9 years and got the same R^2 as he got.
I think this has important implications because his correlation coefficient didn't improve by removing the solar component. This could only happen if it was just a random effect in the first place. IOW, he didn't do a null test, but simply claimed that the solar improved the fit.
I might be missing something, that is why it is nice to have the SkS blog available.
-
Paul Pukite at 14:38 PM on 10 June 2013New study by Skeptical Science author finds 100% of atmospheric CO2 rise is man-made
Using the equatorial SST data for latitudes -6±15 degrees, we can take the Mauna Loa CO2 data and compensate for seasonal outgassing. This has a Henry's Law gain factor of 3 PPM/deg C after applying a lag of 1 month. This simple transformation completely removes the seasonal oscillations, leaving only low-level noise and perhaps a few glitches related to El Nino events (see 1998-1999).

The above figure is the compensated Mauna Loa CO2 data after removing the seasonal IPWP ocean outgassing of CO2. I also placed a polynomial fit as a guid to the eye.

The above figure shows the Indo-Pacific Warm Pool (IPWP) lies within the +9N to -21S SST average. This is the hottest part of the Pacific and should have the strongest activation for CO2 outgassing.
The SST data was taken from a NOMADS server (NOAA Operational Model Archive and Distribution System)
http://nomad3.ncep.noaa.gov/cgi-bin/pdisp_sst.sh?ctlfile=monoiv2.ctl&varlist=on&psfile=on&new_window=on&ptype=ts&dir=The CO2 data was taken from the Mauna Loa records, going back to 1981 to match the archival extent of the SST records
http://www.woodfortrees.org/data/esrl-co2/from:1981I have to say that the available oceanographic and atmospheric data is an amazing resource for debunking claims made by people like Humlum (and don't forget Murry Salby).
-
EliRabett at 12:58 PM on 10 June 2013Lu Blames Global Warming on CFCs (Curve Fitting Correlations)
Chordotonal, the good Professor Lu did not fit a curve, he tortured the poor dear with thick lines until it cried enough. The level of curve fitting was "look at that" without any statistical analysis. Follow the link
-
Tom Dayton at 11:59 AM on 10 June 2013CO2 effect is saturated
Stealth, see also "A Saturated Gassy Argument" part 1 and part 2. For more technical depth, check out Science of Doom; there are several places where saturation is discussed, but you might start with Part Five.
-
scaddenp at 10:45 AM on 10 June 2013Imbers et al. Test Human-Caused Global Warming Detection
And please move further comments to the appropriate thread. Regulars view this site through "comments" link so you comment doesnt get lost. Offtopic comments will be deleted.
-
scaddenp at 10:43 AM on 10 June 2013Imbers et al. Test Human-Caused Global Warming Detection
Stealth, you can play with the numbers yourself with this wonderful calculator. The mathematical introduction in Ramanathan Coakley 1978. Doubling CO2 from 280 adds 3.7W/m2 from CO2 alone.
-
StealthAircraftSoftwareModeler at 10:13 AM on 10 June 2013Imbers et al. Test Human-Caused Global Warming Detection
DSL @43. It seems my comment may have been deleted and I am not sure why. I did ask some questions and you seemed to answer one of them, so it was posted for some time. Perhaps the moderator thought my post was an ad hominem or not on topic or inflammatory. If so, I apologize. I’m not looking to start any flame wars and I am honestly looking for a good discussion.
Let me just completely back up and ask some basic questions:
(-snip-). Thanks! Stealth
Moderator Response:[DB] Your previous comment was moderated out as it contained multiple off topic statements, as does this one. Please take your individual concerns and questions to the most appropriate threads and place them there. The regulars providing dialogue interaction and guidance here will see them, no matter where you place your questions, and will respond as appropriate on those same threads.
-
Esop at 09:26 AM on 10 June 2013New study by Skeptical Science author finds 100% of atmospheric CO2 rise is man-made
This paper from Humlum and similarly nonsensical stuff from the likes of Salby reminds me of the Simpsons episode where Bart is the "I didn't do it" boy. A juvenile display of not being capable of taking any responsibility for own actions. What is next from Humlum and his Norwegian cohorts ? A new paper claiming that humans don't actually emit CO2 at all?
-
P.T. Goodman at 09:26 AM on 10 June 20132013 Arctic Sea Ice Extent Prediction
I found out more than I needed to know about Steve Goddard when he infested a Washington Post Op-Ed called Climate science tells us the alarm bells are ringing by posting 500 comments out of less then 5000 this weekend. Truth be told, I lost count of his comments last night at about 200 but he has been hard at it all day today. Sadly, the Washington Post blogs has very loose moderation standards, so anyone can get away this this stuff. It just makes it impossble to have a real discussion about climate change, but I suppose that is Goddard's goal. They just don't want others talking about climate change.
-
SeaHuck5891 at 01:09 AM on 10 June 20132013 SkS Weekly Digest #22
@ Tom Curtis
Thank you for the response.
-
Tom Curtis at 00:23 AM on 10 June 20132013 SkS Weekly Digest #22
SeaHuck5891 @2, if all CO2 emissions were to cease tomorrow, the atmospheric concentration of CO2 would gradually decline to about 340 ppmv over a couple of centuries or so as the partial pressure of CO2 equalized between the deep ocean and the upper reaches of the ocean. (That ignores, or course, the production of CO2 by the oxidation of methane; but it is a reasonable approximation.) Based on this, if we were to reduce emissions to the equivalent of 0.3 ppmv per annum, ie, about 6% of current emissions we would stabilize CO2 concentration rather than gradually reduce it. Anything more than that would result in a continuing increase in atmospheric concentration.
It should be noted that, first, the 6% figure is a ball park figure only; and second, that there are very good policy reasons to prefer the draw down in CO2 to the constant concentration. Consequently I consider that figure to be largely academic.
-
SeaHuck5891 at 23:38 PM on 9 June 20132013 SkS Weekly Digest #22
I had a conversation about climate change with a friend recently, and the topic of CO2 drawdown came up. My explanation was that roughly 50% of the CO2 emitted by humans is absorbed by natural carbon sinks, thus leaving the remainder in the atmosphere as the "airborn fraction". My confusion started setting in when asked at what level of anthropogenic CO2 emissions can we expect to see no further accumulation in the atmosphere. Is there a level of human emissions that will allow us to cease the upward trend in the Keeling curve? Is it as simple as saying that cutting our emissions in half will suffice? And if the answer to that question is yes, does it follow that any level of emissions below that point will allow for (very, very) gradual drawdown? If there is an appropiate thread for this discussion, I will gladly take it there, but a quick search did not show any results.
-
John Hartz at 23:09 PM on 9 June 2013Lu Blames Global Warming on CFCs (Curve Fitting Correlations)
Geencooling's concerns about the role of HFCs in climate change are shared by the Chinese and US governments as documented in Andrew Revkin's DoT Earth post of yesterday (June 8).
As some environmental analysts had hoped, President Obama and President Xi Jinping of China found room to maneuver on global warming in their California desert retreat. They sidestepped the super wicked issues impeding restrictions of the greenhouse gas of greatest concern, carbon dioxide, and staff released a joint statement on plans to cut releases of hydrofluorocarbons, or HFCs, a potent group of heat-trapping gases.
Source: With CO2 Cuts Tough, U.S. and China Pledge a Push on Another Greenhouse Gas by Andrew Revkin, DoT Earth, New York Times, June 8, 2013
-
michael sweet at 12:37 PM on 9 June 2013Renewables can't provide baseload power
The San Onofre nuclear power plant in Los Angeles is being permanently closed. They were intending to expand generation capacity and installed a badly engineered heat exchanger. They have decided that it is too expensive to fix. Florida still has a broken plant we are paying for. The utility makes 10% on everything they spend on the plant, even if it never generates more electricity.
If it is uneconomic to repair an existing plant, how could it be economic to build a new plant?
Wind and solar keep looking better and better.
Moderators: I couldn't find a better thread for this post. If you suggest one I will repost and this one can be deleted.
-
GreenCooling at 11:23 AM on 9 June 2013Lu Blames Global Warming on CFCs (Curve Fitting Correlations)
Many thanks Dana for correcting the reference to hydrofluorocarbons in the second para just now, but as mentioned in my tweet, it is radiative forcing that has remained roughly stable, the emissions picture is rather more complex. As I've said on the "It's CFCs" thread, and over at Eli's Rabett Run blog, the rapidly rising emissions of HCFCs and particularly HFCs are deserving of more attention in the climate change policy debate.
If anything useful comes from the publication of Lu's discredited theories about CFCs, I hope it's a greater recognition that by phasing out the very high GWP ozone depleting CFCs, the Montreal Protocol has done 5 times as much as the first committment period of Kyoto to reduce radiative forcing emissions. Because the CFCs have very long atmospheric lifetimes (and emissions from 'banks' are larger than projected and lamentably very little is yet being done to prevent them), the halocarbon 'stock' is not declining very much yet, although the 'flow' has been radically reduced.
Alarmingly, the climate benefits acheived by the Montreal Protocol are now threatened by rapidly rising emissions of HFCs used as substitutes for Ozone Depleting Substances, which are increasing at around 9% p.a. (and HCFCs, which although being phased out are still increasing by around 4.3% p.a.). Using the Montreal Protocol to phase out the HFCs is entirely possible with available natural refrigerant solutions (and arguably emerging expensive and less efficient patented synthetic alternatives, for those concerned with protecting the profit margins of the chemical companies responsible for the F-Gas problem). Worthy amendment proposals to achieve a less ambitious "phase down" are up for discussion for the 5th year in a row in Bangkok later this month, and again in November at the Meeting of the Parties. While the EU (and Australia) at the UNFCCC talks are urging the Montreal Protocol to act on these, you need to look hard to find coverage of these proposals.
In both the ABC radio AM piece cited above, and the ABC Science article "CFC Warming Theory Challenged" the climate impact and significance of CFCs, HCFCs and HFCs is not clearly explained and understated. I'm concerned these articles, and the much warranted rebuttals of Lu's paper are contributing to the mistaken notion that the halocarbon problem is fixed.
Extending the Montreal Protocol (and implementing end use bans and carbon pricing mechanisms) to control and reduce use and emissions of HFCs are among the most fast acting and cost effective tools at our disposal for reducing emissions and preserving the significant climate benefits of the Montreal Protocol, yet this remains a complete surprise to most people, even those highly engaged in the climate debate.
Moderator Response:[JH] Would you be willing to expand your excellent comment into a guest article?
-
Tom Dayton at 06:43 AM on 9 June 2013Satellites show no warming in the troposphere
Roy Spencer's latest claim that the tropospheric temperature proves the models wrong, has been aptly shot full of holes by Glenn Tamblyn and others. For example, Spencer compared temperature observations from only the tropics, to model results between 20 and 20 latitudes. Spencer compared model results for the surface, to observations of the "middle troposphere." Spencer's observations of the "middle troposphere" actually are 1/4 from the stratosphere, which of course cools as a consequence of increased greenhouse gases.
-
Tom Dayton at 06:31 AM on 9 June 2013Lindzen's Junk Science
The site What's Up With That Watts? has a point by point dissection of a 2009 lecture by Richard Lindzen: Part 1, Part 2, Part 3.
-
william5331 at 06:27 AM on 9 June 20132013 SkS News Bulletin #15: Alberta Tar Sands and Keystone XL Pipeline
You have to ask yourself why is Canada shipping raw, crude to the US of A. Why don't the refine it into petrol, diesel etc and get the value-added from their product. Not only is the Harper government an ecological disaster, they are economically dumb. You would expect a right wing government to at least have some economic smarts. I wonder how much revenue Canada is actually getting from this whole sorry mess in comparison with how much American companies are making. At least they are in line with former Canadian governments. Read Farley Mowat's book Sea of Slaughter to see how former governments have treated Canadian resources. The only reason Canada is green is that she has so much land with so few people. Until she gets rid of "first past the post" nothing will change.
A Canadian abroad.
-
Alexandre at 02:28 AM on 9 June 2013Scientists use crowd-sourcing to help map global CO2 emissions
I tried to include one from Brazil, (-3,6808037378312144, -38,86519119143486) but it keeps saying "invalid coordinates" or something to that effect.
-
dana1981 at 00:51 AM on 9 June 2013Meet the world's best new environment bloggers
Thanks dorlomin.
-
MA Rodger at 00:29 AM on 9 June 2013The anthropogenic global warming rate: Is it steady for the last 100 years? Part 2.
By way of illustration for the comment @147. ( I assume the graph is visible to all.)

The "minor negative trend" actually is the " the recent slowing of the (global) warming rates" which remain entirely unattributed after the MLR analysis. (Contrary to my comment @147, it would of course subtract from the rate of anything it was attributed to.)
And bar minor excurtions, for just over half the record the HadCRUT4 signal survives unattributed at 50% amplitude. Can this be right?
-
dorlomin at 20:00 PM on 8 June 2013Meet the world's best new environment bloggers
Been reading your stuff on the Guardian and really happy to see it.
Chapeau.
-
MA Rodger at 19:17 PM on 8 June 2013The anthropogenic global warming rate: Is it steady for the last 100 years? Part 2.
KK Tung @137
While the discussion is considering appropriate trends, perhaps it is timely to extend the discussion to the identified trend that T&Zh13 failed to attribute. The Residuals from assuming the QCO2(t) function are shown inset in Figure 3 in Part One of this post where they are described thus:- "Except for s a minor negative trend in the last decade in the Residual, it is almost just noise."
I had wondered if this "minor negative trend" was the " the recent slowing of the (global) warming rates." In T&Zh13 this "slowing" is described as being "included" the "superimposed AMO-related ups and downs," yet the trend within the Residuals suggested to me that perhaps not all this "slowing" had actually been "included." Certainly AMO as per Enfield shows no "slowing" relative to HadCRUT4 that would compensate for the QCO2(t) function (ie the proposed anthropogenic warming contirbution) and this fuelled my curiosity, and prompted my question on this @112 above.Looking myself at those Residuals, the "minor negative trend" extends back further than "the last decade," indeed extending back beyond two decades. And is it "minor"when it has a trend of something like 0.6ºC/century? If such a level of trend were added to the trend in the QCO2(t) function, present-day attributable anthropogenic warming would then be running at 1.7ºC/century, pretty much the same answer that Foster and Rahmstorf (2011) arrived at.
So I suggest the "minor negative trend" is not "minor."
I would also add that it is also wrong (strong word) to describe the rest of these Residuals as "almost just noise." Closer examination shows otherwise. -
Dikran Marsupial at 18:35 PM on 8 June 2013The anthropogenic global warming rate: Is it steady for the last 100 years? Part 2.
KK Tung wrote "Many on this thread worried that some nonlinear part of the trend may still remain in the AMO index thus defined."
Not "may" but "will"; this is self-evident, linear detrending cannot possibly remove a non-linear component of the trend as it is a linear method. Over a short period, a linear trend may be a reasonable approximation to the sum of all anthropogenic and natural forcings (c.f. Taylor series expansion), but on the scale of a century this is clearly not a reasonable assumption.Do you accept that the AMO signal will remain contaminated by any non-linear component of the forcing? If "no", please explain how linear detrending can completely remove the effects of a non-linear contamination.
-
Kevin C at 17:27 PM on 8 June 2013Imbers et al. Test Human-Caused Global Warming Detection
Mal Adapted: That's a great article, thanks for pointing it out. I've suggested to the powers that be that it might be worth a post.
-
Eyal Morag at 15:34 PM on 8 June 2013New study by Skeptical Science author finds 100% of atmospheric CO2 rise is man-made
Real Climate - On Humlum et al.
Humlum find a connection between ENSO and CO2 But don't understand his findings. C. D. Keeling and R. Revelle find and understand this connection at 1985.
El Nino’s effect on CO2 causes confusion about CO2′s role for climate change
Rasmus E. Benestad - Real Climate 11 September 2012
Anyway the same level of logic can find that temp don't connect to CO2 since every year from October to January the CO2 is rising while temp is falling. Just ignore the 1st & 2nd order of CO2 and temp rising.
-
DSL at 13:58 PM on 8 June 2013Imbers et al. Test Human-Caused Global Warming Detection
As far as the CO2 part of the equation goes, I would need to see robust evidence for the proposition that atmospheric CO2 did not absorb/emit at various pressure-broadened bands in the thermal infrared range. Or I would need to see robust evidence that atmospheric CO2 is not actually present in observed concentration.
The only other forcing that can match CO2's persistent (non-condensing, well-mixed, long residence time) forcing is solar variation. I would need to see evidence that falsifies every major assessment of solar contribution of the past two decades (add Pasini et al. 2012, Jones et al. 2013, and Mann et al. 2013).
There can be evidence. There's always the possibility that aliens are manipulating instrumentation. Climate science is one of the most scrutinized sciences. All someone has to do to get a Nobel is falsify a major element of the current mainstream theory of climate, and do it in such a way that removes human responsibility. People have been trying for decades.
I think your characterization of climate science is a little off, as well. The current science lays the foundation for the discoveries of tomorrow, unlike the practice of blood-letting and modern medical practice. Your assertion strongly suggests that current climate science is utterly wrong. Where's the evidence for such an assertion? You talk of clouds and sun, and everything you know about them is blood-letting. Were the Wright brothers blood-letters, or were they useful pioneers? -
Tom Curtis at 11:40 AM on 8 June 2013The anthropogenic global warming rate: Is it steady for the last 100 years? Part 2.
KK Tung @144 says:
"The N. Atlantic mean SST trend is smaller than the global SST trend, and so this subtraction takes out too much. So right there we know there is an error."
I would be fascinated to hear how, a priori, KK Tung knows that absent any change of forcing over the twentieth century the North Atlantic SST would have had a neutral or positive trend. Absent that a priori knowledge, he cannot know that subtracting global SST from North Atlantic SST to determine the AMO is a mistake, or at least not on the grounds he states (ie, the difference in trends). KK Tung may think the absence of forcing guaranttees the absense of trend; but given an unforced oscillation in SST, a trend can be produced by differences in phase over the period of the trend. More importantly, as the AMO is avowedly irregular both as to period and amplituded, such irregularity can produce a trend even the period of the trend is in phase. It appears to me, therefore, that his claimed "error" amounts to no more than a circular appeal to the Enfield's definition, which gives him his "knowledge" of the phase, period and amplitude on which basis he dismisses the Trenberth definition.
Turning to the Enfield definition, the one thing we do know for sure about the AMO is that the Enfield definition is ad hoc. Specifically, different defined lengths over which the linear trend is taken will generate different strengths of the AMO at different times. If we take the period 1880-2010 ad defining the linear trend, for example, all periods prior to 1850 will have a strong positive AMO phase. Because it is ad hoc, we know the Enfield definition is in error. It may, however, be useful over a limited period. That it is more usefull than the Trenberth definition over any period, however, is something that is yet to be shown.
-
KK Tung at 10:30 AM on 8 June 2013The anthropogenic global warming rate: Is it steady for the last 100 years? Part 2.
In reply to Robert Way at post 139: I agree with you. Not knowing what the true AMO is, all these definitions of the AMO index are ad hoc. Enfield's definition of the AMO index involves linear detrending of the N. Atlantic sea surface temperature (SST). Many on this thread worried that some nonlinear part of the trend may still remain in the AMO index thus defined. Many felt strongly that the Trenberth and Shea definition of the AMO index should be used. This index is the N. Atlantic mean SST minus the global mean SST. The assumption of those who thought this definition is more appropriate is that this way the nonlinear anthropogenic trend can be removed. I discussed this issue in part 2 of my post: The N. Atlantic mean SST trend is smaller than the global SST trend, and so this subtraction takes out too much. So right there we know there is an error. Technically the presence of a trend in the regression index also creates a problem of collinearity. An approach that we have taken is to use different methods and hope that the results are consistent. The wavelet method may have its own problems, but these problems are orthogonal to the problem of the MLR as no detrending is involved. Alternatively, we could do the MLR using different definitions of the AMO index. As Robert Way put it, we know that there could be some possible defect with any ad hoc definition we can come up with, but hopefully the true answer may lie in between. Even better if the error bars are small. I will give you a summary of this sensitivity calculation soon.
-
KK Tung at 08:54 AM on 8 June 2013The anthropogenic global warming rate: Is it steady for the last 100 years? Part 2.
In reply to KR at post 140 and 142: I did report the result of MLR using Trenberth and Shea's AMO index. The 50-year anthropogenic trend is 0.1 C per decade. There was a problem with collinearity because that index has a negative trend, and I discussed why it has such a negative trend. I will try to put these sensitivity calculations together, along with a discussion of Ting et al 2009 paper, in a separate post.
I had replied to your question on the Anderson et al paper. As far as I am concerned that issue was settled.
-
Mal Adapted at 07:40 AM on 8 June 2013Imbers et al. Test Human-Caused Global Warming Detection
John Nielson-Gammon gave a talk at last year's AGU meeting on Scientific Meta-Literacy. His key point:
But there’s an important lesson here about how we decide which scientific statements to believe and which ones not to believe. Those of us who are trained scientists but who do not have enough personal literacy to independently evaluate a particular statement do not throw up our hands in despair. Instead, we evaluate the source and the context.
We scientists rely upon a hierarchy of reliability. We know that a talking head is less reliable than a press release. We know that a press release is less reliable than a paper. We know that an ordinary peer-reviewed paper is less reliable than a review article. And so on, all the way up to a National Academy report. If we’re equipped with knowledge of this hierarchy of reliability, we can generally do a good job navigating through an unfamiliar field, even if we have very little prior technical knowledge in that field.
Well, the typical member of the public has very little retained technical knowledge about just about everything. I claim that it’s an impossible task to raise the level of climate literacy in the general public to the point where most can tell that the statement about the ice age is wrong, let alone whether the statement about Sandy is wrong. And what about all the other fields in which they need to be literate as well?
The solution to this problem is not scientific literacy, but what I call scientific meta-literacy. Forget that dream about enabling the public to independently evaluate scientific claims on their merits – that’s just not going to happen. Instead, enable the public to distinguish between reliable and unreliable sources of scientific information.
Skepticism is all very well, but it's important to understand that it takes work to become an expert, and if you're not willing to do the work, you have little choice but to trust the ones who have. A genuine skeptic recognizes and respects expertise. Otherwise, he risks falling prey to the Dunning-Kruger effect.
-
william5331 at 06:10 AM on 8 June 2013New study by Skeptical Science author finds 100% of atmospheric CO2 rise is man-made
"Humlum had just disproved the conservation of mass" Who says scientists don't have a sense of humor. Priceless.
-
KR at 05:54 AM on 8 June 2013The anthropogenic global warming rate: Is it steady for the last 100 years? Part 2.
Dr. Tung - My apologies, I linked to entirely the wrong paper in this comment: I meant to refer to the Ting et al 2009 discussion on PCA separation of internal variability and anthropogenic contributions.
-
Bob Loblaw at 05:29 AM on 8 June 2013Lu Blames Global Warming on CFCs (Curve Fitting Correlations)
The stratospheric cooling associated with increasing greenhouse gases is not a new idea. It shows up in 1-D radiative-convective modeling work in the 1960s. Two such early studies are:
-
John Hartz at 05:29 AM on 8 June 2013Lu Blames Global Warming on CFCs (Curve Fitting Correlations)
Chordotonal has recused himself from positng on SkS.
-
Tom Dayton at 05:27 AM on 8 June 2013Lu Blames Global Warming on CFCs (Curve Fitting Correlations)
Chordontonal, you seem to be unaware of... well, the entirety of climatology. So you consistently have made comments that are entirely off base (e.g., wrong, not even wrong), as you try to apply your general knowledge of science and philosophy. I suggest you start by learning the history of the science behind our knowledge of global warming. Then learn more about the fundamental physics of the greenhouse gas effect--physics that are known from actual experiments in the lab and observations in the field. Physics knowledge that was established without any thought to humans increasing global warming.
Prev 884 885 886 887 888 889 890 891 892 893 894 895 896 897 898 899 Next


