


 Arguments


Recent Comments
Prev 894 895 896 897 898 899 900 901 902 903 904 905 906 907 908 909 Next
Comments 45051 to 45100:
-
JasonB at 11:56 AM on 22 May 2013Skeptical Science Study Finds 97% Consensus on Human-Caused Global Warming in the Peer-Reviewed Literature
barry,
I think you (and others I saw at the earlier link you posted) are getting hung up on the "> 50%" figure, when that is not the outcome of the survey, it was a tool for categorising a certain subset of papers.
The title of this post says:
Skeptical Science Study Finds 97% Consensus on Human-Caused Global Warming in the Peer-Reviewed Literature
The first sentence is:
A new survey of over 12,000 peer-reviewed climate science papers by our citizen science team at Skeptical Science has found a 97% consensus among papers taking a position on the cause of global warming in the peer-reviewed literature that humans are responsible.
The graphic says:
97% of climate papers stating a position on human-caused global warming agree global warming is happening and we are the cause.
The email sent to authors asked them to state whether their paper endorsed the proposition:
that human activity is causing global warming
Every one of them is consistent. Not one of them mentions the >50% figure. Why? Because the point of the exercise is whether global warming is happening and we are the cause.
The only reason categories 1 and 7 exist is because some papers actually quantify the various causes, and so in papers that quantify the human contribution, the rule was > 50% counts as an "endorse" while < 50% counts as a "reject". That's all.
If the graphic said "97% of climate papers state that humans are responsible for > 50% of global warming" then you'd have a point, but it doesn't. As I said, the numbers 1..7 are not meant to be interpreted as a confidence levels, or degrees of agreement with the proposition, but merely to categorise the manner in which the agreement or rejection was expressed in the paper. The fact that the authors of 97.2% of the papers that stated a position claimed that their paper agreed with the proposition and the reviewers of the abstracts found that 97.1% of those that stated a position agreed with the proposition is very strong evidence to me that they used the same interpretation.
I don't agree that this should be seen merely as a matter of opinion or interpretation. The email is very clear. The paper is also very clear. The only thing I would change is the word "level" rather than "category" since that is apparently confusing some people.
Dana's comment is also saying the same thing.
-
barry1487 at 11:27 AM on 22 May 2013Skeptical Science Study Finds 97% Consensus on Human-Caused Global Warming in the Peer-Reviewed Literature
Jason,
we are agreed that different interpretations are possible. This is a weakness of the consensus statement sent in the email, and the ratings scheme. The only way I can think to test for differences is to email all the Authors who rated to clarify that they though was meant by options 2 and 3. A subset of respondants should give a clue.
Because if a good number of respondants interpreted as I, Zeke Hausfather and a number of other reasonable commenters did, then the bar for them was much lower than yours/Cook et al, and this would significantly weaken the results. For example, Cook et al's claim that their ratings were more conservative than the original Authors' would be undermined.
Consider Dana Nuticelli's comment at another blog on the Cook et al ratings as he sees it.
Note that if a paper said humans are causing less than 50% of global warming, or that another factor was causing more than 50% (or ‘most’, or some similar language), we put it in our rejections/minimization of the human influence category. Our basis was the IPCC statement that humans have caused most global warming since the mid-20th century. But if a paper simply said ‘human greenhouse gas emissions are causing global warming’, that went into the endorsement category as well. After all, there’s no reason for most climate research to say ‘humans are causing >50% of global warming’ (except attribution research), especially in the abstract.
If you just want to get into the quantifications, as Bart notes, nearly 90% agreed that humans are the main cause of global warming.
http://ourchangingclimate.wordpress.com/2013/05/17/consensus-behind-the-numbers/#comment-18747
Huh? If a paper (abstract) simply said anthro GHGs are causing global warming (with no quantification), that went into the endorsement category. It seems that the raters (or Dana at least) assumes that any paper that endorses the notion of GHGs causing global warming, perforce endorses a >50% human contribution.
-
Dumb Scientist at 11:04 AM on 22 May 2013Has the rate of surface warming changed? 16 years revisited
Oops... "less uncertain" should be "less certain." Sorry.
-
KR at 11:02 AM on 22 May 2013Has the rate of surface warming changed? 16 years revisited
jmorpuss - I believe this topic was discussed ad nauseum (and dismissed due to actual evaluation of energy levels) in earlier, more appropriate threads.
-
jmorpuss at 10:58 AM on 22 May 2013Has the rate of surface warming changed? 16 years revisited
Dumb Scientist OK then I'll retract the word large scale and replace it with what was stated large number, Just read it all and come back with something relavent to the paper. You may need a refressure cource in how electric and magnetic fields interact LINK " If the electron enters the field at an angle to the field direction the resulting path of the electron (or indeed any charged particle) will be helical as shown in figure 3. Such motion occurs above the poles of the earth where charges particles from the Sun spiral through the Earth's field to produce the aurorae. " Quote directly from Schoolphisics article. So all that is needed is a manetron, masser or laser to generate and beam electrons into a system and you will increase the magnetic part of the wave and its force.
Moderator Response:[RH] Fixed link that was breaking page format.
-
Dumb Scientist at 10:31 AM on 22 May 2013Has the rate of surface warming changed? 16 years revisited
jmorpuss: Large scale in terms of the global energy budget? I doubt it, and don't see any such claim in that paper.
-
jmorpuss at 10:21 AM on 22 May 2013Has the rate of surface warming changed? 16 years revisited
Dumb Scientist @7
Do you think man contributed to the unsetled period from the 80's to 97 In the introduction to this accepted paper in 98 http://hal.archives-ouvertes.fr/docs/00/31/64/49/PDF/angeo-16-1212-1998.pdf states that the time period disgused coinsides with the same period were large scale weather modification was carried out. Don't you think these experiments would have corrupted the data from this period? This is only one experiment in that time period , does anyone have links to other experiments carried out in the time period being disgused.
-
Bert from Eltham at 10:19 AM on 22 May 2013Skeptical Science Study Finds 97% Consensus on Human-Caused Global Warming in the Peer-Reviewed Literature
The best analogy I could think of to describe the current situation of the large gap between the publics' knowledge and published climate scientists is the knowledge gap between the passengers of a very large airliner and the flight crew.
Would you board an aircraft where the passengers have a vote on what control inputs should be used at all times. These votes would be open to the most shrill passengers that made the most noise without any knowledge or evidence. Even if the full instrument panel was displayed on all the screens in the passenger compartment the passengers do not even have the slightest idea of what they all mean. The self appointed 'knowledgeable' passengers who are not trained pilots are a cacophony of conflicting interpretations of how to fly the aircraft. They cannot even agree amongst themselves how their 'expert' opinions should be implemented.
This is the situation Space Ship Earth finds itself in.
The first aircraft to fly from England to Australia was a Vickers Vimy Bomber flown by Keith and Ross Smith in 1918. Their call sign was GEAOU. Both Keith and Ross (not related) jokingly said it stood for God 'elp all of us! Bert
-
Rob Honeycutt at 10:14 AM on 22 May 2013The anthropogenic global warming rate: Is it steady for the last 100 years? Part 2.
Dr Tung... You first hit the "insert" tab above the comment text box. That where you find the little tree image for image insertions.
-
KK Tung at 10:10 AM on 22 May 2013The anthropogenic global warming rate: Is it steady for the last 100 years? Part 2.
Post 88: My figure insertion did not work. I will try later. Any advice on how to do it?
Also the statement was a little confusing. In the AR4 projection comparing with the observed temperature, the latter has gone out of the model 95% range of all the scenarios shown. In Ed Hawkins' figure showing CMIP5 model projections since 2005, the observation has gone out of 90% of the model range.
Moderator Response:[RH] You need to have the image hosted somewhere and then use the image insertion tool (the little tree).
-
KK Tung at 10:06 AM on 22 May 2013The anthropogenic global warming rate: Is it steady for the last 100 years? Part 2.
In reply to post 85 by Dikran: You asked for a figure. I hope my attempt at inserting a figure to a post here works this time: The first figure is from AR4, and the projection was made in 2000. The projection has gone out of the model 95% range of the scenarios shown. The grey band is supposed to be observational uncertainty. The second figure is from CMIP5 by Ed Hawkins. The projection was made in 2005. The more recent projection is almost getting out of the 90% range.
Moderator Response:[RH] Whoops. Sorry. The image actually has to be hosted somewhere.
-
Dumb Scientist at 09:26 AM on 22 May 2013The anthropogenic global warming rate: Is it steady for the last 100 years? Part 2.
If the true anthropogenic response is linear, but we used a nonlinear regressor that increases faster after 1950, then the residual will show a negative trend after 1950 when it is only supposed to contain noise. When the trend from the residual is added back the combined trend becomes linear. [KK Tung]
Again: I've repeatedly pointed out that the form of the anthropogenic regressor or adding the residual back is not the problem that concerns me. Again, you're implying that anthropogenic warming can only appear in your residual or anthropogenic terms, not your AMO term. I think it could go into your AMO term if anthropogenic warming is nonlinear. So do papers like Enfield and Cid-Serrano 2010, etc.
In order for our result of a steady anthropogenic warming to be self consistent with our choice of the AMO index...
... nothing has to be true. Your result is always consistent with your choice of AMO index because that choice made your result inevitable. Regressing against the linearly-detrended AMO, which is highly correlated with global surface temperatures, causes any non-linearity to be absorbed by the AMO(t) function. The fact that you get answers which are "very close" regardless of using linear or nonlinear anthropogenic indices to suggest that the regression is more sensitive to the highly correlated AMO(t) function.
But please continue.
... the net anthropogenic forcing needs to be approximately linear without the ups and down in your red-dashed curve. We claimed that that is not unreasonable given the uncertainty in the aerosol component.
You've previously claimed that aerosol time evolution is so uncertain that a linear total anthropogenic forcing lies within its error bars. MA Rodger already asked where that uncertainty bound can be found, and I second his request.
We are more certain that anthropogenic warming affects the secular trend, but much less certain that it affects the oscillatory part. We know the former because the N. Atlantic temperature trend is less than the global mean trend, and that can be explained by...
... the fact that the N. Atlantic is filled with water, which has a higher specific heat than the rock making up some of the globe and the fact that oceans can evaporate without limit to shed heat. The land making up some of the globe can (and is) doing that, but those pesky severe droughts limit evaporative cooling on land.
Your mechanism probably plays a role too, especially if the N. Atlantic is compared to other oceans.
The other competing theory is to attribute the oscillatory part to the variations of the AMOC. The mechanism involves the Arctic ice melt and SST feedback on the formation of deep water. This theory is self consistent. The model simulations were consistent with observation. It could also be shown wrong given further evidence, but none of your arguments do it.
I'm not disputing that the AMO exists, and AMOC variations seem like a plausible mechanism. I'm just disputing your curve-fitting claim that ~40% of the warming over the last 50 years can be attributed to a single mode of internal variability, when Isaac Held and Huber and Knutti 2012 used thermodynamics to conclude that all modes of internal variability couldn't be responsible for more than about 25% of the warming. Even if the 10% limit from Anderson et al. 2012 is somehow wrong... didn't you say Isaac Held is one of the most respected climate scientists? I agree.
-
Tom Dayton at 08:45 AM on 22 May 2013Skeptical Science Study Finds 97% Consensus on Human-Caused Global Warming in the Peer-Reviewed Literature
I just attended a talk by James Hansen at NASA Ames Research Center. One of his main points right up front is that a big part of the problem is the large gap between climate scientists' knowledge and public perception of that knowledge.
-
KK Tung at 08:33 AM on 22 May 2013The anthropogenic global warming rate: Is it steady for the last 100 years? Part 2.
In reply to post 78 by Dumb Scientist: You have so many questions in one comment and I have to wait until I have a block of time to answer them. Often one question is convoluted with another and my answers may run the danger of further confusing the readers. You also prefer black and white, yes or no answers. In climate sciences, much is unclear. Let me try the best I could to convey to you my thinking. Your questions involve two groups. One group concerns the linearity of net anthropogenic forcing, and the other group concerns the AMO index.
In part 1 of my post, I attempted to address the claim you raised in your original post that our use of linear regressor (as a placeholder only in the intermediate step) in our multiple linear regression to arrive at an anthropogenic response that is almost linear is circular. This was a technical question and the way I rebutted that claim was to show that our methodology does not depend on what we used for the anthropogenic regressor. We showed this by using a regressor that is not linear. In fact we showed a few such examples. We showed that our procedure is not sensitive to using linear or nonlinear regressors for anthropogenic forcing as long as we add back the residual to the regressed signal. If the true anthropogenic response is linear, but we used a nonlinear regressor that increases faster after 1950, then the residual will show a negative trend after 1950 when it is only supposed to contain noise. When the trend from the residual is added back the combined trend becomes linear. Of course we do not know that the true anthropogenic response is linear, but this example is used here just to illustrate the procedure. This is intended as a technical rebuttal to your claim that our result follows from our assumption of a linear regressor for anthropogenic forcing. This technical rebuttal does not really address what the real anthropogenic forcing is and did not address the choice of the AMO index, the latter does affect the regressed anthropogenic response, as you correctly pointed out. The AMO part was discussed in part 2 of my post.
So what is the shape in time of the net anthropogenic forcing? We know the radiative forcing from the greenhouse gases well (your blue line), but the net forcing has other components that subtract from the greenhouse gas part. They include tropospheric sulfate aerosols, which are highly uncertain. In order for our result of a steady anthropogenic warming to be self consistent with our choice of the AMO index, the net anthropogenic forcing needs to be approximately linear without the ups and down in your red-dashed curve. We claimed that that is not unreasonable given the uncertainty in the aerosol component. This is not an assumption but a proposal. No one knows what the net anthropogenic forcing is with certainty. Therefore there is no inconsistency at our current stage of understanding.
On the AMO index and answering your two questions: Of course anthropogenic forcing can affect the North Atlantic temperature and hence the AMO index, no matter how you define it. It can affect both the secular trend of the N. Atlantic mean temperature and the multidecadal oscillation on top of the secular trend. We are more certain that anthropogenic warming affects the secular trend, but much less certain that it affects the oscillatory part. We know the former because the N. Atlantic temperature trend is less than the global mean trend, and that can be explained by the AMOC (Atlantic Meridional Overturning Circulation) slowing down secularly by the basin-wide warming, with the warm and less saline water sinks less at the Atlantic Arctic. So the Atlantic secular trend has a part that is a direct basin-wide warming by anthropogenic heating and a part that is a result of a change in the AMOC brought about by the warming. The two oppose each other.
At this point one can construct two competing theories. One involves anthropogenic forcing being responsible for both the secular part and the oscillatory part of the N. Atlantic mean temperature. Since the greenhouse gas forcing increase is secular, it cannot be responsible for the oscillatory part of the Atlantic temperature variability. So it falls upon the uncertain tropospheric aerosol to do the job. One needs to come up with an argument on why the aerosol forcing should have such an oscillatory behavior, and builds a model to demonstrate that such variations are sufficient for producing the observed oscillatory response. This job was not attempted by CMIP3 models, but Booth et al (2012) has put forth their HadGEM-ES2 model that produces an oscillatory multidecadal variability. Although the model response in other ocean basins and in subsurface Atlantic are not too consistent with the available observation, I would not rule out this theory, a theory for a forced AMO-like behavior in observation.
The other competing theory is to attribute the oscillatory part to the variations of the AMOC. The mechanism involves the Arctic ice melt and SST feedback on the formation of deep water. This theory is self consistent. The model simulations were consistent with observation. It could also be shown wrong given further evidence, but none of your arguments do it.
-
Dumb Scientist at 08:28 AM on 22 May 2013Has the rate of surface warming changed? 16 years revisited
First, the uncertainty added by the delayed effect would have to be larger than decreased uncertainty due to removing the more certain immediate effect.
To clarify, this would only be true for timespans that overlap with the immediate volcanic effect.
-
Dikran Marsupial at 08:09 AM on 22 May 2013The anthropogenic global warming rate: Is it steady for the last 100 years? Part 2.
Prof. Tung wrote "The CMIP3 models, which do not need internal variability to explain the accelerated warming since 1980, have projections that overshoot the observation in the recent decades, beyond the 95% range."
Please could you provide some supporting evidence for this statement, as far as I am aware, the observations currently lie well within the 95% range of the CMIP3 models (click on the image to access the source).
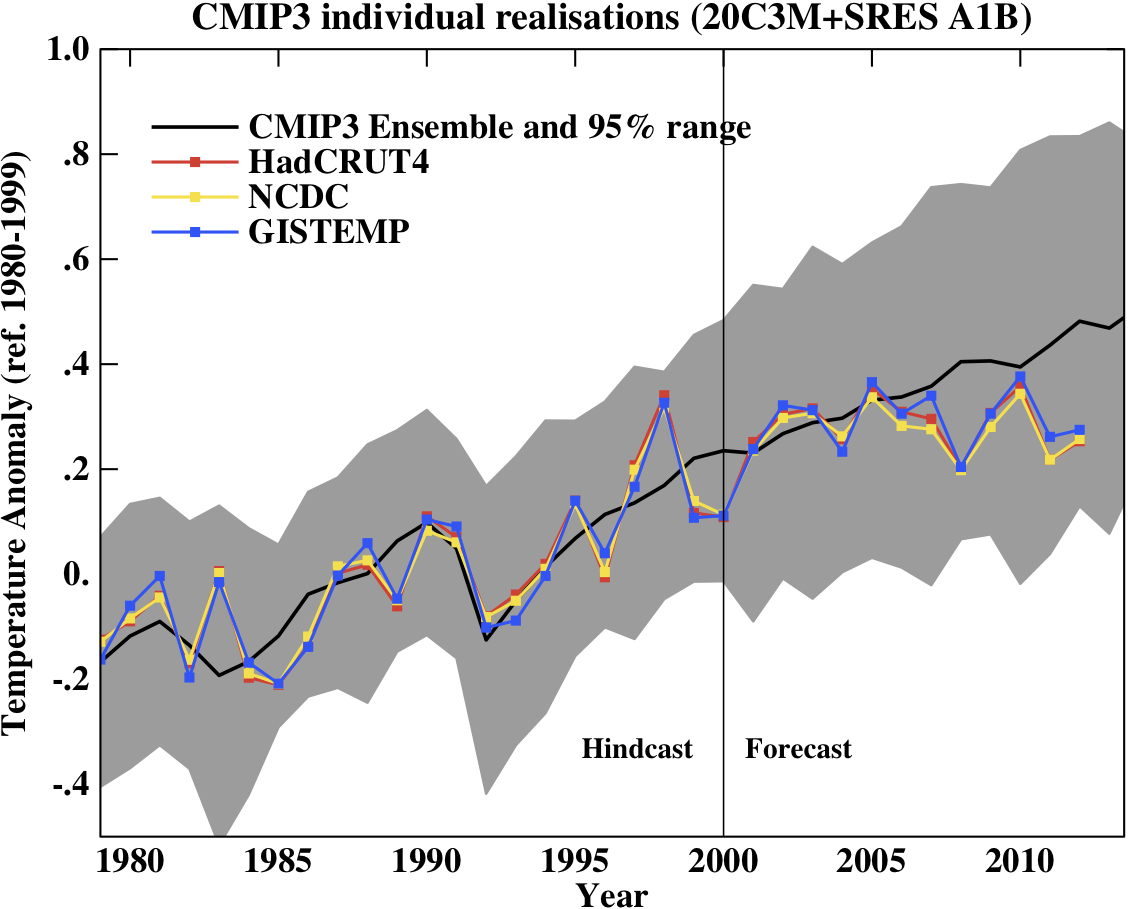
Last year I downloaded the model runs and was able to reproduce this figure with acceptable accuracy, so I am confident that it is correct (except for the last year of the observations).
-
Dumb Scientist at 07:55 AM on 22 May 2013Has the rate of surface warming changed? 16 years revisited
The volcanic signal however can vary a lot with the duration of the effect (depending of the timing of volcanoes with respect to your trend period). As a result, I suspect that applying the volcanic correction actually increases the uncertainty in the trend of the adjusted series, because of the uncertainty in the correction. This shows up in the huge difference in the adjusted trend between the 16 years and Hansen calculations. [Kevin C]
Sadly, I don't know much about this debate over the duration of volcanic aerosol effects. However, I was impressed by how well Pinatubo's aerosol effects were modelled (page 2), which ironically comes from Hansen et al. 2006.
Perhaps the volcanic effect could be viewed as the sum of an immediate effect (which seems to be more certain) and a delayed effect (which seems to be less uncertain). Kind of like how earthquakes have both co-seismic and post-seismic effects.
Your video removed the immediate volcanic effect, which probably reduces the uncertainties on the trend. The delayed effect might have been insufficiently removed, which means that some of the delayed effect joins all the other confounding factors that haven't been removed. That doesn't seem like a reason to withdraw the video.
Now, this is a particular problem for the video because the video made two very specific claims concerning uncertainty: Firstly that for the adjusted data the recent trend was not significantly different from the older trend, and secondly that the recent trend was highly significant (i.e. different from zero).
One thing I didn't like about the video was that you showed the trends with no uncertainties. It might be better to show them as in the SkS trend calculator. But that's just nitpicking on my part.
Regarding the first claim. I think it's important to stress, as I did in my first comment, that the recent trend isn't statistically significantly different from the older trend even when using the unadjusted data.
Even without taking the values of the trends into account, these claims are compromised. If the uncertainty in the adjusted trend is large, the first claim is rendered meaningless and the second claim false. That is the basis for withdrawing the video.
I doubt that the uncertainty of the adjusted trend is larger than that of the unadjusted trend. First, the uncertainty added by the delayed effect would have to be larger than decreased uncertainty due to removing the more certain immediate effect. I haven't done the calculation, but the graph on page 2 makes me suspect that's not true.
Second, that difference would have to be bigger than the decrease in uncertainty due to removing ENSO and solar variations.
-
MA Rodger at 07:37 AM on 22 May 2013The anthropogenic global warming rate: Is it steady for the last 100 years? Part 2.
KK Tung @80.
I would suggest that the tiny up-tick at the end of the black trace (which is evidently HadCRUT3 annual data) makes this HadCRUT3 to at least 2005, not 2004.
Moderator Response:[JH] Mispelling of Dr Tung's name has been corrected.
-
Kevin C at 07:07 AM on 22 May 2013Has the rate of surface warming changed? 16 years revisited
Dumb Scientist: I think you've hit the nail on the head - reducing the uncertainty in the trend is the key part of Foster and Rahmstorf. But I disagree with your conclusion about the video. Here's why:
The Foster and Rahmstorf calculation reduces the trend uncertainty because it takes out a lot of the confounding factors which act as noise in the trend calculation. However, the uncertainty in the result does not arise from the deviations from linearity alone - it must also account for uncertainty in the adjustments which have been made. So if you are uncertain about the duration of the volcanic response, that needs to be figured into the adjusted trend. (Propogating the uncertainties is possible but not easy - I haven't done it.)
So how uncertain are the contributions? The ENSO term seems very robust - it's comes out much the same whatever calculation you do. So the ENSO-removed temperature series will indeed give trends with reduced uncertainties.
Solar is a bit less certain, but it's not very large.
The volcanic signal however can vary a lot with the duration of the effect (depending of the timing of volcanoes with respect to your trend period). As a result, I suspect that applying the volcanic correction actually increases the uncertainty in the trend of the adjusted series, because of the uncertainty in the correction.
This shows up in the huge difference in the adjusted trend between the 16 years and Hansen calculations.
Now, this is a particular problem for the video because the video made two very specific claims concerning uncertainty: Firstly that for the adjusted data the recent trend was not significantly different from the older trend, and secondly that the recent trend was highly significant (i.e. different from zero).
Even without taking the values of the trends into account, these claims are compromised. If the uncertainty in the adjusted trend is large, the first claim is rendered meaningless and the second claim false. That is the basis for withdrawing the video.
I'd really like to wait for new results on coverage and SST bias before redoing the video (it was a lot of work), but it's a shame to lose the educational material about contributions to the temperature trend.
-
KR at 06:55 AM on 22 May 2013The anthropogenic global warming rate: Is it steady for the last 100 years? Part 2.
Dr. Tung - "...I think I have answered your questions in part 2 of my post, in the last section"
I would strongly disagree; Bob Loblaws' points about the circularity in definition of temperature from temperature (or rather, the difficulty of distinguishing between components of the same measure) are unaddressed - forcings have not followed a linear trajectory over this century, hence a linear detrending of the AMO is guaranteed to leave external forcing in that definition. (Aerosol uncertainties, I will point out, do not linearize total forcings.)
Enfield and Cid-Serrano 2010, who you refer to as support for your methods (as I noted before), consider Trenberth and Shea 2006 correct about the failings of a linear detrending, and they instead use a quadratic detrending - a much closer fit to the upwards acceleration in total forcings over the last century. Ting et al 2009 using EOF analysis find that linear detrending is inappropriate for an AMO definition, and they "...argue that the globally averaged surface temperature appears to be a good proxy for the temporal march of externally forced variability and that most of the latter is globally synchronous, albeit nonuniform spatially".
I therefore cannot consider a linearly detrended AMO appropriate in a global warming attribution study - that is contradicted by a significant part of recent literature, as aliasing significant portions of the forced signal.
As a separate piece of evidence, the thermodynamic considerations pointed to by Anderson et al 2012 and by Issac Held (thank you for that interesting reference, Bob) argue that the 40% contribution to warming found with a linearly detrended AMO is inconsistent with observed ocean heat content by a factor of 2-4x. OHC is a constraint upon internal variability, and a 40% internal variability fails that constraint. I'm disappointed that you have not responded to that issue in any fashion.
---
It would be quite interesting to evaluate and compare the attribution percentages under other definitions of the AMO (detrended with global MST or a quadratic, for example) - and whether such estimates are consistent with external constraints such as OHC. But I believe there are significant issues with the attributions you have derived in the current work, issues coming from the AMO definition used - issues which require consideration.
-
Dikran Marsupial at 06:41 AM on 22 May 2013The anthropogenic global warming rate: Is it steady for the last 100 years? Part 2.
Prof. Tung There is no statistically significant evidence for a change in the underlying rate of warming since 1998, so I think it is not scientifically correct to claim there has been a hiatus in global mean surface temperatures since then. The statistical power of the appropriate hypothesis test would be even lower for a trend starting in 2004. As OHC has continued to rise, it seems clear that the apparent hiatus is likely to be due to transport of heat between surface and deep oceans, and so it would be unwise to assume that the apparent hiatus means anything with regard to the forced response. However I think it would be better to discuss this sub-topic on the other thread that Dumb Scientist mentioned so as not to dilute the discussion of the paper.
In short, in order to claim there has been an actual hiatus in warming, rather than merely an artefact of the noise, that hypothesis should be subjected to a formal statistical hypothesis test. The eye is only too prone to seeing patterns in noise that don't actually exist, which is why as scientists we use statistics.
Moderator Response:[Dikran Marsupial] link added to make the more appropriate thread for this topic easier to locate.
-
Bob Loblaw at 06:33 AM on 22 May 2013The anthropogenic global warming rate: Is it steady for the last 100 years? Part 2.
Dr. Tung @80:
Your last section says "It is in the same spirit that the AMO index, which is a mean of the detrended North Atlantic temperature, is used to predict the global temperature change." [Emphasis added]
As Dumb Scientists has given a far more detailed discussion you may wish to respond to, I will temporarily step back again by saying that "in the same spirit" is not particularly convincing. You may have good intentions, and you may have some insight as to why you think that the AMO is good enough, but you haven't conveyed it here and it is a hugely important assumption.
On the other hand, Dumb Scientist is providing a much more convincing argument as to why your methodology causes problems.
-
wingding at 06:30 AM on 22 May 2013Has the rate of surface warming changed? 16 years revisited
good question. Has the rate of surface warming changed?
There are many ways of looking at that question. Dumb Scientist above points out one method. Another, more inferior, method is to just compare how longterm trend has actually changed with more data. Using skepticalscience trend calculator and HadCRUT4:
The 1970-2000 trend is 0.169 +- 0.056C/decade
The 1970-present trend is 0.164 +- 0.031C/decade
There's no major change there then.
A better way of looking at it using GISTEMP is this animation from Tamino which shows there is no inconsistency with the prior rate of warming:
http://tamino.files.wordpress.com/2012/12/giss.gif
The important feature of all three of these methods is that they compare two periods. This cuts to the heart of the question "has warming stopped" or "has warming slowed down". To answer that you need to compare some statistic of a recent period with the same statistic of a prior one.
But in contrast the popular method, that pushed by fake skeptics, involves just analyzing a single period. Just sticking a trend line through a recent period (eg 1998-present) and declare it has no warming with no comparison to a prior period (or at least no mention of the confidence ranges).
Fake skeptics have been banging this drum so much that I am afraid even many scientists are being influenced into believing faulty conclusions repeated often based on incorrect methods for assessing warming trends.
-
KK Tung at 06:21 AM on 22 May 2013The anthropogenic global warming rate: Is it steady for the last 100 years? Part 2.
In reply to post 77 by MA Roger: My typo. Not 17 years. Some said the hiatus is since 1998, but I don't want to count that because 1997/8 was a warm El Nino. I personally would say the broad leveling off of warming is since 2004/5. You cannot see the leveling off in Figure 9.5, which is up to 2004. The figure up to 2011 using HadCRUT4 is in our paper. 2012 is now available, and it is even lower.
-
KK Tung at 06:14 AM on 22 May 2013The anthropogenic global warming rate: Is it steady for the last 100 years? Part 2.
In reply to post 75 by Bob Loblaw: I think I have answered your questions in part 2 of my post, in the last section.
-
Dumb Scientist at 05:49 AM on 22 May 2013The anthropogenic global warming rate: Is it steady for the last 100 years? Part 2.
In my first post, I discussed the uncertainty regarding the net anthropogenic forcing due to anthropogenic aerosols, and why there is no obvious reason to expect the anthropogenic warming response to follow the rapidly increasing greenhouse gas concentration or heating, as DS seemed to suggest. [KK Tung]
I suggested that anthropogenic forcings were faster after 1950. In response, you discussed logarithms and aerosols that were already taken into account in the IPCC radiative forcings chart I originally linked:

Then you linked to that same forcings chart and linked to another:
 - radiative forcings")
The estimates you linked both show that anthropogenic forcings increased faster after 1950. So do the GISS and Potsdam estimates. Perhaps all these estimates are wrong, but you can't prove them wrong by assuming linearity for anthropogenic forcing.
We did not assume linearity for anthropogenic forcing. In the post we used a number of nonlinear anthropogenic indices. [KK Tung]
Again: You regressed global surface temperatures against the AMO in order to determine anthropogenic warming. Because the AMO is simply linearly detrended N. Atlantic SST, this procedure would only be correct if AGW is linear. Otherwise you'd be subtracting AGW signal, sweeping some AGW into a box you've labelled "natural" called the AMO.
Physical justification of AMO being mostly natural or anthropogenically forced needs to precede the choice of the index. This was what we did in our PNAS paper. [KK Tung]
I already addressed this point: Removing the AMO to determine anthropogenic warming would only be justified if detrending the AMO from 1856-2011 actually removed the trend due to anthropogenic warming.
There is a concern that the AMO index used in our multiple regression analysis is a temperature response rather than a forcing index. Ideally, all predictors in the analysis should be external forcings, but compromises are routinely made to account for internal variability. [KK Tung]
Predictors are compromised to the extent that warming the globe also changes those predictors. Not all such compromises are created equal.
The solar forcing index is the solar irradiance measured outside the terrestrial climate system, and so is a suitable predictor. Carbon dioxide forcing is external to the climate system as humans extract fossil fuel and burn it to release the carbon. Volcanic aerosols are released from deep inside the earth into the atmosphere. In the last two examples, the forcing should actually be internal to the terrestrial system, but is considered external to the atmosphere-ocean climate system in a compromise. [KK Tung]
These barely qualify as compromises. Global warming doesn't force humans to burn fossil fuels. Also, there's no published mechanism (that I know of) linking global warming to volcanic activity.
Further compromise is made in the ENSO "forcing". ENSO is an internal oscillation of the equatorial Pacific-atmosphere system, but is usually treated as a "forcing" to the global climate system in a compromise. [KK Tung]
This is more of a compromise, as I noted: "Even though global warming might indirectly affect ENSO, it's important to note that it hasn't yet: the ENSO index doesn't have a significant 50-year trend. This means it can be subtracted without ignoring AGW."
Because ENSO doesn't have a significant multidecadal trend, this ENSO compromise can't (and doesn't) ignore AGW over multidecadal (i.e. climate) timescales.
It is in principle better to use an index that is not temperature, and so the Southern Oscillation Index (SOI), which is the pressure difference between Tahiti and Darwin, is sometimes used as a predictor for the ENSO temperature response. [KK Tung]
I agree: it's better to use an index that isn't temperature.
However, strictly speaking, the SOI is not a predictor of ENSO, but a part of the coupled atmosphere-ocean response that is the ENSO phenomenon. In practice it does not matter much which ENSO index is used because their time series behave similarly. [KK Tung]
It wouldn't matter much even if you forgot to regress against ENSO altogether, because ENSO doesn't have a significant multidecadal trend. Regressing against ENSO primarily reduces the uncertainties on the recent multidecadal trend; it doesn't significantly change that trend.
It is in the same spirit that the AMO index, which is a mean of the detrended North Atlantic temperature, is used to predict the global temperature change. It is one step removed from the global mean temperature being analyzed. [KK Tung]
The AMO index is a seriously compromised predictor because warming the globe also warms the N. Atlantic, and anthropogenic forcing is faster after 1950. I've obviously failed to communicate this point, which is why I asked you two questions:
Question 1
Would regressing global surface temperatures against N. Atlantic SST without detrending the SST remove some anthropogenic warming from global surface temperatures?
Yes or no?
Question 2
Now suppose we regress global surface temperatures against N. Atlantic SST after linearly detrending the SST. In other words, we regress against the standard AMO index as Tung and Zhou 2013 did.
Just imagine that anthropogenic forcings increased faster after 1950. In that case, would regressing global surface temperatures against the AMO remove some anthropogenic warming from global surface temperatures after 1950?
Yes or no?
I'll start: my answers are yes and yes. In fact, I think answering yes to question 1 also implies a yes to question 2, but I'm willing to be educated.
Since you never answered these questions, I have to guess at your answers:
By "the upward trend of the AMO" I assume you are referring to the North Atlantic mean SST, because AMO is supposed to be detrended. I agree that anthropogenic forcing can force an upward trend in the N. Atlantic mean SST. In fact I am quite certain of it. [KK Tung]
Linearly detrended, which means that nonlinear anthropogenic forcing can force a recent upward trend in the AMO. Regardless, your certainty seems to imply that you'd answer "yes" to my question 1. That's fortunate, given that N. Atlantic SST are highly correlated with global surface temperatures:

You've repeatedly pointed out that you used a nonlinear anthropogenic index, and that the result is "very close" to the result using a linear index. Perhaps that's why you think that it's possible to answer yes to question 1 but no to question 2?
If so, I disagree. Because N. Atlantic SST and global surface temperatures are so highly correlated, I think bouke was right to point out that any other predictor will just be a distractor. I suspect that's why you get answers that are "very close" regardless of the assumed anthropogenic index. Unfortunately, I haven't found your code online, and don't have the time to independently reproduce your methodology.
There is a very nice blog by Isaac Held of Princeton, one of the most respected climate scientists, on the AMO debate here. [KK Tung]
I also respect Isaac Held, which is why I linked that post as well as this one:
"... While the specifics of the calculations of heat uptake over the past half century continue to be refined, the sign of the heat uptake, averaged over this period, seems secure - I am not aware of any published estimates that show the oceanic heat content decreasing, on average, over these 50 years. Accepting that the the sign of the heat uptake is positive, one could eliminate the possibility of [the fraction of the temperature change that is forced] < ~3/4 ..." [Isaac Held]
Note that Isaac Held's analysis is based on thermodynamics, not curve-fitting the AMO. As such, when he claims that the fraction of the temperature change over the last 50 years due to internal variability is less than ~25%, he's summing over all modes of internal variability, not just the AMO. As I've discussed, this is essentially the same conclusion reached by Huber and Knutti 2012.
As KR noted, Anderson et al. 2012 says that less than 10% of the warming over the last 50 years could be due to internal variability.
Your claim of ~40% is inconsistent with studies that base their claims on thermodynamics rather than curve-fitting.
You probably are aware of the discussions on the recent hiatus in warming for the past 17 years. [KK Tung]
I'm aware that there hasn't been a statistically significant change in the surface warming rate.
-
MA Rodger at 05:49 AM on 22 May 2013The anthropogenic global warming rate: Is it steady for the last 100 years? Part 2.
@76 - "You probably are aware of the discussions on the recent hiatus in warming for the past 17 years."
I cannot say that I am.
"...the past 17 years" you say? Would that be 1996-2013? Where abouts on AR4 fig 9.5a is there such a "hiatus" evedent (bearing in mind that AR4 fig 9.5a shows "the observation ... (black curve)" to 2005 if not 2006)?
-
Tom Dayton at 05:12 AM on 22 May 2013Has the rate of surface warming changed? 16 years revisited
I agree with Dumb Scientist, that there is no reason to withdraw the video. Don't let the perfect be the enemy of the good!
-
KK Tung at 04:25 AM on 22 May 2013The anthropogenic global warming rate: Is it steady for the last 100 years? Part 2.
In reply to post 73 by Jason B and post 74 by Dikran: I accept your position. I understand that this is a necessary step for you before we can move forward. I was just becoming impatient because I was trying to make two simple points about Figure 9.5 in AR4, and then use the time available to go back to reply to some of the interesting (to me at least) comments that were posted here. I barely made the first point about that figure before being distracted.
The first point is, we can use the model ensemble mean as a proxy for the forced response in the observation. Since the observation contains both forced response and internal variability, comparing the ensemble mean from a model and the observation may tell us something about the presence of the internal variability. I saw the possibility of internal variability explaining about half of the observed early twentieth century warming. This is not a firm conclusion because afterall the models may contain systematic errors. If the models were perfect, this impression could be made into a firmer conclusion.
The second point concerns comparing Figure 9.5a with Figure 9.5b (the figure is shown in post 65 by JasonB), still assuming that the model ensemble mean serves as a proxy for the forced response in the observation. The interpretation is that in the second half of the twentieth century, CMIP3 models used by AR4 produced all the observed warming by anthropogenic forcing. Without anthropogenic forcing, Figure 9.5b shows that the all-model ensemble mean (the blue curve), has no warming or even negative warming. Figure 9.5a shows that with anthropogenic forcing, the all-model ensemble mean reproduces the observation very well (compare the blue red curve with the black curve). Since we all agreed earlier that the observation should contain internal variability as well as forced response, this is telling us that the AR4 models do not need internal variability to simulate the observation during the second half of the twentieth century.
You probably are aware of the discussions on the recent hiatus in warming for the past 17 years. A possible explanation is that that is caused by internal variability. The CMIP3 models, which do not need internal variability to explain the accelerated warming since 1980, have projections that overshoot the observation in the recent decades, beyond the 95% range. While we could still take the position that this is fine, because one can always add back internal variability when we need it to explain the difference, it becomes rather awkward to only insert an internal variability that cools for the past 17 years and not a warming internal variability during the period of accelerated warming. In any case, we do not have a coherent sense of the internal variability in the warm vs cool episodes in the observation.
-
Dumb Scientist at 03:40 AM on 22 May 2013Has the rate of surface warming changed? 16 years revisited
A few months ago I calculated trends and uncertainties for the UAH data. The second page of that PDF has a black line for the trends of the UAH data up to 2012 for different starting years. The red lines are 95% confidence uncertainty bounds which account for autocorrelation with ARMA(1,1) noise. Notice that the larger uncertainty bounds of more recent trends overlap with the smaller uncertainty bounds of the longer trends. This means that there hasn't been a statistically significant change in the surface warming rate. Here's the R code if anyone's interested.
It's even easier to use the SkS trend calculator to confirm that there hasn't been a statistically significant change in the surface warming rate. Here's an example:
GISTEMP, 1990-2000: 0.201 ±0.322 °C/decade
GISTEMP, 2000-2010: 0.096 ±0.256 °C/decade
Note that the error bars overlap, showing that there hasn't been a statistically significant change in the surface warming rate. I've tried many datasets with many potential change points, and so far all their error bars overlap.
As you say, the total energy content of the climate is a more direct measure of global warming. It's also worth pointing out that global land ice and global sea ice continue to decline, absorbing heat without warming as they melt.
Troy's analysis is interesting; I'm still reading it. However, I don't think it's necessary to withdraw the video. In my view, Foster and Rahmstorf 2011 was merely trying to improve the signal-to-noise ratio of the surface temperature record by accounting for some extraneous influences. I even pointed out that other influences like multidecadal oscillations haven't been removed.
But that's not a fatal flaw, because it's impossible to remove all extraneous influences. Similarly, when a better estimate of the long-term effects of Pinatubo becomes available, that will build upon previous work rather than demolishing it.
-
Bob Loblaw at 03:13 AM on 22 May 2013The anthropogenic global warming rate: Is it steady for the last 100 years? Part 2.
Dr. Tung.
OK. Let's follow up on my comment in #71, and apply it to your study. I am not an expert on AMO, but from what I have read here, I would state the following:
- temperature can be classified as an observation
- pressure can be classified as an observation
- I'd even be content classifying the pressure difference between two locations as an "observation" - e.g., Southern Oscillation Index based on Tahiti-Darwin - so when it comes to linking an oscillation (ENSO) to temperatures, SOI is a methodologically-independent observation and it is appropriate to use it to try to explain temperatures.
AMO, which from descriptions here and in the NOAA link is described as a detrended areal average of temperatures, is not an observation. It is an interpretation of a rather large number of observations, and it includes processing that removes part of the signal contained in the original observations (the detrending).
Once you start using that interpretation of the data as if it is an "observation", and then attempt to use your analysis to deternine the portion of the observed temperatures that is attributable to AGW, then you are at risk of making errors. The AMO, as an interpretation, has built-in assumptions. The detrending has changed the character of the information contained in the result (as compared to the original temperature observations). The averaging and detrending are based on a statistical model, and the remaining values (the AMO) represent the parts that the model doesn't remove or smooth.
Now, if your goal is to get people to accept your conclusions, then you are going to have to go back over the steps from observation, through interpretation, to your conclusions. You are going to have to provide an analysis that clearly demonstrates that the result you want us to believe is not affected by the assumptions (especially detrending) that are inherent in the application of processing/modeling to derive the AMO.
From what I have read here and elsewhere on the web, this is a serious methodological flaw, and you have not addessed the criticisms that have been made here. Please go back over Dumb Scientist's original post, and the comments to both it and your two posts, and address the issue of the detrending that is done in deriving the AMO.
This is not quibbling about definitions of words. The distinction between "observations" and "interpretations" is essential. You are attempting to explain temperatures using temperatures, which seems unsupportable - it involves a circularity that is hidden because you appear to be forgetting that AMO is not an observation. -
HJones at 03:13 AM on 22 May 2013Skeptical Science Study Finds 97% Consensus on Human-Caused Global Warming in the Peer-Reviewed Literature
@ Kevin C 165,
Unless you know that the first 100 are representative of the 300, you can't make any comment on the 300. You can't assume anything. For all you know in your example is that right handed pirates hear better, so came forth with their reply before the left handed pirates did, or conversely, the left handed pirates hear better and come forward right away, and there is only three of them in total.
-
CBDunkerson at 02:10 AM on 22 May 2013A Detailed Look at Renewable Baseload Energy
JvD, did you stop reading after the part of my message you quoted or did you just decide to repeat the same false claims anyway?
You do realize that no matter how many times you claim that this page (or my response) is misleading because it says renewables will be cost effective "in no short order" or that "money is no object" the actual page itself will always still say;
"However, detailed computer simulations, backed up by real-world experience with wind power, demonstrate that a transition to 100% energy production from renewable sources is possible within the next few decades."
and
"In Part II of the study, J&D examine the variability of WWS energy, and the costs of their proposal. J&D project that when accounting for the costs associated with air pollution and climate change, all the WWS technologies they consider will be cheaper than conventional energy sources (including coal) by 2020 or 2030, and in fact onshore wind is already cheaper."
Right? So no matter how many times you claim, "SkS ignores this [cost] question", it will never be true.
-
miffedmax at 01:47 AM on 22 May 2013Has the rate of surface warming changed? 16 years revisited
No, no, no. This isn't how the game is played. If some of your evidence is incorrect, you don't withdraw it, you shout it louder.
(I am on a Heartland-friendly site, aren't I?)Moderator Response:[RH] Changed all caps to bold. (Per commenting policies.)
-
Dikran Marsupial at 01:40 AM on 22 May 2013The anthropogenic global warming rate: Is it steady for the last 100 years? Part 2.
Prof. Tung, I don't think we are wasting our time either. It is unfortunate that misunderstandings ocurr sometimes, but we wouldn't be so thorough in trying to get to the bottom of them if we didn't think understanding the science properly was important.
-
BillEverett at 20:10 PM on 21 May 2013Help close the consensus gap using social media
Will the consensus project website be made available in different languages (similarly to some of the SkS material)?
-
JvD at 19:20 PM on 21 May 2013A Detailed Look at Renewable Baseload Energy
"As you concede, it is possible to achieve global 100% renewable energy... with current technology. It would just be very expensive."
If money is no object, anything is possible, obviously. This does not add understanding. The impression people are going to take home from SkS's various webpages on renewables is that renewables will 'plausibly' replace fossil fuels in no short order. This is a patently false and dangerous impression which directly harms the fight to stop AGW, by fostering complacency and motivating people like the German's to recklessly trash their own high-quality nuclear energy sector.
It may be worthwhile to look at the case of the Ozone Hole problem of the last century. Scientists discovered that popular chemicals used at the time as refrigerants for cooling applicatios were causing massive damage to the ozone layers. Therefore, policy was phased in to eliminate the use of these chemicals. Slowly, these are being phased out which has cause the ozone hole to stop expanding. (it has yet to start shrinking BTW).
Now, the interesting thing about the Ozone Hole problem was that the cost of switching to non-ozone depleting refrigerants was only a few percent compared to BAU. But even these few percentage point costs required global cooperation and law-making in order to realise the necessary switch.
Now, a project to make renewables cover for baseload would require backup, storage and renewables build out, which would increase the cost of baseload electricity generation by at least 100% in the best case, and possibly up to 500% or more (f.e. when considering countries like France who currently have 80% nuclear electricity costing about 3 ct/kWh.)
Considering how slow and difficult it has been to *begin* solving the ozone hole problem - which after all involved adding only a few percentage point costs to refrigeration by switching to chemicals that were only a tiny bit more expensive - how "plausible" is it really that we will switch tot non-co2 emitting energy generators that will cost from 100% to more than 500% more than current?
This question is the interesting question to tackle. It is not interesting to conclude that renewable energy can meet baseload as long as money is no object. That is elementary. The question is whether it is able to do it when money is an object. What if people and competitive economies demand that the cost of energy does not rise more than a few percent over baseline? What then? SkS ignores this question and thereby fosters complacency IMHO.
-
Rob Painting at 18:16 PM on 21 May 2013Another Piece of the Global Warming Puzzle - More Efficient Ocean Heat Uptake
Dissident - that's not how the ocean circulation works. During La Nina-dominant (negative Pacific Decdal Oscillation [PDO]) global weather, such as that since the mid 90's, tropical easterly trades winds intensify. The mid-latitude ocean gyres spin faster and, due to convergence in the centre of the gyres, Ekman pumping (the downward transport of heat) is stronger. Stronger downward transport of water mass must be balanced by upwelling somewhere else, and this occurs in regions of divergence (Ekman suction) - along the equatorward travelling arms of the gyres, and along the equator itself. In the Pacific Southern Hemisphere this region of upwelling occurs along the coast of South America - the Humboldt Current.
So what we would expect to happen, during La Nina-dominant (negative PDO) global weather, is a stronger Humboldt Current and more productive fisheries there as nutrients, which support phytoplankton blooms, are sucked up from the deep. A weakening of the easterly trade winds will not only reduce the heat going into the deep ocean and lead to greater surface ocean warming, but it will weaken the Humboldt Current, weaken Ekman suction, and the fishery will not be as productive because of diminished nutrient availability.
-
JasonB at 17:54 PM on 21 May 2013Skeptical Science Study Finds 97% Consensus on Human-Caused Global Warming in the Peer-Reviewed Literature
What makes you think I took offence? Surprised, maybe, that people post without reading first, but not offended.
As I said in the earlier comment I pointed you to, there's nothing "special" about the 12,000 papers that were manually rated. They are simply what was left after applying the earlier filters. Manual rating was required to filter out the irrelevant papers from that set in order to arrive at what was actually desired, namely, the set of papers that were relevant to the question at hand, which was to determine the percentage of papers in the scientific literature that endorsed the consensus position that "human activity is causing global warming" vs the percentage of papers in said literature that rejected that position. The size of that set of papers with respect to the size of set of papers that required manual rating is mildly interesting but irrelevant. After all, with sufficient effort, they could have simply manually checked all scientific papers during that period, which should not have changed the relevant percentages but which would have reduced the percentages you're interested in to minuscule values. The purpose of the filtering was to make the problem tractable, that's all.
Note that I am not an author of the paper. I, like many others, participated in the online rating exercise announced here a few weeks ago to get a taste of what was involved. I suggest you have a go, because by doing so you'll quickly realise the true nature of the papers that end up being rated neutral and why they don't make statements about the cause of global warming, contrary to your current expectations, but you'll need to try the more recently announced exercise instead, which appears to be very similar, because the former has already closed.
-
Dikran Marsupial at 17:30 PM on 21 May 2013Skeptical Science Study Finds 97% Consensus on Human-Caused Global Warming in the Peer-Reviewed Literature
Using the search facility on TCP for papers on "downscaling" gives
0 papers that explicity endorses and quantifies AGW as 50+%
6 that explicitly endorses but does not quantify or minimise
35 that implicitly endorses but does not minimise
46 that take no position
0 that implicity minimise or reject AGW
0 that explicitly minimises or rejects AGW but does not quantify
0 that explicitly minimises/rejects AGW at less than 50%
0 that are undecided
Which is pretty much what you would expect if you knew that downscaling was an area of research in climate change that had relatively little to do with attribution, and that scientists tend only to draw conclusions on issues that are directly addressed by the paper. I suspect the paper I co-authored would have been rated as "no postion" or "implicitly endorses but does not minimise", and three of my co-authors are from the Climatic Research Unit at UEA. You have a mistaken view of the motivations of scientists, scientific publications are generally rather understated. -
JasonB at 17:24 PM on 21 May 2013Skeptical Science Study Finds 97% Consensus on Human-Caused Global Warming in the Peer-Reviewed Literature
barry,
The proposition put to the authors in the email is "that human activity (i.e., anthropogenic greenhouse gases) is causing global warming (e.g., the increase in temperature)", as you quoted. They were asked to assign the level of endorsement of their paper to the proposition that human activity is causing global warming. If you read the description of each level you'll see that the difference between 1, 2, and 3 is not how strongly they agree with that proposition, nor what percentage of human involvement there is, but rather the manner in which that endorsement was expressed.
In other words, it is not that level 1 is "I am absolutely certain that humans are responsible for > 50%" and level 3 is "I'm reasonably sure that humans are responsible for > 50%" (i.e. degree of confidence), or that level 1 is "Humans are responsible for > 50%" and level 3 is "Humans are responsible for > 10%" (i.e. degree of responsibility), but rather than level 1 is explicitly stating the percentage of human responsibility and it is greater than 50% while level 3 is implicitly assuming human responsibility.
Now it's possible that different people have different interpretations of the phrase "is causing", but to me it implies it is the major component, i.e. > 50%, and the authors of 97.2% of the papers with a position on AGW responded to the proposition that human activity is causing global warming by saying their paper endorsed that proposition, either by explicity quantifying the degree of human involvement, by explicitly stating that humans are causing global warming, or by implying that humans are causing global warming.
If they felt their paper disagreed with that proposition, then levels 5, 6, and 7 were available for them to show how it expressed that disagreement.
-
engineer8516 at 17:18 PM on 21 May 2013Skeptical Science Study Finds 97% Consensus on Human-Caused Global Warming in the Peer-Reviewed Literature
@ Kevin...You didn't understand my post at all. I don't disagree with the 97% number. It's like voting if people don't vote they're not part of the total so u use the subset that actually voted. But that's not my point. Please read my comment 162 to understand what I'm talking about. Whatever, it was just my opinion on the topic anyway.
-
Dikran Marsupial at 17:12 PM on 21 May 2013Skeptical Science Study Finds 97% Consensus on Human-Caused Global Warming in the Peer-Reviewed Literature
Engineer wrote "Why? If those papers are on the topic of climate change ... and the authors support AGW, then I would expect them to mention human CO2 emissions"
I can give you an example with which I am familiar. I have done some work on statistical downscaling (essentially trying to work out how climate change will effect sub-regional scale climate from the larger scale climate projections provided by GCMs). As this only looks at the statistical relationships between large scale and sub-regional climate it is pretty much independent of the cause of the climate change. This means that there is no specific need to take a stance on the cause of the climate change as it isn't directly relevant to the methods described in the paper. Some papers do mention emissions scenarios (IIRC the paper I authored [which isn't in the survey] does, but I can't remember if it explicitly attributes any proportion of climate change to anthropogenic emissions), and some don't, basically at the author sees fit.
Something worth bearing in mind is that scientific papers are generally written for other scientists, not for the general public,and they definitely are not generally written to resolve common myths in climate blogs (although there are exceptions). As a result, they tend not to state the bleedin' obvious, and they tend not to draw conclusions on topics that are not directly supported by the evidence presented in the paper. In the case of a downscaling paper, the results basically show how well you can predict historical local climate from supra-regional climate, so it doesn't in itself say anything about the cause of climate change, even though the authors fully agree with the mainstream position on attribution.
Essentially, not all papers on climate change are on the question of what causes how much of it, so not all papers explicitly make a statement on attribution.
I look forward to your answer to Cap'n Bluetooth's conundrum ;o)
-
barry1487 at 17:02 PM on 21 May 2013Skeptical Science Study Finds 97% Consensus on Human-Caused Global Warming in the Peer-Reviewed Literature
Thanks to Tom.
Re-reading the thread at Lucia's, I see Zeke Hausfather reads the ratings much as I did, and I know he's no dummy. So if he did, and I did (and some others at Lucia's), how many original authors did?
Regarding Tom' points, if original Authors believed that options 2, 3, 5 and 6 were not related to >/<50% influence, but qualitative statements, then that may have a significant impact on results expected under the rubric given here. Almost everyone agrees, including the (better-informed) skeptics, that AGW is real and happening. This is the public perception that John Cook has stated he is combatting with this paper - that AGW is real and happening, which public announcements may also have confused me and others as to what the consensus position is that the paper is investigating.
A concise statement in the abstract of what the "consensus position" is as investigated by the paper would have obviated a considerable amount of confusion.
-
Kevin C at 16:37 PM on 21 May 2013Skeptical Science Study Finds 97% Consensus on Human-Caused Global Warming in the Peer-Reviewed Literature
Captain Bluetooth is also confused about the consensus
Arg, me hearties, I've been learnin' me numbers. Need to divvy up the booty fair 'n square. Burden of bein' a cap'n, an all.
A week past I got cut in a fight with Leftie Jake. So I got to wonderin', what proportion of sailor dogs is right handed?
So I calls the crew on deck, all three 'undred men, and I asks 'em "Which hand do you dogs like to use yer cutlass in?".
Ninety seven of them says "Right". Two says "Left". Roberts says "Both", the blaggard.
The other two hundred? They're cussin' me and yelling "I've only got one 'and". Except for two-hooks Jim who fixes me a stare that's blacker 'n pitch.
So this is what's puzzlin' me. Is the proportion of sailor dogs that's likely right 'anded 97% (ninety seven of an 'undred), or 32% (ninety seven of three 'undred).
Engineer: Can you explain Captain Bluetooth's confusion?
-
sidd at 14:53 PM on 21 May 20132013 SkS Weekly News Roundup #20B
Before expressing strong opinions on the Cheung(2013) paper, one might want to read it ?
1)Impact of increasing fish exploitation:
In the quote below, LME = Large Marine Ecosystem and MTC = Mean Temperature of Catch
"Second, fishing efforts in many LMEs have been increasing con-
tinuously since the 1970s. This coincided with increases in SST, result-
ing in strong correlation between changes in SST and fishing effort in
some LMEs. However, there is no evidence that fishing systematically
alters MTC. Specifically, significant but weak relationships between
maximum body size (positively related to vulnerability to fishing, in
general) and the temperature preference of exploited species is found
in only 19 LMEs, with the majority (13) of them showing a positive
relationship, suggesting that the increasing MTC trend was not a result
of the depletion of large fish by fishing that was reported by many
fisheries (Supplementary Information)."2)"What species will move to the warmest waters? To where will the coldest water species migrate?"
None and nowhere. See Figure 1 (which is available at no charge, as is the Supplementary information). The red curves in the panel on the left show local extinction.
sidd
-
Tom Curtis at 14:30 PM on 21 May 2013Skeptical Science Study Finds 97% Consensus on Human-Caused Global Warming in the Peer-Reviewed Literature
Barry, very briefly (and for the last time for a while):
1) Lucia's argument that the IPCC consensus in 1990 was not that greater than 50% of warming due to anthropogenic factors is valid. The concensus position has evolved over time, a factor not properly recognized in the concensus project. How significant is that? Well, using the figures from Carrick's "scrape" of the data, I excluded all affirmations prior to 2001 but did not exclude any rejections. The result: Affirmations are 97.5% of the sum of all rejections and 2001 to 2011 affirmations. So, even if we exclude all affirmations prior to 2001 because the consensus position was not as well developed then, the result still stands.
2) Further, I also tried excluding all implicit affirmations (but no rejections) from the result. The result is that affirmations are still >80% of the sum of affirmations and rejections in all years, and average 95.35% of the sum of affirmations and rejections in all years. It cannot seriously be believed that 100% of implicit ratings are false positives, even on the stricter criterion that the projects participants believed applied (and rated according to). But even on that absurd assumption it makes nearly no difference to the result.
3) You are correct that authors may have used a less strict interpretation of the criteria than the abstract ratings. If true, however, it would merely partially explain why author ratings rated the papers as far more supportive of the concensus, and would have no implications about the validity of the abstract ratings.
So, even allowing absurd amounts of credence to the arguments of Mosher and Lucia, the actual impact on the result is minimal. Lucia keeps on saying she will get around to producing numbers to analyze her intuitions. Frankly, if she were serious she would not blog on the subject until she produced those numbers. I believe she relies on the fact that gullible people will accept her mere pointing to a possible flaw as thereby establishing a fatal flaw in the paper. In reality, however, she is at best nitpicking.
Finally, you can find out all the numbers you need for your own analysis by going to the searchable database and searching each distinct category (by year, rating and topic) with the search term "i". It takes about half an hour to get full tables of the data.
Bye now for a month or so.
-
engineer8516 at 14:16 PM on 21 May 2013Skeptical Science Study Finds 97% Consensus on Human-Caused Global Warming in the Peer-Reviewed Literature
that's why I thought the 97% consensus was overemphasized.
-
engineer8516 at 14:06 PM on 21 May 2013Skeptical Science Study Finds 97% Consensus on Human-Caused Global Warming in the Peer-Reviewed Literature
@ Jason B.
Climate change is a sensitive topic and proponents of AGW do mostly support drastic cuts in emissions. I don't know why you took offense to that statement.
Anyway, 7,930 papers (66%) had No AGW position. 1,339 of these were then self rated and of the 1,339 36% were self-rated as no position on AGW. Since you worked on the paper...How many of the No AGW Position papers and self rated No AGW Position were on the topic of climate change?
You're wondering why I consider the overall percentage number to be relevant. It is interesting that 66% of the overall 12,000 and 35% of the 2,142 respondents had no stated AGW position in their paper. Why? If those papers are on the topic of climate change (I don't know if they are that's why I asked the above question) and the authors support AGW, then I would expect them to mention human CO2 emissions because a) humans are driving climate change through emissions and b) we're running out of time and scientists have to convince governments that humans are behind climate change so we don't kill ourselves.
and reason number 2 doesn't cut it for me. " 2) frankly, every scientist doing climate research knows humans are causing global warming. There's no longer a need to state something so obvious. For example, would you expect every geological paper to note in its abstract that the Earth is a spherical body that orbits the sun?" The paper itself and the UIC survey cited above refute this. I doubt you can find a geologist that doesn't believe that the Earth is a spherical body orbiting the sun. just my 2 cents.
-
barry1487 at 13:58 PM on 21 May 2013Skeptical Science Study Finds 97% Consensus on Human-Caused Global Warming in the Peer-Reviewed Literature
KR and Jason,
"Two comments, with the understanding that the "concensus on AGW" means AGW as the dominant force behind global warming:"
"If the abstract says anything that can be interpreted as "human activity is <50% responsible for global warming" it would have automatically shunted it into category 5, 6, or 7"
It seems I have been labouring under a misapprehension, then. But I wonder if I am alone in that. The email sent to original authors makes no mention of the consensus being about degree of warming. The Endorsement statement in the email only mention humans contributing, not being a primary source.
Endorsement: The second drop down indicates the level of endorsement for the proposition that human activity (i.e., anthropogenic greenhouse gases) is causing global warming (e.g., the increase in temperature). Note: we are not asking about your personal opinion but whether each specific paper endorses or rejects (whether explicitly or implicitly) that humans cause global warming:
Then they get the 7 rating options, 2 of which are quantified, and the other 5 are qualified. The Author reading the email it must infer that all 7 ratings are under the rubric of >/<50% human influence, rather than (as I did) view the remaining 5 ratings as qualitative, rather than quantitative options. Scientists must make an assumption about that because it is not expressly stated, and in the manner that it is stated in the email, it does not mention degree of human influence at all.
Neither is it in the abstract of the paper. In fact, apart from options 1) and 7), only one sentence of the paper does mention degree of human influence, in the last sentence of the introduction. I find this confusing. The abstract mentions of the consensus position infers a simple accept/reject AGW. Eg,
"Among abstracts expressing a position on AGW, 97.1% endorsed the consensus position that humans are causing global warming."
Throughout the paper, apart from the one sentence in the intro, the values are tied to the phrase "the consensus" or similar.
Read straight, this could easily include a human contribution of less than 50%, and options 2, 3, 5 and 6, are qualitative options, and nothing to do with >/<50% hmuan contribution. IE, If an abstract seems to minimize the importance of the human contribution and gives no qantification, then it is rated 5 or 6, and if it emphasises the importance of the human contribution, but does not quantify, then it should be rated 2 or 3. (It's a shame a breakdown of ratings results is not included in the study/supplementary)
My concern now is, that with different interpretations of the consensus statement (and different scientific societies and position statements also word the consensus differently, some only going as far as saying that human activity is contributing to global warming), the original Authors may have rated as I did, applying to all but options 1 and 7 a qualitative interpretation of abstracts.
Possibly I am just ignorant or not too bright. They said so at Lucia's, where I have been arguing, against them there, that the 97% result has come from a simple accept/reject AGW. I really do find it incredible that 97% of abstracts endorse >50% human influence, implicatively or otherwise.
BTW, are any of the authors commenting here? It would be great if they did and identified themselves (unless they prefer anonymity), so that they could clear up misunderstandings.
Hey, John Cook, come straighten us out.
Prev 894 895 896 897 898 899 900 901 902 903 904 905 906 907 908 909 Next


