


 Arguments


Recent Comments
Prev 896 897 898 899 900 901 902 903 904 905 906 907 908 909 910 911 Next
Comments 45151 to 45200:
-
Dikran Marsupial at 23:56 PM on 22 May 2013The anthropogenic global warming rate: Is it steady for the last 100 years?
I thought I would have a go at testing Prof. Tungs method via a simple thought experiment, where we can have ground truth. I've used MATLAB, so I'll add code snippets and diagrams as I go. I should however point out that it is possible that I have misunderstood the method, in which case hopefully setting things out very explicitly will help Prof. Tung to identify where i have gone wrong.
Lets assume that that anthropogenic emissions have been rising quadraticaly
anthro = 0.00002*(T + T.^2);
where T is time and goes from 1 to 150 years in the diagrams shown below. Rather than model ENSO, volcanic activity and solar forcing separately, for convenience, we can lump them all together as a single term "natural", and we will make it sinusoidal to keep things simple.
natural = 0.1*sin(2*pi*T/150);
For the sake of this thought experiment, I shall assume that AMO actually has no effect at all on global mean surface temperatures, so the observations are an equal combination of anthro and natural and some additive Gaussian noise
observations = anthro + natural + 0.1*randn(size(T));
Now lets assume that AMO is actually a consequence of anthropogenic and natural forcings/variability, so it is correllated with the observations, but only because the observations and AMO have shared causes.
AMO = 0.4*anthro + 0.6*natural;
Now this presents a stren test for Prof. Tung's method, but if his method is sound, it ought to still be able to deduce the correct anthropogenic forcing even in this case. If we plot everything, we get this:

Note I have set up my thought experiment, so the observations are vaguely similar to the actual observations.
The next step is to linearly detrend AMO, which can be easily achieved via linear regression:
X = [ones(size(T)), T];
beta = (X'*X)\X'*AMO;
AMOd = AMO - beta(2)*T;
Plotting the detrended AMO gives this:

Now linear detrending obviously does not remove the all of the effects of anthro from AMO as anthro is quadratic. Also if natural has a linear trend over the period considered, then that also will have an effect on the detrending.
We can now perform the regression analysis, where the means have been subtracted from the explanatory variables so that any offset in the observations are explained by the bias term, rather than using the explanatory variables.
X = [ones(size(T)) anthro-mean(anthro) natural-mean(natural) AMOd-mean(AMOd)];
beta = (X'*X)\X'*observations;We can look at the values of beta that we have extracted, and we find
beta = [0.1577; 0.6382; 0.1927; 1.1731]
Note that the regression model is using AMO to explain more of the variation in the observation than it uses anthro or natural, even though the observations are in no way causally dependent on AMO! The true set of regression parameters are:
beta = [0.1577; 1.0000; 1.0000;0.0000]
We know that by construction. This is a good illustration of why using regression methods for attribution is tricky. In this case, the problem is co-linearity. AMOd is correlated well with the observations, in face more so than anthro or natural are individually, and regression is a correlation based method.
We ccan then find the output of our regression model
model = X*beta;
and plot it, giving

So we can see that the regression model (blue) "explains" the observations (green) almost as well as the true model does.
The last step is to find the deduced anthropogenic forcing. My interpretation of Prof. Tungs explanation given in the post above is that we first find the residuals
residual = observations - model;
compute their least-squares trend
X = [ones(size(T)), T];
BETA = (X'*X)\X'*residual;and adding the trend in the residuals to the deduced anthro
infanthro = beta(2)*anthro + BETA(2)*T;
but if you do that, you get

where you can see that the deduced anthro is much less than the true anthro, which suggests that Prof. Tungs method is not reliable.
UPDATE: If we exactly deduct the anthropogenic influence on the AMO using
AMOd = AMO - 0.4*anthro;
then we get more or less the correct answer:

which suggests that the way in which the anthropogenic influence on the AMO is accounted for is very important, and linear detrending is unsatisfactory unless the anthropogenic forcing actually is linear.
I have also noticed that in both cases, the trend of the residuals is to all intents and purposes zero, so adding the trend of the residuals to a*anthro(t) as Prof. Tung suggests has only a negligible effect on the outcome.
Now I should stress, there are at least two possible explanations, either (a) Prof. Tung's method isn't reliable or (b) I have not propely understood or implemented Prof. Tungs method for my thought experiment. I try to be a self-skeptical sort of person, so I am assuming (b) is more likely. Hopefully Prof. Tung can point out the problem, providing MATLAB (or other) code for the thought experiment would be a really good way of getting his idea accross efficiently.
Moderator Response:[Dikran Marsupial] Oops, one error found already,
infanthro = beta(1)*anthro + BETA(2)*T;
should of course have been
infanthro = beta(2)*anthro + BETA(2)*T;
The penultimate figure has been updated to take this into account, sorry for the confusion.
-
barry1487 at 23:48 PM on 22 May 2013Skeptical Science Study Finds 97% Consensus on Human-Caused Global Warming in the Peer-Reviewed Literature
Jason,
I'm making no claim as to what the consensus statement is meant to be.
barry, the authors were asked to state whether or not their papers endorsed the proposition that human activity is causing global warming.
I agree. But if Authors rating at 2 and 3 (which comprise a huge bulk of the endorsement ratings) take that to mean anything between, say, 'some' influence and >50%, and Cook et al take it to mean >50%, then the rating criterion is different and this may signficantly affect the comparitive results.
Would I be correct in assuming you would say that options 2 and 3 rate the human influence on global warming as dominant (b)?
I'm hoping to garner clear responses to see if there are different interpretations by commenters here. Tom Curtis began as an author on Cook et al, but declined participation after a while. Judging by comments he has made at Lucia's he is saying that ratings 2 and 3 refer to >50% influence. Eg,
Lucia, excluding papers dealing with impacts and mitigation, 92.9% of papers surveyed (and that indicate a position in the abstract) implicitly or explicitly affirm that >50% of recent warming is due to anthropogenic causes.
http://rankexploits.com/musings/2013/on-the-consensus/#comment-113388
You write;
If they felt that their paper either implied or stated that human activity was a contributing factor but not the primary cause then they could have categorised their paper as level 5, 6, or 7, depending on how it was presented. (Remember, level 5 includes any proposition that something other than humans was the main cause, and level 7 includes any quantification less than 50%.)
Apart from 1 and 7, none of the ratings are quantified. The descriptors are "endorses" and "minimises" AGW. These are qualitative statements, and that was how I read them. That is also how Zeke Hausfather read them.
Categories 2 and 3 as well as 5 and 6 do not make any explicit assertion of attribution percent (e.g. they don’t assert < 50 percent, they simply don't provide enough information to imply a percent).
http://rankexploits.com/musings/2013/on-the-consensus/#comment-113263
That 2, 3, 5 and 6 relate to >/< 50% human contribution may be inferred in context, but other inference is also possible.
My point is, if reasonable people disagree on the ratings criterion (and the 2 I've cited are 'friendlies', there is yet more disagreement between other parties), then original Authors may have had different interpretations, and this may well undermine the comparitive results that are a strong corroborative feature of the paper. The similarity of results could be a fluke.
The only way to test that, that I can think of, is by asking the original Authors who rated their own papers what they assumed the criterion was for 2 and 3 (and 5 and 6).
If the point of the paper is to demonstrate there is a consensus that more GHGs in the atmosphere should cause some warming, then that is not as impactful as endorsing the IPCC statement. It's a much lower bar with a much smaller target audience. None of the contrarian climate scientsts dispute that, and neither do most prominent skeptics (including Anthony Watts, for example) and most of their followers.
The basic message is fine - and the effort has been successful on that regard. I'm discussing the academic merit of the Cook et al study.
-
KR at 23:46 PM on 22 May 2013Skeptical Science Study Finds 97% Consensus on Human-Caused Global Warming in the Peer-Reviewed Literature
barry - "And yet, KR, the ridiculous interpretation is how many reasonable people have taken 2 and 3."
Reasonable people? Perhaps... But many of the people raising this issue (this obfuscation, in my point of view) are not climate scientists, and are not as aware of the IPCC reports. Or at all fond of of the IPCC and its conclusions, for that matter (cf motivated reasoning).
"Can you explain why abstracts saying "human greenhouse gas emissions are causing global warming" means that they are, perforce, positing >50% human influence?"
As I pointed out above, because the category titles are part of the description as well, and because, quite frankly, anyone familiar with the science knows that AGW means human caused global warming:
Definitions of each level of endorsement of AGW.
- Explicit endorsement with quantification
- Explicit endorsement without quantification
- Implicit endorsement
-
Yvan Dutil at 23:13 PM on 22 May 2013Has the rate of surface warming changed? 16 years revisited
The key issue here as many of the linear decomposition is the potential hiden cross-talk between factor. Solar signal as at least some linear component in. Depending of the model, volcanic too. The same situation apply to any long period oscillation fitting used by skeptics.
Without physics statistical analysis are pretty limited tools. -
MikeArney3@aol.com at 22:33 PM on 22 May 2013Monckton Myth #11: Carbon Pricing Costs vs. Benefits
I guess this has been out there a while, but I think the sentence in the 3rd paragraph, "Here Monckton is implicitly assuming that the cost of preventing consequences will be less than or equal to the cost of adapting to consequences," should say, "greater than or equal". And I'd also take out the "implicitly", since he's pretty explicit about this (and very wrong, of course).
Thanks for all the great work you do on this site. I am very grateful for it.
-
rhjames at 22:25 PM on 22 May 2013Skeptical Science Study Finds 97% Consensus on Human-Caused Global Warming in the Peer-Reviewed Literature
Can we please stop talking about consensus. Science isn't about a show of hands. There used to be consensus that "bleeding" a patient solved most medical problems. So called consensus has proven to be wrong too many times in the past. Let's stick to scientific evidence.
-
John Russell at 21:47 PM on 22 May 2013Has the rate of surface warming changed? 16 years revisited
Pathetic. Bob Tisdale makes a meal out of SkS withdrawing the video and the reasons behind it. Does he not realise that a constant incremental adjustment to the consensus position is good science and how our knowledge actually advances? I guess not. A head-in-the-sand, entrenched denial of human-caused warming is much more comfortable.
-
JvD at 20:09 PM on 22 May 2013A Detailed Look at Renewable Baseload Energy
The fact that SkS *is* ignoring the cost question is clearly evidenced by the comments in this thread. It has taken a lot of discussion even to establish the fact that a WWS-only scenario is extremely difficult / extremely expensive. All this discussion would have been unnecessary if SkS would simply come out clearly and say: "WWS as a solution to climate change is extremely difficult/ extremely expensive." But SkS does not do this. On the contrary, according to SkS, a WWS-only scenario is called 'plausible'! In another article, SkS even goes so far as to seek to 'debunk the myth' that WWS cannot provide baseload!
So sure, you can look at snippets of SkS articles and tease-out citations and lines that in a round-about-way suggest that costs are 'not ignored', but surely you must agree that the basic conclusion of SkS is that WWS is or will be competitive with coal sooner rather than later. Which is a conclusion that flies utterly in the face of all major scientific institutions, which conclude that is will be extremely difficult / extremely costly.
If necessary, read back through the comments in this thread. Surely, you can see that most commenters are or have been under the impression (from reading SkS articles) that renewables can provide baseload with little or no problem and therefore that nuclear power is unnecessary or 'too expensive'. This is an absurd position to take, do you not agree?
-
MA Rodger at 19:48 PM on 22 May 2013The anthropogenic global warming rate: Is it steady for the last 100 years? Part 2.
Here is the Ed Hawkins graphic as sourced by the Daily Rail's David Rose (who is not the sort of person any self-respecting climatologists should associate with).

The AR4 projections are presented in fig 10.26 but also in fig SPM5 shown here. The shaded areas are 1sd. If you zoom really close in with your rulers (as I did), you will find the 2000 temperature sits at 0.241ºC with the 2012 central projection at 0.457ºC (1 sd +/- 0.18ºC) This would thus require a temperature drop (of 0.08ºC) below the 2000 level for the 2012 observed temperature to be below the AR4 model projection 95% range.

-
JasonB at 18:19 PM on 22 May 2013Skeptical Science Study Finds 97% Consensus on Human-Caused Global Warming in the Peer-Reviewed Literature
I've been playing with the search tool to tabulate the results; I managed to collect results for 11,942 papers using a space as the search term; that's two fewer than Cook et al. Curiously, I ended up with exactly one extra paper in levels 1-3, two fewer in level 4, and one missing in levels 5-7. Could have been a typo when I was entering the numbers into the spreadsheet, although I just double-checked level 4 and got exacly the same result.
Anyway, of interest to this discussion is the breakdown between papers that quantify the human contribution to global warming as >= 50% and papers that quantify the human contribution to global warming as < 50% (i.e. levels 1 and 7), since there is no interpretation required for those. The former represent 88% of all papers that quantify the human contribution to global warming (64 of 73). A small difference to the overall percentage, but the level of endorsement still overwhelming, and due to the relatively small sample size, a small difference is to be expected. (I would also not be surprised if papers purporting to refute the consensus would do so with quantification, so this group is perhaps more likely to include a higher percentage of contrarian papers.)
For the papers that make explicit statements about causation without quantification, those that explicitly state humans are causing global warming represent 98.4% of the total (923 of 938).
For the papers that imply the impact humans are having, those that imply humans are causing global warming represent 98.2% (2910 of 2963).
My figure for the overall endorsement percentage is 98.06%. Not sure why the paper gives a lower figure.
In any case, no matter how the results are spun, or words are interpreted, it is pretty clear that the literature falls heavily on one side. I think anybody who seriously wants to challenge the results really needs to show papers that were mis-categorised; all the abstracts are available together with the category that was applied, so nothing is hidden, and if someone wants to apply their own "interpretation" to the rating system they have the means to do so.
Perhaps, to make the problem more tractable, they could start by checking for papers that they know disagree with the consensus and make sure those show up in the right place.
-
JvD at 17:56 PM on 22 May 2013A Detailed Look at Renewable Baseload Energy
"In Part II of the study, J&D examine the variability of WWS energy, and the costs of their proposal. J&D project that when accounting for the costs associated with air pollution and climate change, all the WWS technologies they consider will be cheaper than conventional energy sources (including coal) by 2020 or 2030, and in fact onshore wind is already cheaper."
This is coded language which is actually saying that renewables will remain far more expensive than coal. There are many variables here: the price of coal in 2020 and 2030, and the cost of air pullution and climate change in 2020 and 2030. The authors assume great costs for these elements, which is how they arrive at the conclusion that WWS will be 'cheaper'. The elephant in the room is whether coal will really be more expensive in 10 or 20 years time, and more importantly: whether the external cost of climate change and air pollution will ever be internalised (requiring new international lawmaking).
In a way, J&D are saying: "if we get a global tax on carbon and air pollution, then WWS will be cheaper than coal".
But what if we never get such a global agreement? That is my point. 30 decades of complete failure on establiishing global climate and air pollution regulations could very well be followed by another 30 years of failure. Why should we take that risk? Why not use an energy source that is cheaper and more abundant and far cleaner than fossil fuels? That is the question SkS needs to answer. But rather than doing that, SkS is suggesting that replacement of fossils with WWS is 'plausible'. The message to the reader is: "Don't worry. WWS will (through international agreements on putting a price on air pollution and cliamte change) be competitive with fossils in time to stop climate change and air pollution (so we don't need nuclear power)".
-
JasonB at 17:21 PM on 22 May 2013Skeptical Science Study Finds 97% Consensus on Human-Caused Global Warming in the Peer-Reviewed Literature
Next we'll be arguing what the meaning of "is" is!
barry, the authors were asked to state whether or not their papers endorsed the proposition that human activity is causing global warming. If they felt that their paper either implied or stated that human activity was a contributing factor but not the primary cause then they could have categorised their paper as level 5, 6, or 7, depending on how it was presented. (Remember, level 5 includes any proposition that something other than humans was the main cause, and level 7 includes any quantification less than 50%.)
I said that the statement Cook et al were testing was very strong, so let's look at what you claim the "consensus" is: "that human activity is causing at least some global warming". Papers classified by Cook et al as levels 1-3 would obviously also agree with your claim. But so would papers classified by Cook et al as level 5, some of the papers classified by Cook et al as level 6, and any of the papers classified by Cook et al as level 7 that had a percentage greater than 0.
In other words, the only papers that Cook et al counted as rejecting their proposition that you would also claim reject your rendition of the consensus are those in level 6 that explicitly reject that humans are causing global warming and those in level 7 that state humans are causing 0% or less of global warming.
Clearly, Cook et al's statement is a lot stronger than yours, as it filters out many possible papers that you would consider endorsing your consensus. I would guess that very close to 100% of the papers would pass your test.
Finally, to point out that the authors of the original papers, when asked if their papers endorsed the claim that human activity is causing global warming, resulted in the same percentage of endorsement as Cook et al did by examing the abstracts alone, is not "post-hoc reasoning", it's evidence that the same criteria were applied, because it would be absolutely staggering for both groups to have arrived at the same percentage by coincidence, especially when the original authors added a large number of extra papers to the mix that Cook et al were forced to assess as "neutral" based on the abstracts alone.
It also means that the abstract examination process provided an unbiased estimate of what the full paper would actually say.
-
barry1487 at 16:18 PM on 22 May 2013Skeptical Science Study Finds 97% Consensus on Human-Caused Global Warming in the Peer-Reviewed Literature
If Zeke was here, I think he'd say c) and/or d).
What do others think?
-
barry1487 at 16:14 PM on 22 May 2013Skeptical Science Study Finds 97% Consensus on Human-Caused Global Warming in the Peer-Reviewed Literature
To clarify, c) - significant influence - was what I took to be the criterion for rating options 2 and 3 when I participated in the public survey.
But another person might have rated those with a lower (d) or higher (a,b) bar.
Lack of clear definitions is a problem for the paper as I've argued upthread.
-
barry1487 at 16:03 PM on 22 May 2013Skeptical Science Study Finds 97% Consensus on Human-Caused Global Warming in the Peer-Reviewed Literature
Jason, I'll point out again that the match could still be a coincidence if the Authors interpretation of the ratings system for their papers, was different than Cook et al for the abstracts to those papers. Post hoc reasoning is not acceptable.
You ask,...the graphic makes the statement that "97% of climate papers stating a position on human-caused global warming agree global warming is happening and [A] we are the cause".
How can you argue that a paper that says exactly the same thing — that [B] human greenhouse gas emissions are causing global warming — should not be categorised as endorsing that position?
[A] implies human influence as the dominant - in fact the ONLY cause.
[B] can be taken to mean that anthro influence is a contributing factor, but not necessarily dominant
They are different.
Whatever interpretation is taken, there is no doubt that the consensus is that human activity is causing at least some global warming.
If the consensus statement being tested by 1, 2 and 3 (and the rest) is meant to be whether human contribution is >50%, then I think the results are flawed, as this proposition is not explicit enough in the consensus statement emailed to Authros, and the rating system. It is also confusing in the paper, but I now strongly believe that this was indeed, the intention of Cook et al. (Why are they not commenting here?)
Perhaps participants here could select which of these statements is most accurate.
"97% of climate papers stating a position on human-caused global warming agree that human influence on global warming over the last 50 years is...
a) >50%
b) dominant
c) significant
d) a contributing factor
I think either of those are valid for rating options 2 and 3, depending on how the email is interpreted.
My own take doing the (public) survey was c).
-
JasonB at 15:37 PM on 22 May 2013Skeptical Science Study Finds 97% Consensus on Human-Caused Global Warming in the Peer-Reviewed Literature
barry,
Can you explain why abstracts saying "human greenhouse gas emissions are causing global warming" means that they are, perforce, positing >50% human influence? The quote I've just given is from Dana, one of the authors of Cook et al, and that unquantified statement was suffcient for the abstract to be rated as endorsing.
Because the hypothetical abstract says that human greenhouse gas emissions are causing global warming? Just because the statement omits a number doesn't mean it isn't endorsing the proposition, which didn't include a number anyway.
As I've already pointed out, the graphic makes the statement that "97% of climate papers stating a position on human-caused global warming agree global warming is happening and we are the cause". How can you argue that a paper that says exactly the same thing — that human greenhouse gas emissions are causing global warming — should not be categorised as endorsing that position?
And again, I'll point out that the original authors, given the explicit request to state whether their paper endorses the proposition, rejects the proposition, or doesn't address it, gave the same percentage of endorsements and rejections as Cook's team did, even while finding that many papers that Cook's team relegated to "neutral" on reading the abstracts alone actually did make a statement when the whole paper was taking into account.
-
JasonB at 15:13 PM on 22 May 2013Skeptical Science Study Finds 97% Consensus on Human-Caused Global Warming in the Peer-Reviewed Literature
barry,
Let's consider the original authors' ratings for the moment.
The authors were sent an email. That email quite clearly said, as you have already quoted yourself, "The second drop down indicates the level of endorsement for the proposition that human activity (i.e., anthropogenic greenhouse gases) is causing global warming (e.g. the increase in temperature)." They are not being asked to quantify the human contribution, nor state their certainty of the human contribution, but merely to say whether their paper endorses that proposition, rejects that proposition, or doesn't address or mention the issue of what's causing global warming. The very next statement says "we are not asking about your personal opinion but whether each specific paper endorses or rejects (whether explicitly or implicitly) that humans cause global warming". Then the seven "levels" are stated, and, sure enough, the only difference between 1, 2, and 3 is the manner in which that endorsement is manifested in the paper (i.e. implicitly or explicitly, and if explicit, with or without quantification), and the only difference between 5, 6, and 7 is the manner in which that rejection is manifested in the paper, in exactly the same way as the endorsement case.
Note, for example, that a paper classified as "level 1" could easily be less "alarmist" than a paper classified as "level 2" or "level 3". A level 1 paper is likely to be an attribution study whereas a "level 3" could be an impacts study and, as such, could well be far more alarming.
As I mentioned in an earlier comment, someone else at Lucia's managed to confuse the levels with a measure of climate sensitivity, which is nonsense. There is only one proposition being put, and that is whether humans are causing global warming or not.
Note that it's really quite a strong statement as well. There's no wriggle room here. If someone wrote a paper that accepts that greenhouse gasses cause global warming, and that humans are responsible for GHG emissions, but that e.g. natural variability had a larger role to play in the warming to date than humanity, their paper would be classified as rejecting the proposition.
Now for Cook et al. In the introduction to the paper they clearly state that
We examined a large sample of the scientific literature on global CC, published over a 21 year period, in order to determine the level of scientific consensus that human activity is very likely causing most of the current GW (anthropogenic global warming, or AGW).
This is simply a restatement of the IPCC consensus statement, quoted by KR, and it doesn't matter if other restatements of it elsewhere in the paper are less precise because this is the proposition they are evaluating.
"Most" translates into "> 50%" when expressed numerically and answers your question:
It can be argued that 'primary cause' or 'dominant cause' of global warming could mean as little as 33%, if other contributing factors are each not greater than 33%. Is this what 2 and 3 refer to?
No. If a paper quantified the human contribution to global warming at 33% then regardless of other contributing factors it quite clearly would have been categorised as "level 7": "paper explicitly states that humans are causing less than half of global warming".
There is no room for interpretation here. Level 1's "Explicitly states that humans are the primary cause of recent global warming" has to be read in the context of Level 7's "Explicitly states that humans are causing less than half of global warming", which rules out any possibility other than ">= 50%" for Level 1.
Likewise, levels 2 and 3 are symmetric with levels 6 and 5, respectively.
-
barry1487 at 14:47 PM on 22 May 2013Skeptical Science Study Finds 97% Consensus on Human-Caused Global Warming in the Peer-Reviewed Literature
And yet, KR, the ridiculous interpretation is how many reasonable people have taken 2 and 3.
Can you explain why abstracts saying "human greenhouse gas emissions are causing global warming" means that they are, perforce, positing >50% human influence? The quote I've just given is from Dana, one of the authors of Cook et al, and that unquantified statement was suffcient for the abstract to be rated as endorsing.
(the quote is linked a few posts upthread)
-
KR at 13:44 PM on 22 May 2013Skeptical Science Study Finds 97% Consensus on Human-Caused Global Warming in the Peer-Reviewed Literature
barry - In 2001 the IPCC consensus states that:
In the light of new evidence and taking into account the remaining uncertainties, most of the observed warming over the last 50 years is likely to have been due to the increase in greenhouse gas concentrations.
In 2007, the IPCC stated:
From new estimates of the combined anthropogenic forcing due to greenhouse gases, aerosols and land surface changes, it is extremely likely that human activities have exerted a substantial net warming influence on climate since 1750.
Greenhouse gas forcing has very likely caused most of the observed global warming over the last 50 years. Greenhouse gas forcing alone during the past half century would likely have resulted in greater than the observed warming if there had not been an offsetting cooling effect from aerosol and other forcings.
It is extremely unlikely (<5%) that the global pattern of warming during the past half century can be explained without external forcing, and very unlikely that it is due to known natural external causes alone. The warming occurred in both the ocean and the atmosphere and took place at a time when natural external forcing factors would likely have produced cooling.
Given that as the widely understood "consensus", I find claims of categories 2 and 3 not supporting a majority factor for human causes to be simply ridiculous.
-
barry1487 at 13:30 PM on 22 May 2013Skeptical Science Study Finds 97% Consensus on Human-Caused Global Warming in the Peer-Reviewed Literature
Jason, Dana said:
Our basis was the IPCC statement that humans have caused most global warming since the mid-20th century.
If that was the basis (and you, argue that ratings 5, 6 and 7 should be viewed as rejection of AGW at >50%, implying, in a symmetrical ratings scheme, that 1, 2 and 3 are endorsement at>50% (implied or explicit)), then I don't see much wriggle room.
Can you clearly state in a sentence, if you think ratings 2 and 3 refer to an endorsement at >50% level, or only that anthropogenic warming is signficant in a qualitative sense. Just something clear and simple.
It would be good to have clear statements from others. I'm pretty sure Tom Curits was arguing that 2 and 3 are >50% endorsements.
If you read the introduction to Cook et al, this is one statement of consensus:
We examined a large sample of the scientific literature on global CC, published over a 21 year period, in order to determine the level of scientific consensus that human activity is very likely causing most of the current GW (anthropogenic global warming, or AGW).
It is confusing in the paper, as other statements on what the consensus is are less exact, as in the abstract.
It is confusing in discussions about it because there is little agreement on what the ratings reflect. This disagreement does not fall on ideological lines (regulars at Lucia's are arguing about them, too).
The problem is that the definitions are unclear and open to misinterpretation. It doesn't matter that results are so similar if there is ambiguity in the methodology. Indeed, if Cook et al have a unified understanding that is different to interpretations made by original Authors, then that is a problem, weakening a number of key points in the study, namely to do with corroborating the impartiality/conservatism of Cook et al. The close matchup of results may be a result of these extraneous factors due to the ambiguity of definitions in the ratings schema.
It can be argued that 'primary cause' or 'dominant cause' of global warming could mean as little as 33%, if other contributing factors are each not greater than 33%. Is this what 2 and 3 refer to?
It's simply unclear. I'd like to know in simple terms how others view the ratings. When I took the survey, I only applied >50% to 1 and 7, and the rest were qualitative. If Cook et al rated all but option 4 as an endorsement/rejection at 50% human contribution, then they rated differently to me, and possibly to many of the responding Authors.
-
JasonB at 11:56 AM on 22 May 2013Skeptical Science Study Finds 97% Consensus on Human-Caused Global Warming in the Peer-Reviewed Literature
barry,
I think you (and others I saw at the earlier link you posted) are getting hung up on the "> 50%" figure, when that is not the outcome of the survey, it was a tool for categorising a certain subset of papers.
The title of this post says:
Skeptical Science Study Finds 97% Consensus on Human-Caused Global Warming in the Peer-Reviewed Literature
The first sentence is:
A new survey of over 12,000 peer-reviewed climate science papers by our citizen science team at Skeptical Science has found a 97% consensus among papers taking a position on the cause of global warming in the peer-reviewed literature that humans are responsible.
The graphic says:
97% of climate papers stating a position on human-caused global warming agree global warming is happening and we are the cause.
The email sent to authors asked them to state whether their paper endorsed the proposition:
that human activity is causing global warming
Every one of them is consistent. Not one of them mentions the >50% figure. Why? Because the point of the exercise is whether global warming is happening and we are the cause.
The only reason categories 1 and 7 exist is because some papers actually quantify the various causes, and so in papers that quantify the human contribution, the rule was > 50% counts as an "endorse" while < 50% counts as a "reject". That's all.
If the graphic said "97% of climate papers state that humans are responsible for > 50% of global warming" then you'd have a point, but it doesn't. As I said, the numbers 1..7 are not meant to be interpreted as a confidence levels, or degrees of agreement with the proposition, but merely to categorise the manner in which the agreement or rejection was expressed in the paper. The fact that the authors of 97.2% of the papers that stated a position claimed that their paper agreed with the proposition and the reviewers of the abstracts found that 97.1% of those that stated a position agreed with the proposition is very strong evidence to me that they used the same interpretation.
I don't agree that this should be seen merely as a matter of opinion or interpretation. The email is very clear. The paper is also very clear. The only thing I would change is the word "level" rather than "category" since that is apparently confusing some people.
Dana's comment is also saying the same thing.
-
barry1487 at 11:27 AM on 22 May 2013Skeptical Science Study Finds 97% Consensus on Human-Caused Global Warming in the Peer-Reviewed Literature
Jason,
we are agreed that different interpretations are possible. This is a weakness of the consensus statement sent in the email, and the ratings scheme. The only way I can think to test for differences is to email all the Authors who rated to clarify that they though was meant by options 2 and 3. A subset of respondants should give a clue.
Because if a good number of respondants interpreted as I, Zeke Hausfather and a number of other reasonable commenters did, then the bar for them was much lower than yours/Cook et al, and this would significantly weaken the results. For example, Cook et al's claim that their ratings were more conservative than the original Authors' would be undermined.
Consider Dana Nuticelli's comment at another blog on the Cook et al ratings as he sees it.
Note that if a paper said humans are causing less than 50% of global warming, or that another factor was causing more than 50% (or ‘most’, or some similar language), we put it in our rejections/minimization of the human influence category. Our basis was the IPCC statement that humans have caused most global warming since the mid-20th century. But if a paper simply said ‘human greenhouse gas emissions are causing global warming’, that went into the endorsement category as well. After all, there’s no reason for most climate research to say ‘humans are causing >50% of global warming’ (except attribution research), especially in the abstract.
If you just want to get into the quantifications, as Bart notes, nearly 90% agreed that humans are the main cause of global warming.
http://ourchangingclimate.wordpress.com/2013/05/17/consensus-behind-the-numbers/#comment-18747
Huh? If a paper (abstract) simply said anthro GHGs are causing global warming (with no quantification), that went into the endorsement category. It seems that the raters (or Dana at least) assumes that any paper that endorses the notion of GHGs causing global warming, perforce endorses a >50% human contribution.
-
Dumb Scientist at 11:04 AM on 22 May 2013Has the rate of surface warming changed? 16 years revisited
Oops... "less uncertain" should be "less certain." Sorry.
-
KR at 11:02 AM on 22 May 2013Has the rate of surface warming changed? 16 years revisited
jmorpuss - I believe this topic was discussed ad nauseum (and dismissed due to actual evaluation of energy levels) in earlier, more appropriate threads.
-
jmorpuss at 10:58 AM on 22 May 2013Has the rate of surface warming changed? 16 years revisited
Dumb Scientist OK then I'll retract the word large scale and replace it with what was stated large number, Just read it all and come back with something relavent to the paper. You may need a refressure cource in how electric and magnetic fields interact LINK " If the electron enters the field at an angle to the field direction the resulting path of the electron (or indeed any charged particle) will be helical as shown in figure 3. Such motion occurs above the poles of the earth where charges particles from the Sun spiral through the Earth's field to produce the aurorae. " Quote directly from Schoolphisics article. So all that is needed is a manetron, masser or laser to generate and beam electrons into a system and you will increase the magnetic part of the wave and its force.
Moderator Response:[RH] Fixed link that was breaking page format.
-
Dumb Scientist at 10:31 AM on 22 May 2013Has the rate of surface warming changed? 16 years revisited
jmorpuss: Large scale in terms of the global energy budget? I doubt it, and don't see any such claim in that paper.
-
jmorpuss at 10:21 AM on 22 May 2013Has the rate of surface warming changed? 16 years revisited
Dumb Scientist @7
Do you think man contributed to the unsetled period from the 80's to 97 In the introduction to this accepted paper in 98 http://hal.archives-ouvertes.fr/docs/00/31/64/49/PDF/angeo-16-1212-1998.pdf states that the time period disgused coinsides with the same period were large scale weather modification was carried out. Don't you think these experiments would have corrupted the data from this period? This is only one experiment in that time period , does anyone have links to other experiments carried out in the time period being disgused.
-
Bert from Eltham at 10:19 AM on 22 May 2013Skeptical Science Study Finds 97% Consensus on Human-Caused Global Warming in the Peer-Reviewed Literature
The best analogy I could think of to describe the current situation of the large gap between the publics' knowledge and published climate scientists is the knowledge gap between the passengers of a very large airliner and the flight crew.
Would you board an aircraft where the passengers have a vote on what control inputs should be used at all times. These votes would be open to the most shrill passengers that made the most noise without any knowledge or evidence. Even if the full instrument panel was displayed on all the screens in the passenger compartment the passengers do not even have the slightest idea of what they all mean. The self appointed 'knowledgeable' passengers who are not trained pilots are a cacophony of conflicting interpretations of how to fly the aircraft. They cannot even agree amongst themselves how their 'expert' opinions should be implemented.
This is the situation Space Ship Earth finds itself in.
The first aircraft to fly from England to Australia was a Vickers Vimy Bomber flown by Keith and Ross Smith in 1918. Their call sign was GEAOU. Both Keith and Ross (not related) jokingly said it stood for God 'elp all of us! Bert
-
Rob Honeycutt at 10:14 AM on 22 May 2013The anthropogenic global warming rate: Is it steady for the last 100 years? Part 2.
Dr Tung... You first hit the "insert" tab above the comment text box. That where you find the little tree image for image insertions.
-
KK Tung at 10:10 AM on 22 May 2013The anthropogenic global warming rate: Is it steady for the last 100 years? Part 2.
Post 88: My figure insertion did not work. I will try later. Any advice on how to do it?
Also the statement was a little confusing. In the AR4 projection comparing with the observed temperature, the latter has gone out of the model 95% range of all the scenarios shown. In Ed Hawkins' figure showing CMIP5 model projections since 2005, the observation has gone out of 90% of the model range.
Moderator Response:[RH] You need to have the image hosted somewhere and then use the image insertion tool (the little tree).
-
KK Tung at 10:06 AM on 22 May 2013The anthropogenic global warming rate: Is it steady for the last 100 years? Part 2.
In reply to post 85 by Dikran: You asked for a figure. I hope my attempt at inserting a figure to a post here works this time: The first figure is from AR4, and the projection was made in 2000. The projection has gone out of the model 95% range of the scenarios shown. The grey band is supposed to be observational uncertainty. The second figure is from CMIP5 by Ed Hawkins. The projection was made in 2005. The more recent projection is almost getting out of the 90% range.
Moderator Response:[RH] Whoops. Sorry. The image actually has to be hosted somewhere.
-
Dumb Scientist at 09:26 AM on 22 May 2013The anthropogenic global warming rate: Is it steady for the last 100 years? Part 2.
If the true anthropogenic response is linear, but we used a nonlinear regressor that increases faster after 1950, then the residual will show a negative trend after 1950 when it is only supposed to contain noise. When the trend from the residual is added back the combined trend becomes linear. [KK Tung]
Again: I've repeatedly pointed out that the form of the anthropogenic regressor or adding the residual back is not the problem that concerns me. Again, you're implying that anthropogenic warming can only appear in your residual or anthropogenic terms, not your AMO term. I think it could go into your AMO term if anthropogenic warming is nonlinear. So do papers like Enfield and Cid-Serrano 2010, etc.
In order for our result of a steady anthropogenic warming to be self consistent with our choice of the AMO index...
... nothing has to be true. Your result is always consistent with your choice of AMO index because that choice made your result inevitable. Regressing against the linearly-detrended AMO, which is highly correlated with global surface temperatures, causes any non-linearity to be absorbed by the AMO(t) function. The fact that you get answers which are "very close" regardless of using linear or nonlinear anthropogenic indices to suggest that the regression is more sensitive to the highly correlated AMO(t) function.
But please continue.
... the net anthropogenic forcing needs to be approximately linear without the ups and down in your red-dashed curve. We claimed that that is not unreasonable given the uncertainty in the aerosol component.
You've previously claimed that aerosol time evolution is so uncertain that a linear total anthropogenic forcing lies within its error bars. MA Rodger already asked where that uncertainty bound can be found, and I second his request.
We are more certain that anthropogenic warming affects the secular trend, but much less certain that it affects the oscillatory part. We know the former because the N. Atlantic temperature trend is less than the global mean trend, and that can be explained by...
... the fact that the N. Atlantic is filled with water, which has a higher specific heat than the rock making up some of the globe and the fact that oceans can evaporate without limit to shed heat. The land making up some of the globe can (and is) doing that, but those pesky severe droughts limit evaporative cooling on land.
Your mechanism probably plays a role too, especially if the N. Atlantic is compared to other oceans.
The other competing theory is to attribute the oscillatory part to the variations of the AMOC. The mechanism involves the Arctic ice melt and SST feedback on the formation of deep water. This theory is self consistent. The model simulations were consistent with observation. It could also be shown wrong given further evidence, but none of your arguments do it.
I'm not disputing that the AMO exists, and AMOC variations seem like a plausible mechanism. I'm just disputing your curve-fitting claim that ~40% of the warming over the last 50 years can be attributed to a single mode of internal variability, when Isaac Held and Huber and Knutti 2012 used thermodynamics to conclude that all modes of internal variability couldn't be responsible for more than about 25% of the warming. Even if the 10% limit from Anderson et al. 2012 is somehow wrong... didn't you say Isaac Held is one of the most respected climate scientists? I agree.
-
Tom Dayton at 08:45 AM on 22 May 2013Skeptical Science Study Finds 97% Consensus on Human-Caused Global Warming in the Peer-Reviewed Literature
I just attended a talk by James Hansen at NASA Ames Research Center. One of his main points right up front is that a big part of the problem is the large gap between climate scientists' knowledge and public perception of that knowledge.
-
KK Tung at 08:33 AM on 22 May 2013The anthropogenic global warming rate: Is it steady for the last 100 years? Part 2.
In reply to post 78 by Dumb Scientist: You have so many questions in one comment and I have to wait until I have a block of time to answer them. Often one question is convoluted with another and my answers may run the danger of further confusing the readers. You also prefer black and white, yes or no answers. In climate sciences, much is unclear. Let me try the best I could to convey to you my thinking. Your questions involve two groups. One group concerns the linearity of net anthropogenic forcing, and the other group concerns the AMO index.
In part 1 of my post, I attempted to address the claim you raised in your original post that our use of linear regressor (as a placeholder only in the intermediate step) in our multiple linear regression to arrive at an anthropogenic response that is almost linear is circular. This was a technical question and the way I rebutted that claim was to show that our methodology does not depend on what we used for the anthropogenic regressor. We showed this by using a regressor that is not linear. In fact we showed a few such examples. We showed that our procedure is not sensitive to using linear or nonlinear regressors for anthropogenic forcing as long as we add back the residual to the regressed signal. If the true anthropogenic response is linear, but we used a nonlinear regressor that increases faster after 1950, then the residual will show a negative trend after 1950 when it is only supposed to contain noise. When the trend from the residual is added back the combined trend becomes linear. Of course we do not know that the true anthropogenic response is linear, but this example is used here just to illustrate the procedure. This is intended as a technical rebuttal to your claim that our result follows from our assumption of a linear regressor for anthropogenic forcing. This technical rebuttal does not really address what the real anthropogenic forcing is and did not address the choice of the AMO index, the latter does affect the regressed anthropogenic response, as you correctly pointed out. The AMO part was discussed in part 2 of my post.
So what is the shape in time of the net anthropogenic forcing? We know the radiative forcing from the greenhouse gases well (your blue line), but the net forcing has other components that subtract from the greenhouse gas part. They include tropospheric sulfate aerosols, which are highly uncertain. In order for our result of a steady anthropogenic warming to be self consistent with our choice of the AMO index, the net anthropogenic forcing needs to be approximately linear without the ups and down in your red-dashed curve. We claimed that that is not unreasonable given the uncertainty in the aerosol component. This is not an assumption but a proposal. No one knows what the net anthropogenic forcing is with certainty. Therefore there is no inconsistency at our current stage of understanding.
On the AMO index and answering your two questions: Of course anthropogenic forcing can affect the North Atlantic temperature and hence the AMO index, no matter how you define it. It can affect both the secular trend of the N. Atlantic mean temperature and the multidecadal oscillation on top of the secular trend. We are more certain that anthropogenic warming affects the secular trend, but much less certain that it affects the oscillatory part. We know the former because the N. Atlantic temperature trend is less than the global mean trend, and that can be explained by the AMOC (Atlantic Meridional Overturning Circulation) slowing down secularly by the basin-wide warming, with the warm and less saline water sinks less at the Atlantic Arctic. So the Atlantic secular trend has a part that is a direct basin-wide warming by anthropogenic heating and a part that is a result of a change in the AMOC brought about by the warming. The two oppose each other.
At this point one can construct two competing theories. One involves anthropogenic forcing being responsible for both the secular part and the oscillatory part of the N. Atlantic mean temperature. Since the greenhouse gas forcing increase is secular, it cannot be responsible for the oscillatory part of the Atlantic temperature variability. So it falls upon the uncertain tropospheric aerosol to do the job. One needs to come up with an argument on why the aerosol forcing should have such an oscillatory behavior, and builds a model to demonstrate that such variations are sufficient for producing the observed oscillatory response. This job was not attempted by CMIP3 models, but Booth et al (2012) has put forth their HadGEM-ES2 model that produces an oscillatory multidecadal variability. Although the model response in other ocean basins and in subsurface Atlantic are not too consistent with the available observation, I would not rule out this theory, a theory for a forced AMO-like behavior in observation.
The other competing theory is to attribute the oscillatory part to the variations of the AMOC. The mechanism involves the Arctic ice melt and SST feedback on the formation of deep water. This theory is self consistent. The model simulations were consistent with observation. It could also be shown wrong given further evidence, but none of your arguments do it.
-
Dumb Scientist at 08:28 AM on 22 May 2013Has the rate of surface warming changed? 16 years revisited
First, the uncertainty added by the delayed effect would have to be larger than decreased uncertainty due to removing the more certain immediate effect.
To clarify, this would only be true for timespans that overlap with the immediate volcanic effect.
-
Dikran Marsupial at 08:09 AM on 22 May 2013The anthropogenic global warming rate: Is it steady for the last 100 years? Part 2.
Prof. Tung wrote "The CMIP3 models, which do not need internal variability to explain the accelerated warming since 1980, have projections that overshoot the observation in the recent decades, beyond the 95% range."
Please could you provide some supporting evidence for this statement, as far as I am aware, the observations currently lie well within the 95% range of the CMIP3 models (click on the image to access the source).
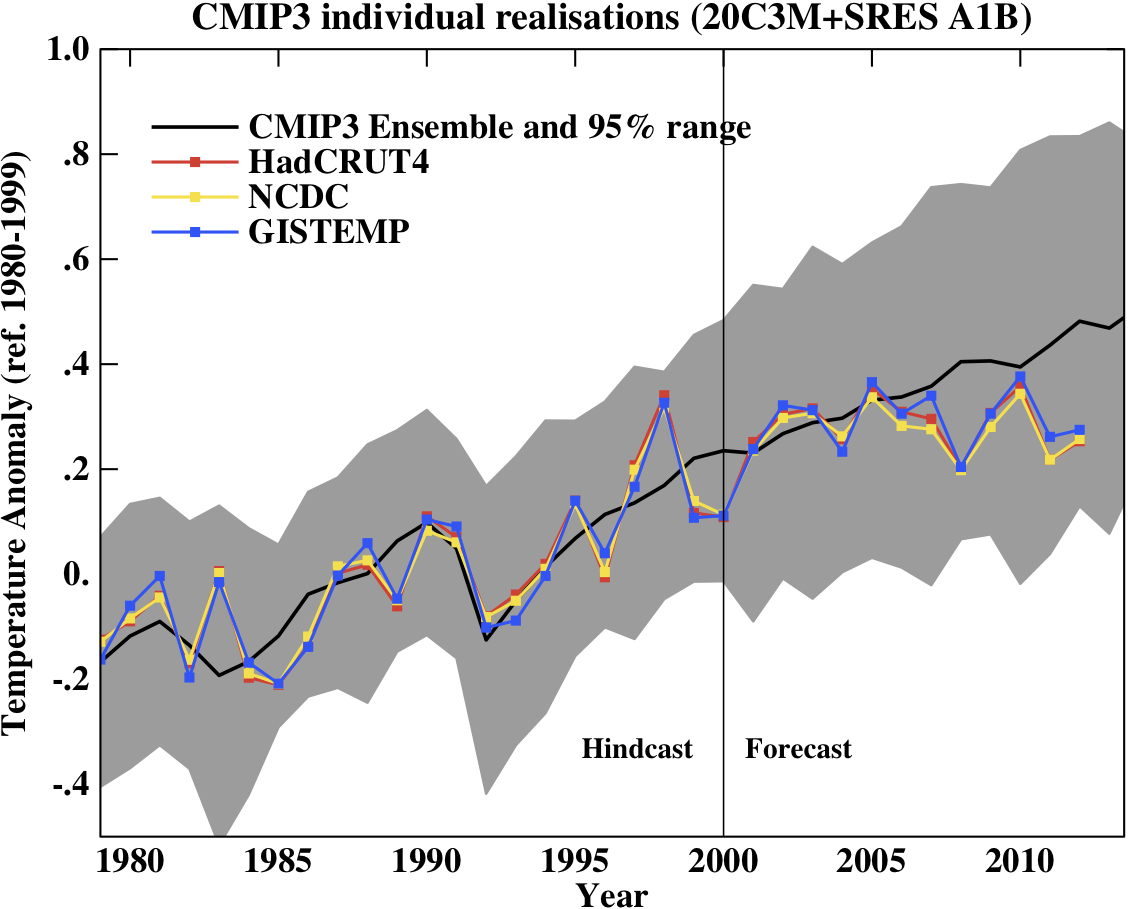
Last year I downloaded the model runs and was able to reproduce this figure with acceptable accuracy, so I am confident that it is correct (except for the last year of the observations).
-
Dumb Scientist at 07:55 AM on 22 May 2013Has the rate of surface warming changed? 16 years revisited
The volcanic signal however can vary a lot with the duration of the effect (depending of the timing of volcanoes with respect to your trend period). As a result, I suspect that applying the volcanic correction actually increases the uncertainty in the trend of the adjusted series, because of the uncertainty in the correction. This shows up in the huge difference in the adjusted trend between the 16 years and Hansen calculations. [Kevin C]
Sadly, I don't know much about this debate over the duration of volcanic aerosol effects. However, I was impressed by how well Pinatubo's aerosol effects were modelled (page 2), which ironically comes from Hansen et al. 2006.
Perhaps the volcanic effect could be viewed as the sum of an immediate effect (which seems to be more certain) and a delayed effect (which seems to be less uncertain). Kind of like how earthquakes have both co-seismic and post-seismic effects.
Your video removed the immediate volcanic effect, which probably reduces the uncertainties on the trend. The delayed effect might have been insufficiently removed, which means that some of the delayed effect joins all the other confounding factors that haven't been removed. That doesn't seem like a reason to withdraw the video.
Now, this is a particular problem for the video because the video made two very specific claims concerning uncertainty: Firstly that for the adjusted data the recent trend was not significantly different from the older trend, and secondly that the recent trend was highly significant (i.e. different from zero).
One thing I didn't like about the video was that you showed the trends with no uncertainties. It might be better to show them as in the SkS trend calculator. But that's just nitpicking on my part.
Regarding the first claim. I think it's important to stress, as I did in my first comment, that the recent trend isn't statistically significantly different from the older trend even when using the unadjusted data.
Even without taking the values of the trends into account, these claims are compromised. If the uncertainty in the adjusted trend is large, the first claim is rendered meaningless and the second claim false. That is the basis for withdrawing the video.
I doubt that the uncertainty of the adjusted trend is larger than that of the unadjusted trend. First, the uncertainty added by the delayed effect would have to be larger than decreased uncertainty due to removing the more certain immediate effect. I haven't done the calculation, but the graph on page 2 makes me suspect that's not true.
Second, that difference would have to be bigger than the decrease in uncertainty due to removing ENSO and solar variations.
-
MA Rodger at 07:37 AM on 22 May 2013The anthropogenic global warming rate: Is it steady for the last 100 years? Part 2.
KK Tung @80.
I would suggest that the tiny up-tick at the end of the black trace (which is evidently HadCRUT3 annual data) makes this HadCRUT3 to at least 2005, not 2004.
Moderator Response:[JH] Mispelling of Dr Tung's name has been corrected.
-
Kevin C at 07:07 AM on 22 May 2013Has the rate of surface warming changed? 16 years revisited
Dumb Scientist: I think you've hit the nail on the head - reducing the uncertainty in the trend is the key part of Foster and Rahmstorf. But I disagree with your conclusion about the video. Here's why:
The Foster and Rahmstorf calculation reduces the trend uncertainty because it takes out a lot of the confounding factors which act as noise in the trend calculation. However, the uncertainty in the result does not arise from the deviations from linearity alone - it must also account for uncertainty in the adjustments which have been made. So if you are uncertain about the duration of the volcanic response, that needs to be figured into the adjusted trend. (Propogating the uncertainties is possible but not easy - I haven't done it.)
So how uncertain are the contributions? The ENSO term seems very robust - it's comes out much the same whatever calculation you do. So the ENSO-removed temperature series will indeed give trends with reduced uncertainties.
Solar is a bit less certain, but it's not very large.
The volcanic signal however can vary a lot with the duration of the effect (depending of the timing of volcanoes with respect to your trend period). As a result, I suspect that applying the volcanic correction actually increases the uncertainty in the trend of the adjusted series, because of the uncertainty in the correction.
This shows up in the huge difference in the adjusted trend between the 16 years and Hansen calculations.
Now, this is a particular problem for the video because the video made two very specific claims concerning uncertainty: Firstly that for the adjusted data the recent trend was not significantly different from the older trend, and secondly that the recent trend was highly significant (i.e. different from zero).
Even without taking the values of the trends into account, these claims are compromised. If the uncertainty in the adjusted trend is large, the first claim is rendered meaningless and the second claim false. That is the basis for withdrawing the video.
I'd really like to wait for new results on coverage and SST bias before redoing the video (it was a lot of work), but it's a shame to lose the educational material about contributions to the temperature trend.
-
KR at 06:55 AM on 22 May 2013The anthropogenic global warming rate: Is it steady for the last 100 years? Part 2.
Dr. Tung - "...I think I have answered your questions in part 2 of my post, in the last section"
I would strongly disagree; Bob Loblaws' points about the circularity in definition of temperature from temperature (or rather, the difficulty of distinguishing between components of the same measure) are unaddressed - forcings have not followed a linear trajectory over this century, hence a linear detrending of the AMO is guaranteed to leave external forcing in that definition. (Aerosol uncertainties, I will point out, do not linearize total forcings.)
Enfield and Cid-Serrano 2010, who you refer to as support for your methods (as I noted before), consider Trenberth and Shea 2006 correct about the failings of a linear detrending, and they instead use a quadratic detrending - a much closer fit to the upwards acceleration in total forcings over the last century. Ting et al 2009 using EOF analysis find that linear detrending is inappropriate for an AMO definition, and they "...argue that the globally averaged surface temperature appears to be a good proxy for the temporal march of externally forced variability and that most of the latter is globally synchronous, albeit nonuniform spatially".
I therefore cannot consider a linearly detrended AMO appropriate in a global warming attribution study - that is contradicted by a significant part of recent literature, as aliasing significant portions of the forced signal.
As a separate piece of evidence, the thermodynamic considerations pointed to by Anderson et al 2012 and by Issac Held (thank you for that interesting reference, Bob) argue that the 40% contribution to warming found with a linearly detrended AMO is inconsistent with observed ocean heat content by a factor of 2-4x. OHC is a constraint upon internal variability, and a 40% internal variability fails that constraint. I'm disappointed that you have not responded to that issue in any fashion.
---
It would be quite interesting to evaluate and compare the attribution percentages under other definitions of the AMO (detrended with global MST or a quadratic, for example) - and whether such estimates are consistent with external constraints such as OHC. But I believe there are significant issues with the attributions you have derived in the current work, issues coming from the AMO definition used - issues which require consideration.
-
Dikran Marsupial at 06:41 AM on 22 May 2013The anthropogenic global warming rate: Is it steady for the last 100 years? Part 2.
Prof. Tung There is no statistically significant evidence for a change in the underlying rate of warming since 1998, so I think it is not scientifically correct to claim there has been a hiatus in global mean surface temperatures since then. The statistical power of the appropriate hypothesis test would be even lower for a trend starting in 2004. As OHC has continued to rise, it seems clear that the apparent hiatus is likely to be due to transport of heat between surface and deep oceans, and so it would be unwise to assume that the apparent hiatus means anything with regard to the forced response. However I think it would be better to discuss this sub-topic on the other thread that Dumb Scientist mentioned so as not to dilute the discussion of the paper.
In short, in order to claim there has been an actual hiatus in warming, rather than merely an artefact of the noise, that hypothesis should be subjected to a formal statistical hypothesis test. The eye is only too prone to seeing patterns in noise that don't actually exist, which is why as scientists we use statistics.
Moderator Response:[Dikran Marsupial] link added to make the more appropriate thread for this topic easier to locate.
-
Bob Loblaw at 06:33 AM on 22 May 2013The anthropogenic global warming rate: Is it steady for the last 100 years? Part 2.
Dr. Tung @80:
Your last section says "It is in the same spirit that the AMO index, which is a mean of the detrended North Atlantic temperature, is used to predict the global temperature change." [Emphasis added]
As Dumb Scientists has given a far more detailed discussion you may wish to respond to, I will temporarily step back again by saying that "in the same spirit" is not particularly convincing. You may have good intentions, and you may have some insight as to why you think that the AMO is good enough, but you haven't conveyed it here and it is a hugely important assumption.
On the other hand, Dumb Scientist is providing a much more convincing argument as to why your methodology causes problems.
-
wingding at 06:30 AM on 22 May 2013Has the rate of surface warming changed? 16 years revisited
good question. Has the rate of surface warming changed?
There are many ways of looking at that question. Dumb Scientist above points out one method. Another, more inferior, method is to just compare how longterm trend has actually changed with more data. Using skepticalscience trend calculator and HadCRUT4:
The 1970-2000 trend is 0.169 +- 0.056C/decade
The 1970-present trend is 0.164 +- 0.031C/decade
There's no major change there then.
A better way of looking at it using GISTEMP is this animation from Tamino which shows there is no inconsistency with the prior rate of warming:
http://tamino.files.wordpress.com/2012/12/giss.gif
The important feature of all three of these methods is that they compare two periods. This cuts to the heart of the question "has warming stopped" or "has warming slowed down". To answer that you need to compare some statistic of a recent period with the same statistic of a prior one.
But in contrast the popular method, that pushed by fake skeptics, involves just analyzing a single period. Just sticking a trend line through a recent period (eg 1998-present) and declare it has no warming with no comparison to a prior period (or at least no mention of the confidence ranges).
Fake skeptics have been banging this drum so much that I am afraid even many scientists are being influenced into believing faulty conclusions repeated often based on incorrect methods for assessing warming trends.
-
KK Tung at 06:21 AM on 22 May 2013The anthropogenic global warming rate: Is it steady for the last 100 years? Part 2.
In reply to post 77 by MA Roger: My typo. Not 17 years. Some said the hiatus is since 1998, but I don't want to count that because 1997/8 was a warm El Nino. I personally would say the broad leveling off of warming is since 2004/5. You cannot see the leveling off in Figure 9.5, which is up to 2004. The figure up to 2011 using HadCRUT4 is in our paper. 2012 is now available, and it is even lower.
-
KK Tung at 06:14 AM on 22 May 2013The anthropogenic global warming rate: Is it steady for the last 100 years? Part 2.
In reply to post 75 by Bob Loblaw: I think I have answered your questions in part 2 of my post, in the last section.
-
Dumb Scientist at 05:49 AM on 22 May 2013The anthropogenic global warming rate: Is it steady for the last 100 years? Part 2.
In my first post, I discussed the uncertainty regarding the net anthropogenic forcing due to anthropogenic aerosols, and why there is no obvious reason to expect the anthropogenic warming response to follow the rapidly increasing greenhouse gas concentration or heating, as DS seemed to suggest. [KK Tung]
I suggested that anthropogenic forcings were faster after 1950. In response, you discussed logarithms and aerosols that were already taken into account in the IPCC radiative forcings chart I originally linked:

Then you linked to that same forcings chart and linked to another:
 - radiative forcings")
The estimates you linked both show that anthropogenic forcings increased faster after 1950. So do the GISS and Potsdam estimates. Perhaps all these estimates are wrong, but you can't prove them wrong by assuming linearity for anthropogenic forcing.
We did not assume linearity for anthropogenic forcing. In the post we used a number of nonlinear anthropogenic indices. [KK Tung]
Again: You regressed global surface temperatures against the AMO in order to determine anthropogenic warming. Because the AMO is simply linearly detrended N. Atlantic SST, this procedure would only be correct if AGW is linear. Otherwise you'd be subtracting AGW signal, sweeping some AGW into a box you've labelled "natural" called the AMO.
Physical justification of AMO being mostly natural or anthropogenically forced needs to precede the choice of the index. This was what we did in our PNAS paper. [KK Tung]
I already addressed this point: Removing the AMO to determine anthropogenic warming would only be justified if detrending the AMO from 1856-2011 actually removed the trend due to anthropogenic warming.
There is a concern that the AMO index used in our multiple regression analysis is a temperature response rather than a forcing index. Ideally, all predictors in the analysis should be external forcings, but compromises are routinely made to account for internal variability. [KK Tung]
Predictors are compromised to the extent that warming the globe also changes those predictors. Not all such compromises are created equal.
The solar forcing index is the solar irradiance measured outside the terrestrial climate system, and so is a suitable predictor. Carbon dioxide forcing is external to the climate system as humans extract fossil fuel and burn it to release the carbon. Volcanic aerosols are released from deep inside the earth into the atmosphere. In the last two examples, the forcing should actually be internal to the terrestrial system, but is considered external to the atmosphere-ocean climate system in a compromise. [KK Tung]
These barely qualify as compromises. Global warming doesn't force humans to burn fossil fuels. Also, there's no published mechanism (that I know of) linking global warming to volcanic activity.
Further compromise is made in the ENSO "forcing". ENSO is an internal oscillation of the equatorial Pacific-atmosphere system, but is usually treated as a "forcing" to the global climate system in a compromise. [KK Tung]
This is more of a compromise, as I noted: "Even though global warming might indirectly affect ENSO, it's important to note that it hasn't yet: the ENSO index doesn't have a significant 50-year trend. This means it can be subtracted without ignoring AGW."
Because ENSO doesn't have a significant multidecadal trend, this ENSO compromise can't (and doesn't) ignore AGW over multidecadal (i.e. climate) timescales.
It is in principle better to use an index that is not temperature, and so the Southern Oscillation Index (SOI), which is the pressure difference between Tahiti and Darwin, is sometimes used as a predictor for the ENSO temperature response. [KK Tung]
I agree: it's better to use an index that isn't temperature.
However, strictly speaking, the SOI is not a predictor of ENSO, but a part of the coupled atmosphere-ocean response that is the ENSO phenomenon. In practice it does not matter much which ENSO index is used because their time series behave similarly. [KK Tung]
It wouldn't matter much even if you forgot to regress against ENSO altogether, because ENSO doesn't have a significant multidecadal trend. Regressing against ENSO primarily reduces the uncertainties on the recent multidecadal trend; it doesn't significantly change that trend.
It is in the same spirit that the AMO index, which is a mean of the detrended North Atlantic temperature, is used to predict the global temperature change. It is one step removed from the global mean temperature being analyzed. [KK Tung]
The AMO index is a seriously compromised predictor because warming the globe also warms the N. Atlantic, and anthropogenic forcing is faster after 1950. I've obviously failed to communicate this point, which is why I asked you two questions:
Question 1
Would regressing global surface temperatures against N. Atlantic SST without detrending the SST remove some anthropogenic warming from global surface temperatures?
Yes or no?
Question 2
Now suppose we regress global surface temperatures against N. Atlantic SST after linearly detrending the SST. In other words, we regress against the standard AMO index as Tung and Zhou 2013 did.
Just imagine that anthropogenic forcings increased faster after 1950. In that case, would regressing global surface temperatures against the AMO remove some anthropogenic warming from global surface temperatures after 1950?
Yes or no?
I'll start: my answers are yes and yes. In fact, I think answering yes to question 1 also implies a yes to question 2, but I'm willing to be educated.
Since you never answered these questions, I have to guess at your answers:
By "the upward trend of the AMO" I assume you are referring to the North Atlantic mean SST, because AMO is supposed to be detrended. I agree that anthropogenic forcing can force an upward trend in the N. Atlantic mean SST. In fact I am quite certain of it. [KK Tung]
Linearly detrended, which means that nonlinear anthropogenic forcing can force a recent upward trend in the AMO. Regardless, your certainty seems to imply that you'd answer "yes" to my question 1. That's fortunate, given that N. Atlantic SST are highly correlated with global surface temperatures:

You've repeatedly pointed out that you used a nonlinear anthropogenic index, and that the result is "very close" to the result using a linear index. Perhaps that's why you think that it's possible to answer yes to question 1 but no to question 2?
If so, I disagree. Because N. Atlantic SST and global surface temperatures are so highly correlated, I think bouke was right to point out that any other predictor will just be a distractor. I suspect that's why you get answers that are "very close" regardless of the assumed anthropogenic index. Unfortunately, I haven't found your code online, and don't have the time to independently reproduce your methodology.
There is a very nice blog by Isaac Held of Princeton, one of the most respected climate scientists, on the AMO debate here. [KK Tung]
I also respect Isaac Held, which is why I linked that post as well as this one:
"... While the specifics of the calculations of heat uptake over the past half century continue to be refined, the sign of the heat uptake, averaged over this period, seems secure - I am not aware of any published estimates that show the oceanic heat content decreasing, on average, over these 50 years. Accepting that the the sign of the heat uptake is positive, one could eliminate the possibility of [the fraction of the temperature change that is forced] < ~3/4 ..." [Isaac Held]
Note that Isaac Held's analysis is based on thermodynamics, not curve-fitting the AMO. As such, when he claims that the fraction of the temperature change over the last 50 years due to internal variability is less than ~25%, he's summing over all modes of internal variability, not just the AMO. As I've discussed, this is essentially the same conclusion reached by Huber and Knutti 2012.
As KR noted, Anderson et al. 2012 says that less than 10% of the warming over the last 50 years could be due to internal variability.
Your claim of ~40% is inconsistent with studies that base their claims on thermodynamics rather than curve-fitting.
You probably are aware of the discussions on the recent hiatus in warming for the past 17 years. [KK Tung]
I'm aware that there hasn't been a statistically significant change in the surface warming rate.
-
MA Rodger at 05:49 AM on 22 May 2013The anthropogenic global warming rate: Is it steady for the last 100 years? Part 2.
@76 - "You probably are aware of the discussions on the recent hiatus in warming for the past 17 years."
I cannot say that I am.
"...the past 17 years" you say? Would that be 1996-2013? Where abouts on AR4 fig 9.5a is there such a "hiatus" evedent (bearing in mind that AR4 fig 9.5a shows "the observation ... (black curve)" to 2005 if not 2006)?
-
Tom Dayton at 05:12 AM on 22 May 2013Has the rate of surface warming changed? 16 years revisited
I agree with Dumb Scientist, that there is no reason to withdraw the video. Don't let the perfect be the enemy of the good!
-
KK Tung at 04:25 AM on 22 May 2013The anthropogenic global warming rate: Is it steady for the last 100 years? Part 2.
In reply to post 73 by Jason B and post 74 by Dikran: I accept your position. I understand that this is a necessary step for you before we can move forward. I was just becoming impatient because I was trying to make two simple points about Figure 9.5 in AR4, and then use the time available to go back to reply to some of the interesting (to me at least) comments that were posted here. I barely made the first point about that figure before being distracted.
The first point is, we can use the model ensemble mean as a proxy for the forced response in the observation. Since the observation contains both forced response and internal variability, comparing the ensemble mean from a model and the observation may tell us something about the presence of the internal variability. I saw the possibility of internal variability explaining about half of the observed early twentieth century warming. This is not a firm conclusion because afterall the models may contain systematic errors. If the models were perfect, this impression could be made into a firmer conclusion.
The second point concerns comparing Figure 9.5a with Figure 9.5b (the figure is shown in post 65 by JasonB), still assuming that the model ensemble mean serves as a proxy for the forced response in the observation. The interpretation is that in the second half of the twentieth century, CMIP3 models used by AR4 produced all the observed warming by anthropogenic forcing. Without anthropogenic forcing, Figure 9.5b shows that the all-model ensemble mean (the blue curve), has no warming or even negative warming. Figure 9.5a shows that with anthropogenic forcing, the all-model ensemble mean reproduces the observation very well (compare the blue red curve with the black curve). Since we all agreed earlier that the observation should contain internal variability as well as forced response, this is telling us that the AR4 models do not need internal variability to simulate the observation during the second half of the twentieth century.
You probably are aware of the discussions on the recent hiatus in warming for the past 17 years. A possible explanation is that that is caused by internal variability. The CMIP3 models, which do not need internal variability to explain the accelerated warming since 1980, have projections that overshoot the observation in the recent decades, beyond the 95% range. While we could still take the position that this is fine, because one can always add back internal variability when we need it to explain the difference, it becomes rather awkward to only insert an internal variability that cools for the past 17 years and not a warming internal variability during the period of accelerated warming. In any case, we do not have a coherent sense of the internal variability in the warm vs cool episodes in the observation.
-
Dumb Scientist at 03:40 AM on 22 May 2013Has the rate of surface warming changed? 16 years revisited
A few months ago I calculated trends and uncertainties for the UAH data. The second page of that PDF has a black line for the trends of the UAH data up to 2012 for different starting years. The red lines are 95% confidence uncertainty bounds which account for autocorrelation with ARMA(1,1) noise. Notice that the larger uncertainty bounds of more recent trends overlap with the smaller uncertainty bounds of the longer trends. This means that there hasn't been a statistically significant change in the surface warming rate. Here's the R code if anyone's interested.
It's even easier to use the SkS trend calculator to confirm that there hasn't been a statistically significant change in the surface warming rate. Here's an example:
GISTEMP, 1990-2000: 0.201 ±0.322 °C/decade
GISTEMP, 2000-2010: 0.096 ±0.256 °C/decade
Note that the error bars overlap, showing that there hasn't been a statistically significant change in the surface warming rate. I've tried many datasets with many potential change points, and so far all their error bars overlap.
As you say, the total energy content of the climate is a more direct measure of global warming. It's also worth pointing out that global land ice and global sea ice continue to decline, absorbing heat without warming as they melt.
Troy's analysis is interesting; I'm still reading it. However, I don't think it's necessary to withdraw the video. In my view, Foster and Rahmstorf 2011 was merely trying to improve the signal-to-noise ratio of the surface temperature record by accounting for some extraneous influences. I even pointed out that other influences like multidecadal oscillations haven't been removed.
But that's not a fatal flaw, because it's impossible to remove all extraneous influences. Similarly, when a better estimate of the long-term effects of Pinatubo becomes available, that will build upon previous work rather than demolishing it.
Prev 896 897 898 899 900 901 902 903 904 905 906 907 908 909 910 911 Next


