


 Arguments


Recent Comments
Prev 962 963 964 965 966 967 968 969 970 971 972 973 974 975 976 977 Next
Comments 48451 to 48500:
-
chriskoz at 15:49 PM on 19 February 2013Geologic Time and Climate Change Science
the first 4 billion years or so is little known compared to the last .5 billion years
I though it was typo until I spotted the dot when I pasted it here :). it'd better be "last 500 million".
-
chriskoz at 13:44 PM on 19 February 2013There is no such thing as climate change denial
Well said Tom,
Consilience or convergence or concordance of evidence would all have been more precise phrases here (and would need to be used in a scientific report) but the term "climate science consensus" has been stuck for so long in popular media that we all subconciously know what it means.
It would be nice if MohamedY@18 pointed out to John that his popular term is imprecise and suggest the precise alternative from above but "I stopped reading [because this term] is BS" is not only impolite but perhaps abusive and even moderation might be in order here.
-
Tom Curtis at 12:50 PM on 19 February 2013We're heading into an ice age
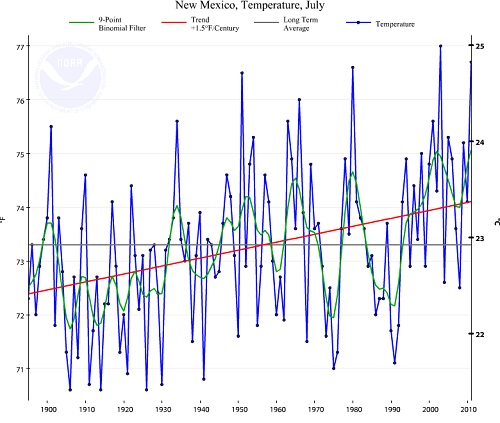
Kevin @302, the first thing to notice is that the modern average is not necessarilly the average over the last few decades. Indeed, by convenction, in paleographic studies the present is 1950 unless otherwise stated. The article your denier propaganda site refers to is behind a paywall, so I am unable to determine which interval was used to determine the "modern average". I am able, however, that they determine an annual average temperature as a function of the reconstructed July temperature, and that their modern annual average of 11 C corresponds to a July temperature of 22 C. Further, the warmest temperature they show for July approximately 2000 years ago (see Table 2). The NCDC shows the twentieth Century average of July temperatures in New Mexico to be just under 23 C, so it appears the "modern average" is below the average over the 20th century. For comparison, the average over the last decade to be around 23.5 C (the equivalent of a mean annual temperature of 1.25 C above the twentieth century mean). The peak modern July temperature is 25 C, the equivalent of 2.5 C above the "modern average". In other words, it appears that the reconstruction does not show temperatures higher than that of the late twentieth century at all. (Treating studies showing warming greater than 1950, or in one case 1895 as being warmer than the late twentieth century has been a common denier trick.)
Second, if you look at the following graph you will see that warm and cold periods at different locations do not coordinate in time. Ergo simply picking out a location and saying it was warmer at some time in the past, and then a different location and saying it was warmer in the past does not tell you anything about whether the global average is warmer. To do that you need a multiproxy reconstruction. Oddly deniers have been unwilling to make multiproxy reconstruction despite all the purported examples of warmer temperatures in the past they claim to have found. Note that I say purported because what deniers claim, and what was actually found in the scientific study often differ widely (as shown above). I personally suspect that this unwillingness to make reconstructions is because the deniers know that any such attempt will give the game away.
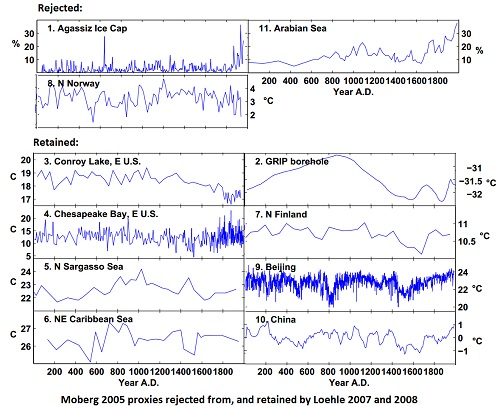
There is one exception to the rule about deniers and reconstructions. Loehle (2007), and in particular as corrected by Loehle and McCulloch 2008 (Link for both papers). There are a few oddities about that reconstruction. First, many of the proxies used had previously been used by Moberg 2005, who Loehle cites as a source. Not all of Moberg's non-treering proxies were used, however, as shown in the graph above. One wonders why Loehle found it necessary to develop a methodology that excluded the Agassiz Ice Cap and Arabian Sea proxies, for example.
Of greater concern is that Loehle simply takes the average of all proxies to determine his reconstruction. The problem with that is found in this map of the location of his proxies (from Loehle and McCulloch 2008):

A quick count shows that 10 of his 18 proxies come from around the North Atlantic; another 4 come from China, and two each from Indonesia and South Africa. That is, they are heavily localized. Simply taking a mean of the values treats the North Atlantic (including Europe and North America) as though it constituted 56% of the Earth's surface; China as though it were 22%; Indonesia and South Africa as though they were 11% each; and the entire rest of the globe as though it did not exist.
What is even odder is that reconstructions using more widely dispersed proxies have shown where was warm, and where cool in the MWP. Curiously the distribution of proxies used by Loehle gives most weight to the area that was warmest, the next most weight to the next warmest area, and zero weight to any area that was known to be cool. It is an extraordinary coincidence.
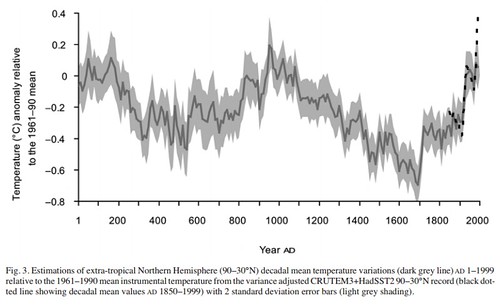
And despite all these biases, it turns out that Loehle's reconstruction still shows a RWP and MWP cooler than the late twentieth century (note the instrumental record shown as a dashed line):
It is no wonder deniers don't like reconstructions.
And it is also no wonder that people who are interested in science want to see them; because if you haven't made the effort of making a reconstruction, you have not analyzed which intervals are warmer or cooler than others. At most you have attempted to pull wool over peoples eyes with an assortment of random facts.
-
scaddenp at 11:38 AM on 19 February 2013We're heading into an ice age
Your point? Global temperature reconstructions are estimated from a network of proxies from locations around the globe. If you think this one place is significant, then why do you deny the significance of other proxies, or those places where ice retreat is exposing bare rock for first time since HCO ?
-
Steve8234 at 11:05 AM on 19 February 2013Geologic Time and Climate Change Science
Here is my attempt to illustrate the vast evolutionary timeline, not the geological timeline. (I know it's know outdated).
http://andabien.com/html/evolution-timeline.htm
You can find a desciption of an imaginary movie, taking one year to view, depicting evolution on earth.
-
JasonB at 10:57 AM on 19 February 20132013 SkS Weekly News Roundup #7
As Chomsky has pointed out, it is illegal in America, for the CEO or other employees of a publically quoted company to do anything other than to try to maximise the stock value of their company, and thus profit to shareholders.
Sorry for being OT, but is this really true? "Illegal", to me, implies statutes to that effect. Does America really have statutes requiring CEOs to do nothing other than to try to maximise stock value, or is it in reality something taken as implied by their normal fiduciary duty, possibly coupled with some common law precedents where shareholders have sued directors?
-
Tom Curtis at 10:02 AM on 19 February 2013There is no such thing as climate change denial
John Cook @20, I don't think this has anything to do with your being a physicist. People scoring merely verbal points by obtusely not recognizing a metaphore when they see one is a product of those people desperately clinging to beliefs for which they have no real evidence that they could adduce.
-
scaddenp at 09:02 AM on 19 February 2013There is no such thing as climate change denial
"Consilience" is a excellent term - well defined and accurate. Perfectly applied to climate science.
-
John Cook at 08:28 AM on 19 February 2013There is no such thing as climate change denial
Re "consensus of evidence", I try to be poetic and the literalists jump all over me. Maybe this is what happens when a physicist tries to get creative with language. I could've said "consilience of evidence" but most people respond "consili-whatnow?!"
-
gws at 08:22 AM on 19 February 2013No alternative to atmospheric CO2 draw-down
Kevin, maybe you can enlighten us about what your actual complain is?
The author says it his first sentence, which you quoted ("This article suggests ..."), what he is going to be writing about, then makes a coherent argument with references to primay literature. You do not do anything of that kind, so why are you here?
-
Andy Skuce at 07:25 AM on 19 February 2013Geologic Time and Climate Change Science
The excellent "fingernail" analogy, which rockytom uses was first used (I think) by John McPhee in his wonderful book Basin and Range, which I would recommend to everyone. Stephen Jay Gould ( no slouch himself when it came to writing on science) later used the metaphor in his book Time's Arrow, Time's Cycle. His version, as quoted on the Wikipedia article on Deep Time is as follows:
Consider the Earth's history as the old measure of the English yard, the distance from the King's nose to the tip of his outstretched hand. One stroke of a nail file on his middle finger erases human history.
I touched on the importance of understanding deep time and basic geological principles in my SkS article on my own struggle to come to terms with climate change.
More recently, Andrew Glikson has shown here how current anthropogenic processes are proceeding at a rate far faster than past natural processes.
Moderator Response: [rockytom]You are correct, Andy. It was McPhee's use of the analogy that I was thinking of when I wrote the above post. Stephen Jay Gould was one of my favorite people and he also used the analogy. I guess I don't know who first used it. I met Gould in the mid 1970s and was saddened by his untimely death. -
Kevin8233 at 07:17 AM on 19 February 2013No alternative to atmospheric CO2 draw-down
This whole article is an opinion piece. There is no back up to it.
The scale and rate of modern climate change have been greatly underestimated
The leaked AR5 shows that this statement is not true, and no, I don't think it's required to link to that, as it is in many places. There was even a discussion here on Ridley's predictions being wrong, with the IPCC's being closer - but ALL above the actual temp. So the author's statement is clearly wrong. Where is his back up? (-snip-)?
This article suggests that the current atmospheric CO2 level is already triggering amplifying feedbacks from the Earth system and therefore, in themselves, efforts at reduction in atmospheric CO2-emission are no longer sufficient to prevent further global warming.
Again, without any backup, this is just opinion. The author can (-snip-) anything he wants. Where is his proof that amplifying feedbacks are already triggerred, and more importantly, where is his proof that a reduction of CO2 is no longer sufficient.
Moderator Response:[DB] Please note that posting comments here at SkS is a privilege, not a right. This privilege can and will be rescinded if the posting individual continues to treat adherence to the Comments Policy as optional, rather than the mandatory condition of participating in this online forum.
Moderating this site is a tiresome chore, particularly when commentators repeatedly submit comments in violation of this site's Comments Policy. We really appreciate people's cooperation in abiding by the Comments Policy, which is largely responsible for the quality of this site.
Finally, please understand that moderation policies are not open for discussion. If you find yourself incapable of abiding by these common set of rules that everyone else observes, then a change of venues will be the offing.
Please take the time to review the policy and ensure future comments are in full compliance with it. Thanks for your understanding and compliance in this matter.
All-caps usage and moderation complaints snipped.
-
Don9000 at 07:06 AM on 19 February 2013Geologic Time and Climate Change Science
Good work, Chris!
-
Kevin8233 at 06:25 AM on 19 February 2013We're heading into an ice age
And finally, why do you regard evidence that it was warmer then than now in just one region of the world (evidence you have so far failed to produce) as proof that it was warmer than globally rather then now?
http://hockeyschtick.blogspot.com/2013/01/new-paper-finds-new-mexico-was-warmer.html
This paper shows temps from New Mexico area.
-
Don9000 at 04:54 AM on 19 February 2013Geologic Time and Climate Change Science
Glad to provide it, Tom. Stephen Jay Gould wrote a number of natural history essays that touch on deep time, sometimes directly, sometimes less so. In one that I recall, he pointed out that early on in the evolution of vertebrates there was a great deal of "experimentation" on just how many digits a limb should have. He cited multiple examples of animals with more than the usual five to make the point that evolution spun out many different options at various points in deep time, and I believe he also pointed out that the fossil record is so fragmentary that we really have no idea just how rich life was way back when.
In the same way we have a hard time reconstructing climate conditions from way back then, we also don't have a good sense of what complete ecosystems looked like even a few thousand years ago. We only need consider some very recent extinctions or near extinctions to grasp that modern humans inhabit a landscape that, despite our perceptions to the contrary, is dramatically different from what it was only a couple hundred years ago. The two things I'm thinking of are the American chestnut and the Passenger Pigeon. Both were ubiquitous in the eastern third of the US and their absence has altered the physical landscape we inhabit in ways we will probably never fully understand. I suspect global warming, even if we prevent its most catastrophic impacts, will, two hundred years hence, have effected staggering changes to the places we call home.
This will be a great cultural loss, amongst other things. When I travel in England, I often have the sense that the landscape I'm seeing, with its fields, hedgerows, and woodlots and their accompanying array of species, is still relatively similar to what Shakespeare or William the Conqueror would have seen. I doubt people in two hundred years will be able to maintain that same connection. In other words, global warming, like indiscriminate hunting or the introduction of a new virulent disease, acts like an accelerant on the natural processes of change that go on all the time.
-
Christopher Gyles at 04:35 AM on 19 February 2013Geologic Time and Climate Change Science
Twain essay here
-
Bob Lacatena at 03:54 AM on 19 February 2013It's the sun
I love that when such a graph clarifies a scientific point, it's propaganda, but when it appears to prove that all of the world's climate sceintists are engaged in a gigantic hoax-conspiracy, it's laudable citizen science.
And these people don't recognize their irrational, internal bias.
-
Bob Loblaw at 03:51 AM on 19 February 2013It's the sun
...and following up on what I asked in #1062:
If you provide the request % changes, then can you also tell me what the % change is for the following?
a) 32F to 14F?
b) 14F to 32F?
c) 41F to 23F?
d) 23F to 41 F?
...and if they are not the same as the % for the examples in degrees C, can you explain why? -
Bob Loblaw at 03:43 AM on 19 February 2013It's the sun
fmbatchelor @1060:
OK. If what you say is true, then can you tell what the percentage change in temperature is when the absolute change is:
a) 0C to -10 C
b) -10C to 0C?
c) +5C to -5C?
d) -5C to +5C?
Or perhaps you'd like to reword your claim?
-
Tom Curtis at 03:10 AM on 19 February 2013Geologic Time and Climate Change Science
Don, I enjoyed the analogy. Putting it in terms of the figure above:
The last section (10) is the duration since the extinction of the dinosaurs.
The black line (1 pixel wide) represents the time since humans diversified from our common ancestors with Chimpanzees.
Homo sapiens has been around for 4% of the final pixel.
Civilization has been around for 0.2% of the final pixel.
And the time since the industrial revolution represents the last 0.003% of the final pixel.
-
Tom Curtis at 02:59 AM on 19 February 2013It's the sun
fmbatchelor @1060, really? So when I carefully scale change in ppmv of CO2 concentration and change in temperature in degrees C such that a the predicted transient climate responce in temperature for a given change in concentration matches the temperature scale, that would constitute propoganda in your book? Where as if I scaled them so that a change of 1 ppmv in CO2 concentration (0.25%) matches a change in temperature of 0.72 K (0.25%) that would not constitute propoganda, even though the later change in temperature is only predicted for an approx 90 ppmv change in concentration for the transient response? Frankly, I consider your suggestion absurd, and it is not one applied (to my knowledge) in any science. Indeed it could not be.
As it happens, the graph I take it you are criticizing has the scale it does because that is the scale chosen by advocates of the sun being the cause of the current warming to make their case. They now face a dilemma. If that scale is correct, than the lack of correlation after 1980 refutes their claim. If, on the ohter hand, the scale is incorrect, then they have established no relation between solar activity and temperature to begin with.
-
Tom Curtis at 02:45 AM on 19 February 2013We're heading into an ice age
Kevin @297, it is a shame that after the long wait you could only come up with a link to an article that I had previously linked to (@ 293, second link). It would have been nice if you had come up with something new. In this case the something new is a report of a new excavation of a late iron age, or possibly early Roman, vinyard (or possibly asparagus garden) in Hertfordshire.
It should be noted that viticulture probably survived in England throughout the dark ages, and certainly survived in England throughout the Little Ice Age, only ceasing after WWI, due to the commercial inability to compete with cheap French imports. It restarted in England following WWII. Given that, why do you regard the presence of vinyards in Roman Enland as proof it was warmer at that time than now rather than simply proof that it was not colder than the LIA (when grapes were also grown in England to make commercial wines)?
Also of interest is this study of modern viticulture in Baltic coastal regions. It shows this interesting map which shows commercial viticulture in Denmark and Sweden:
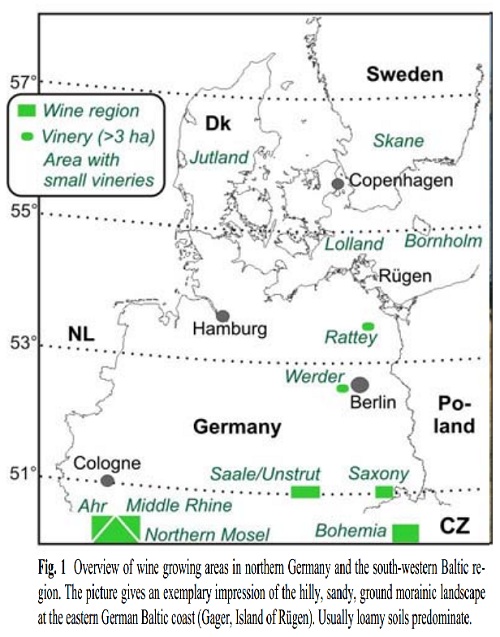
Again, given the northern distribution of commercial viticulture, which includes not only commerical vinyards in Denmark and Sweden, but vinyards being developed with the intention of becoming commercial in Scotland), why do you regard the presence of vinyards in more southerly regions in England as proof that the Roman Warm Period or Medieval Warm Period was warmer than current temperatures?
And finally, why do you regard evidence that it was warmer then than now in just one region of the world (evidence you have so far failed to produce) as proof that it was warmer than globally rather then now? -
Dikran Marsupial at 02:38 AM on 19 February 2013We're heading into an ice age
Cheers Andy, very interesting, the differing standards of acceptable evidence in archaeology and climatology is very evident (of course this is inevitable and not an indication of a problem with archaeology)!
-
Don9000 at 02:37 AM on 19 February 2013Geologic Time and Climate Change Science
One of the most creative takes on this subject is Mark Twain's short satirical essay "Was the Earth Made for Man?" Twain wrote this piece around 1900 when Darwin's theory of evolution had come under attack from scientists who, unaware of the processes of atomic decay that keep the earth's core nice and toasty warm, argued that our planet could not possibly be old enough to allow for all the time Darwin's theory seemed to require. One of the chief scientists in this debate was Lord Kelvin. Along with others, Kelvin believed thermodynamic realities limited the earth's age to 100 million years or less and he spent a lot of his intellectual energy in his later years making this point.
In his essay, Twain engages in the debate and uses the Eiffel Tower instead of a human's outstretched arms to indicate the span of time involved, and likens our time on the planet to "the skin of paint on the pinnacle knob at its summit." He has a great time pointing out that the poor deluded oyster, who showed up 19 million years into the scheme, might well be excused for thinking that the earth was created for him, but goes on to explain that the oyster was just one of many things created for man as part of God's great plan. It really is quite good.
The essay was suppressed more or less willingly by Twain during his lifetime and was not published until 1938, when it appeared in Letters from the Earth, a collection of Twain's most irreverent writings. Incidentally, the letters referenced in the title are purported to have been written by Satan about what he has learned about Man, God's great creation, to his best buddies Michael and Gabriel back in heaven and include a letter about how the Ark had to turn back to recover a housefly in order to preserve, not exactly for humanity's benefit, typhoid germs.
Anyway, tracking down a copy likely involves purchasing this book. Of course, the book is well worth the price, as it also contains things like the delightfully witty "Extracts from Eve's Autobiography," which is found in a series of similar spoofs under the heading "Papers of the Adam Family." In Eve's autobiography, we learn that Adam was the first scientist, and his first important discovery was that water flowed downhill. The book is thankfully readily available in a paperback reprint published by HarperPerennial.
-
fmbatchelor at 02:31 AM on 19 February 2013It's the sun
Whenever you see a chart that has unlike elements, i.e. W/m2 and temp C, on the Y axis superimposed ( -snip-) and they are not expressed in terms of percentage of change then you are witnessing propaganda.
Moderator Response: [DB] All-caps converted to bold, per the Comments Policy (which you need to read and internalize before commenting further). Inflammatory tone snipped. -
Andy Skuce at 02:13 AM on 19 February 2013We're heading into an ice age
There is a free-access, text-only version of that paper available here.
-
Dikran Marsupial at 01:53 AM on 19 February 2013We're heading into an ice age
Kevin, thanks for the link, it is a shame that the article is paywalled - it looks interesting (see also Toms comment). Please do take on board my comments in the previous post. We are happy to discuss science here, but you will get a much better reception if you make your points in a measured scientific, rather than a confrontational hubristic manner, especially as your previous comments suggest a lack of understanding of some important issues.
-
Kevin8233 at 01:33 AM on 19 February 2013We're heading into an ice age
http://antiquity.ac.uk/ant/075/Ant0750745.htm
Try this source for Roman Optimal Wine production n UK.
-
meb58 at 00:55 AM on 19 February 2013Increasing CO2 has little to no effect
I did not read this entire thread, so forgive my question.
There was a discussion above about co2 sequestration. I understand that the ocean's ability to 'buffer' additional co2 can be helpful at first blush. But buffering mechanisms, to my way of thinking, are trade-offs if you like. From my own botany and soil science background I understand that the chemical equation will 'buffer' in the other direction as well if conditions permit. Doesn't the buffered co2 bother us? I don't see it as a long term benefit; if we stop introducing co2 into the air today, the level can drop to a point where some of the co2 is re-released into the atmosphere...or is my science off?
-
meb58 at 00:38 AM on 19 February 2013Increasing CO2 has little to no effect
Regarding post # 64 by Stephen Baines:
I asked a question about the law of conservation in a different thread and rceived some very interesting and compelling - to me - answers from Tom Curtis and Bob Loblaw. They were clear and very helpful!Philosophically, I think it is important to be skeptical AND curious because the two fundamentally drive knowledge. The two above mentioned men have been extremely helpful in presenting science as I remembered it, but with much more fidelity.
I can only add here, questioning the limits our predictive powers, is that mother nature freely associates. I trust the science and I consider models as useful tools to help point to a condition that is possibly very harmful to our future. I cannot ignore, however, what I see...and for me it is sobering.
-
Tom Curtis at 00:33 AM on 19 February 2013There is no such thing as climate change denial
MohammedY @18, for the hard at reading, the 'consensus of evidence' is "...many different measurements pointing to a single, consistent conclusion". Of course, you already knew that. You just could not resist the temptation to pretend that pointing out that the term 'concensus of evidence' is a metaphore, and and pretending that represents a substantive comment. It is as if you wish that the term being metaphorical will make the evidence vanish.
-
MohamedY at 00:08 AM on 19 February 2013There is no such thing as climate change denial
I stopped reading when I reached the phrase "consensus of evidence". There is no such thing. The dictionary defines the word as "agreement in the judgment or opinion reached by a group as a whole". It involves people. So, what is consensus of evidence? Is it BS?
-
meb58 at 23:37 PM on 18 February 2013No alternative to atmospheric CO2 draw-down
To all thank you! Bob Loblaw, thank you for pointing me in the appropriate direction. I'll continue with a few uestions elsewhere.
Great community here! I appreciate the help.
-
meher engineer at 18:57 PM on 18 February 2013Analysis of Greenland Ice Cores May Provide Glimpse into Climate's Future
@2 Martin, Eric Stieg, who wrote about the Eemian results at Real Climate on 23 Jan 2013, was asked the question you ask by John S @ Comment7. wrote " Air content data mostly. From the paper:
'Before surface melt began between 128.5 and 126.7 kyr BP, the air content at the depositional site had a stable level of 85 ml kg−1 compared to the present level of 97.5 ml kg−1. When corrected for changing local summer insolation, the air content difference suggests a surface elevation at the depositional site 540 ± 300 m higher at the onset of the Eemian (128 kyr BP) than the surface elevation at NEEM today.'
The paper goes on to discuss the corrections for ice flow, which are significant, because the ice at the bottom flowed from a site that was higher. So the actual elevation change they estimate is about 200 m (with a big plus/minus of 350 m!). -eric" in reply.
-
gpwayne at 17:32 PM on 18 February 20132013 SkS Weekly News Roundup #7
@IDunno (2)
As Chomsky has pointed out, it is illegal in America, for the CEO or other employees of a publically quoted company to do anything other than to try to maximise the stock value of their company, and thus profit to shareholders. This then, is their agenda.
You're quite right, but there is another way of looking at the same requirement, and one that suggests a different strategy regarding climate change. If it could be argued that, by their inactions, board officers or other responsible employees had been negligent in respect to environmental threats to the business, those same employees could find themselves on the wrong end of lawsuits launched by investors whose stock value and dividends had deteriorated.
Business as usual may produce short term profits, but investors (particularly institutional ones like pension funds) will often take a longer view. I have long believed that the commercial world will have to come to terms with the reality of climate change, not because of science, but because otherwise they may fall foul of the same laws and definitions of responsibility you have quoted. In a litigious country like the US, there will be no end of lawyers seeking redress when profits start to tumble in keeping with share values, and it is for this reason I've advocated more focus on business activism and less on the regrettably unproductive governmental lobbying.
-
Tom Curtis at 17:06 PM on 18 February 2013A Glimpse at Our Possible Future Climate, Best to Worst Case Scenarios
Old Mole @37, the graphs show the difference in global mean surface temperature (GMST) from that estimated for 1750 for each year from 1900 onward. That is, each point ploted shows for a given year, the GMST for that year minus the GMST for 1750; but showing that does not say anything about the range of the x-axis.
-
Old Mole at 15:42 PM on 18 February 2013A Glimpse at Our Possible Future Climate, Best to Worst Case Scenarios
Pardon me, but is there some reason for one axis of figures 4, 5 and 6 to be labeled "Global Surface Warming since 1750" and the other axis starting in 1900?
-
Tom Curtis at 12:57 PM on 18 February 2013A Glimpse at Our Possible Future Climate, Best to Worst Case Scenarios
Icararus @34, the most appropriate climate sensitivity value to use is a complex issue, and depends both on time scale and the draw down rate of CO2. As has repeatedly been shown by David Archer and other scientists, the initial increase of CO2 conentration due to increased emissions will largely be absorbed by the ocean on a time scale of 100-300 years. After that draw down, approximately 20-30% of the initial CO2 increase will remain in the atmosphere, and will remain for a very long time (> 10,000 years). There are two important points from this.
First, for up to a hundred years after the increase in emissions, the most relevant climate response is the Transient Climate Response. If we increase CO2 concentration to about 1000 ppmv by the end of this century, we will experience the transient response to that, or about 3.65 C
As time progresses, the surface will tend to the equilibrium response, but over the same time period the CO2 concentration will fall rapidly on about the same time scale. What will be experienced in a hundred years or so, assuming we effectively cease emissions before then, will be (approx) the equilibrium response to a quarter of the peak CO2 concentration. For our 1000 ppmv scenario, we will experience the equilibrium responce to an increase of 460 ppmv (ie, preindustrial plus one quarter of the increase above preindustrial), or just over 2 degrees C.
As further time progresses, the full Earth System responce to the smaller long term increase will be experience, ie, something in the order of 3.55 C. Unfortunately the temperature increase of that magnitude will be with us for a period at least equivalent to the entire history of human civilization todate.
This scenario is no panacea. There is much devil in the detail. For example, should the time to the equilibrium response be shorter, we can expect a large temperature peak before the temperature declines with the initial decline in CO2 concentration. If a high proportion of initial emissions are in the form of Methane, there will also be a large initial spike in temperature prior to the Methane decomposing into CO2 and water vapour. Further, this scenario assumes a near total cessation of CO2 emissions, something that is not guarentted given that about 20% of emissions come from agriculture, and that there may be significant additional emissions in the form of feedbacks.
If you are interested, I have a spreadsheet showing indicative short and long term responses to various estimates of fossil fuel availability.
-
chriskoz at 12:49 PM on 18 February 20132013 SkS Weekly News Roundup #7
Agnostic,
I agree. It's known that mainstream climate scientists tend to eer on the side of caution and Meinshausen 2009 is no exception. For example Gavin has mildly criticised this paper for omitting the effects of CH4. However, Meinshausen did omit it on purpose, because the findings of Shakhova, no matter how alarming, cannot be decisively quantified and Meinshausenwanted the decisive quantification in order to speculate the FF industry future.
However that's not my point. My point is, that with such excellent standing of Meinshausen 2009 almost four years now, even the most hardcore deniers silently accepting its math, anyone who continues to finance FF industries is simply irrational nutter.
-
Riduna at 11:30 AM on 18 February 20132013 SkS Weekly News Roundup #7
Sorry, I know such things are not supposed to be said ..... but
Even the most influential science papers underestimate the consequences of continued fossil fuel burning because modeling fails to address the contentious issue of carbon feedback released from thawing permafrost and clathrate, particularly on and under the Siberian continental shelf. It is extraordinary that the findings and warnings of Shakhova, Semiletov and others are played down, dismissed or simply ignored. Is this folly the result of a realisation that carbon emissions from these sources make a 2°C limit on global warming impossible, a 3°C limit unlikely and a 5-6°C increase by 2100 a possibility?
-
mikeh1 at 10:14 AM on 18 February 2013There is no such thing as climate change denial
Good to see that John's article has been reprinted in the The Age and is also currently the lead story in the Google News science section.
-
Tom Curtis at 09:31 AM on 18 February 2013No alternative to atmospheric CO2 draw-down
meb58 @30, mass is converved, but the atmosphere is not a closed system. To better understand the relationship, consider the following chart of changes in O2 and CO2 concentratration between 1990 and 2000:

(Source: IPCC TAR, discussed in greater detail here.)
The essential points are that after the combustion of fossil fuels, ocean and land uptake of CO2, and outgassing of O2 from the ocean, there is an increase of 15 ppmv of CO2, and a decrease of 33 ppmv of O2. CO2 is heavier than O2, with a molar mass of 44 g/mole compared to 32 for O2. The difference, due to the carbon atom, would represent an increase in atmospheric mass if the only change in concentration were due to combustion. That is because the carbon was not part of the atmosphere before combustion. Of course, combustion is not the only process, so the net change is proportional to ((15 * 44) - (33 * 32))/44, or a reduction of 9 times the molar mass of CO2 for every mole of CO2 added to the atmosphere. That represents a reduction in mass of 19.2 Gigatonnes of mass for every 1 ppmv increase in CO2 concentration. As the mass of the atmosphere is 5.137 Petatonnes (= 10^15), however, that represents less than 4 ten thousandths of one percent of the atmosphere's total mass.
You will have noticed that there is not a 1/1 ratio between expected decrease in O2 and expected increase in CO2 in the above chart. That, as previously mentioned is because of the combustion of hydrogen in hydrocarbons. As previously mentioned (and again by Phillipe), this H2O precipitates out of the atmosphere, and does not add to atmospheric mass. The total H2O in the atmosphere is increasing, but that is because of increased temperatures and is largely controlled by the temperature.
The increase in H2O due to increased temperatures probably exceeds the loss due to combustion of fossil fuels, but only be a small margin as H2O is light (molar mass = 18 g/mole). It does indeed increase the release of latent energy via precipitation which is a factor in changes in extreme weather events. It also reduces the lapse rate (a negative feedback) and increases the greenhouse effect of water vapour (a stronger positive feecback). Whether that adds up to "bang" is for you to decide, but overall it certainly makes the prospects for the future less inviting.
-
dana1981 at 09:21 AM on 18 February 2013A Glimpse at Our Possible Future Climate, Best to Worst Case Scenarios
Icarus @34 - yes, when I say equilibrium sensitivity, I refer to Charney fast-feedback sensitivity. If you look at longer timescales, the picture is bleaker. However, you never know what's going to happen in the future. If we keep climate change in the manageable range this century, maybe we'll eventually be able to come up with a viable technology to extract and sequester CO2 from the atmosphere, in which case the longer timescale feedbacks could be avoided. It's hard enough to project what's going to happen in the next century, so I tend to not try to go much beyond that.
Composer @32 - 2°C above pre-industrial would put us outside the range of climate variation over the past million years or so, at least. That's another good reason to try really hard not to pass that threshold.
-
Icarus at 08:00 AM on 18 February 2013A Glimpse at Our Possible Future Climate, Best to Worst Case Scenarios
Just to follow up on the comments about what should perhaps be called the Charney or fast feedback climate sensitivity (which I believe Dana is using in this excellent article) vs. the full 'Earth system sensitivity', Hansen derives the following from palaeoclimate studies:
Fast feedback climate sensitivity is 0.75 ± 0.125°C/W/m² (3°C per doubling)
Climate sensitivity including slow albedo feedback is 1.5°C/W/m² (6°C per doubling)
Climate sensitivity including slow albedo feedback & non-CO2 GHGs is 2°C/W/m² (8°C per doubling)
Climate sensitivity including all feedbacks between Holocene & ice-free state is ~2.4°C/W/m² (9.5°C per doubling).
Hansen & Sato 2011
The full feedbacks would take hundreds (thousands?) of years to be fully realised but studies find that we're going to see them already making a substantial impact within this century. Just using the fast feedback climate sensitivity is understating the scale of the problem, I think. If the timescales of longer term feedbacks are uncertain, that's all the more reason to make sure they're not forgotten in our eagerness to quantify the scale and timing of global warming. Not a criticism of this article at all, just an observation.
-
Jose_X at 06:04 AM on 18 February 2013There is no such thing as climate change denial
>> The reason there's a consensus of scientists is because there's a consensus of evidence. But for some reason, none of the contrarians wanted to engage with that part (I can't imagine why not).
In case you really didn't imagine why not, I do imagine at least this much:
They generally are not scientists, so they don't read the research papers and frequently wouldn't understand good evidence and conclusions from bad ones. The evidence they "know" are overviews from various websites that use simplified arguments and very frequently cherry pick the data to help build out the narrative being sold.Understandably, led astray to see a limited and misleading portion of the elephant, many get angry and think climate scientists are doofs and/or dishonest in failing to see what "is" there.
-
martin3818 at 05:58 AM on 18 February 2013Analysis of Greenland Ice Cores May Provide Glimpse into Climate's Future
How so you determine the ice's altitude when it melted?
-
idunno at 05:33 AM on 18 February 20132013 SkS Weekly News Roundup #7
I am also struck by the "Most Influential Paper" story; I was already vaguely familiar with the math through McKibben's work.
It does seem to me that there is some hope for help here from a not-so obvious source: Wall Street. It seems to me that there are some pretty sound reasons for questioning the stock valuations of many energy-sector companies, based on this math.
As Chomsky has pointed out, it is illegal in America, for the CEO or other employees of a publically quoted company to do anything other than to try to maximise the stock value of their company, and thus profit to shareholders. This then, is their agenda.
I increasingly suspect that it is quite difficult for investors, getting their information from the WSJ, the FT or Forbes, inter-alia, to actually get full information on the risks asscociated with their investments in the energy sector. It is certainly the case, in my opinion, that the little of the WSJ's journalism that I have seen on the subject of energy and climate does them no credit, and does their readers no favours.
In the political and economic climate that we now inhabit, I am beginning to suspect that ultimately, the markets will decide.
-
william5331 at 05:24 AM on 18 February 2013Analysis of Greenland Ice Cores May Provide Glimpse into Climate's Future
On the other hand, CO2 levels are much higher now than during the Eemian so perhaps we will have melting of the West Antarctic ice sheet and much more of Greeland than during the Eemian.
-
Rob Painting at 05:03 AM on 18 February 2013Ocean acidification: Some Winners, Many Losers
Eric - It shouldn't surprise you to learn that Matt Ridley is wrong. The oceans are well saturated with calcium ions, so they are not a consideration. The concentration of calcium ions dissolved into the oceans only changes on geological timescales (typically millions of years) - hence the shift between aragonite and calcite seas over these long periods.
It seems for many marine life the concentration (activity) of carbonate ions is the key because carbonate ions serve as one of the building blocks of the calcium carbonate (chalk) shell/skeleton. One of the reactions that takes place when extra CO2 is dissolved into the oceans is:

Seawater currently favours the left-hand side of that equation, so adding CO2 to the oceans is actually decreasing the activity of carbonate ions, which in turn makes shell-building ever more energetically expensive. Decrease the carbonate ion concentration sufficiently (calcium carbonate undersaturation) and we end up with seawater that is physically corrosive to marine calcifiers.
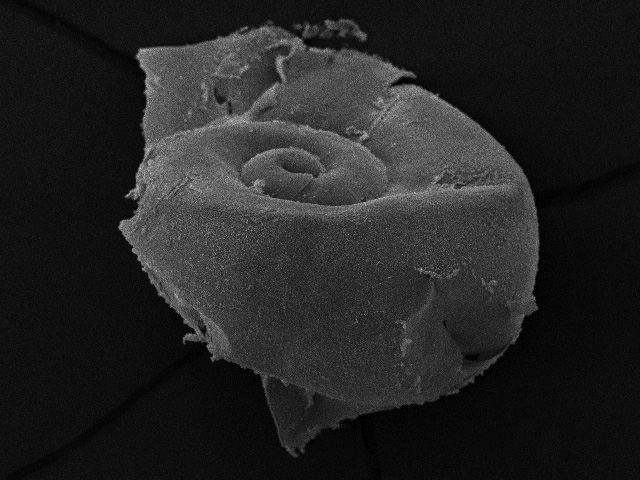
This corrosiveness is already occurring in the waters of the American Pacific Northwest where oyster larvae are now largely unable to survive in the wild, because they dissolve (Barton [2012]). The Antarctic is also seeing highly corrosive surface water too. See the photo below of a pteropod (sea butterfly) which was caught (alive) several years ago:
-
Eric Grimsrud at 02:50 AM on 18 February 2013Ocean acidification: Some Winners, Many Losers
Sorry, I meant to say because" average concentration of Ca++ in the oceans is much HIGHER than the sum of all carbonate, bicarbonate, and carbonic acid concentrations." Thus according to Ridley, increasing the latter three would assist in CaCO3 formation.
(as we also know, of course, increased acidity serves to decrease the conc of carbonate ion relative to bicarbonate and carbonic acid - thus working against CaCO3 (s) formation - an important point not mentioned by Ridley).
Prev 962 963 964 965 966 967 968 969 970 971 972 973 974 975 976 977 Next


