Coumou & Robinson on Extreme Heat: Choose Your Own Adventure
Posted on 21 August 2013 by dana1981
Dim Coumou and Alexander Robinson from the Potsdam Institute for Climate Impact Research have published a paper in Environmental Research Letters (open access, free to download) examining the frequency of extreme heat events in a warming world.
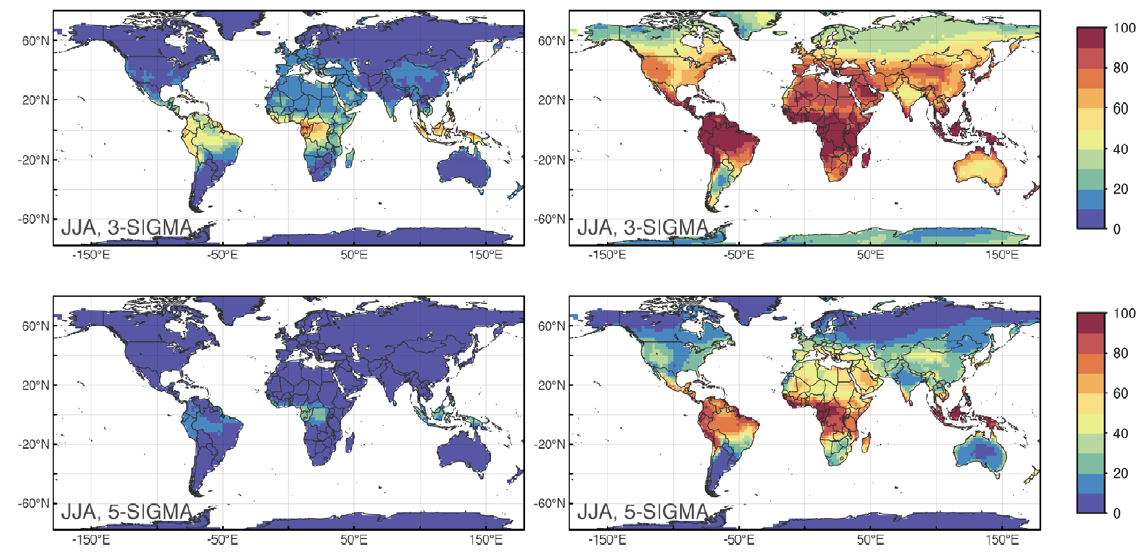
They compared a future in which humans continue to rely heavily on fossil fuels (IPCC scenario RCP8.5) to one in which we transition away from fossil fuels and rapidly reduce greenhouse gas emissions (RCP2.6). In both cases, the global land area experiencing extreme summer heat will quadruple by 2040 due to the global warming that's already locked in from the greenhouse gases we've emitted thus far. However, in the low emissions scenario, extreme heat frequency stabilizes after 2040 (left frames in Figure 1), while it becomes the new norm for most of the world in a high emissions scenario (right frames in Figure 1).
Figure 1: Multi-model mean of the percentage of boreal summer months in the time period 2071–2099 with temperatures beyond 3-sigma (top) and 5-sigma (bottom) under RCP2.6 (left) and RCP8.5 (right).
Rare 3-Sigma and 5-Sigma Events
Coumou & Robinson looked at the frequency of 3-sigma and 5-sigma temperature events. For a normal distribution, 3-sigma represents a 1-in-370 event, and 5-sigma is a 1-in-1.7 million event. In short, 3-sigma events are rare, and 5-sigma events are extremely rare. In this paper, sigma (the standard deviation) is calculated based on temperatures over the past 60 years (1951–2010).
As shown in the video below from NASA GISS, summer temperatures have already begun to shift significantly towards more frequent hot extremes over the past 50 years. What used to be a rare 3-sigma event is now more commonplace.
Source: NASA/Goddard Space Flight Center GISS and Scientific Visualization Studio
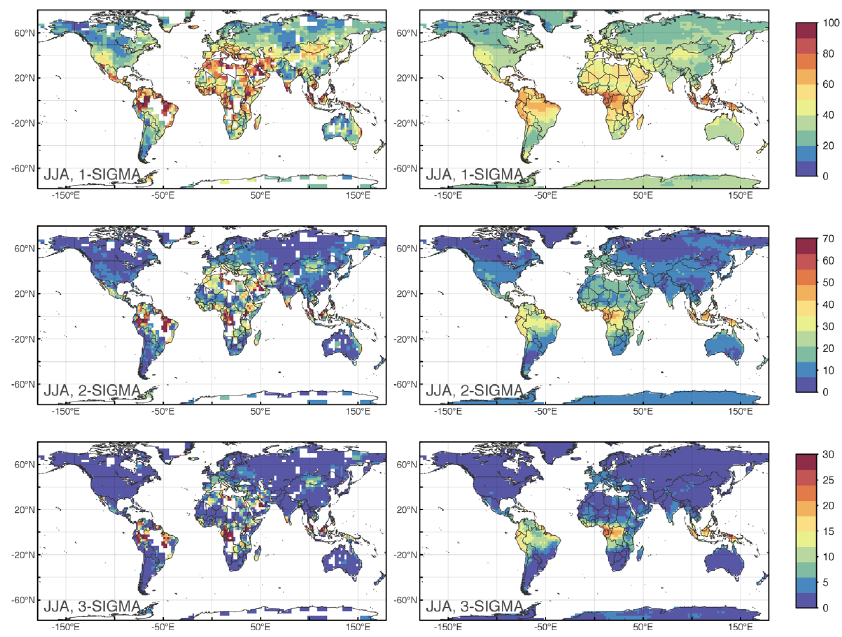
Coumou & Robinson find the same result in their paper, with 1-, 2- and 3-sigma heat events having become more commonplace in both models (Figure 2, right frames) and observations (Figure 2, left frames).
Figure 2: Percentage of boreal summer months in the time period 2000–2012 with temperatures beyond 1-, 2- and 3-sigma (top, middle and bottom, respectively) for observations (left) and the CMIP5 multi-model mean (right).
Coumou & Robinson point out that these 3-sigma events have tended to have very damaging consequences:
"most of the 3-sigma extremes that have occurred in recent years resulted in serious impacts to society, causing many heat-related deaths, massive forest fires or harvest losses"
Coumou pointed to the Moscow heat wave of 2010 as a good example of a damaging 3-sigma extreme heat event.
"In the Moscow region the average temperature for the whole of July was around 7°C [13°F] warmer than normal – it was around 25°C [77°F]. In some parts, temperatures above 40°C [104°F] were measured"
As Figure 1 above shows, in the high emissions scenario (right frames), these 3-sigma events will occur throughout the summer for most of the global land area by the late 21st century, especially in the tropics. For example, most of Africa, Central America, and northern South America will experience these 3-sigma extreme heat events for close to 100% of the summer. They will become the norm. Even extreme 5-sigma heat events, which are currently exceptionally rare, will become relatively commonplace, especially near the equator.
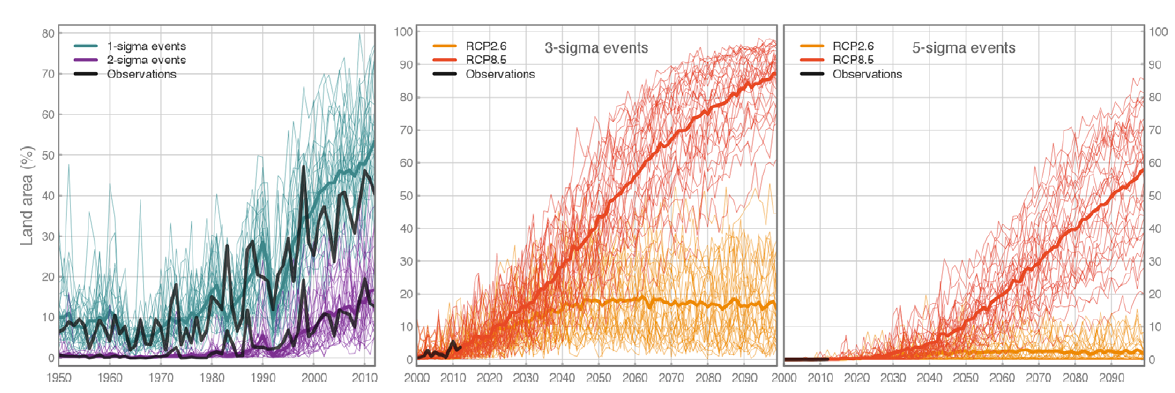
On the other hand, in the low emissions scenario (left frames in Figure 1), 3-sigma events will still be relatively rare by the late 21st century, especially outside of the tropics. Extreme 5-sigma events will become somewhat more commonplace near the equator, but will remain fairly rare occurrences. The difference between the two emissions scenarios is also illustrated in Figure 3.
Figure 3: Percentage of global land area during boreal summers with monthly temperatures beyond different sigma-thresholds for historic (left) and 21st century (middle and right). The CMIP5 multi-model mean (thick colored lines) accurately reproduces the observed increase in 1-, 2- and 3-sigma extremes in the GISS surface temperature data (solid black lines). Future projections are given for 3-sigma (middle) and 5-sigma (right) for scenarios RCP2.6 and RCP8.5.
Choose Your Own Adventure
In short, damaging summer extreme heat events are going to become more commonplace, but just how much more commonplace is up to us. While it's difficult to determine how climate change will impact some types of extreme weather (tornadoes, for example), the link between global warming and heat waves is quite clear. Increasing global temperatures will make (and already is making) extreme heat events more commonplace.
The longer we continue to rely on fossil fuels and the higher our greenhouse gas emissions, the more extreme heat we'll lock in. If we manage to take serious action to reduce our greenhouse gas emissions, we can limit global warming to a level where extreme heat events will become more commonplace, but to a level we can manage to adapt to.
If we continue our reliance on fossil fuels and associated greenhouse gas emissions growth, we'll commit ourselves to a world where today's most extreme heat waves become the norm, and future extreme heat makes today's heat waves look downright balmy.
It's in our hands which future scenario becomes reality. Choose your own adventure.


 Arguments


One interesting point is the comparison between model and observations for 1 sigma events. Clearly, from figure 3, obervations show lower percentages of the land area with 1 sigma events relative to the models from 2000 to 2012, but quite the opposite impression is made by figure 2, where it appears that observations overshoot the model projections. I wonder if the discrepancy is due the the large extent of areas not observed in the African and South American tropics, areas which if they match their neighbouring regions, would have had a very high percentage of 1 sigma events. Did Coumou and Robinson normalize figure three to compensate for this unobserved land area? That is, does the percentage of land area shown represent the percentage of total land area? Or the percentage of actually observed land area?
Thanks for this summary of a fascinating study. It's worth pointing out the reason why there is a greater increase in 3 and 5 sigma events near the equator: because the natural temperature variation in those regions is considerably smaller than near the poles, so even a small rise in temperatures rapidly starts to become extreme on the distribution chart. Now, since these are the areas where there is already a lot of heat, then extra heat in these places can be particularly damaging to human and natural systems. Nonetheless, this statistical quirk (of smaller natural temperature variation near the equator) can serve to hide just how extreme the Arctic warming is projected to be. Since the Arctic naturally experiences much more year-to-year temperature variability, then even the effects of Arctic amplification (where more of the globe's extra heat ends up in the Arctic than anywhere else) don't show up clearly in Figure 2.
Thanks Byron. I was wondering why the change appeared most clearly near the equator when the poles have seen the most rapid warming. Your comments about regional variation provide a logical explanation.
The way this study looks at the data should also correlate well with what the average person thinks of as 'extreme heat'. That is, there is often a disconnect when you tell people that the Arctic has undergone 'massive warming'... because even after that warming the temperatures there are still 'cold' by the standards of most people (who live in warmer climes). On the other hand, areas which will experience 'extreme heat' as identified by this study should correlate well to what most people think of as extreme.
Tom@1,
I would not be so sure that "observations overshoot the model projections" for the event shown on figure 2. You cannot say that unless you have and compare the actual data. Eyeballing may be very subjective. For example, having downloaded the high quality picture, my eyeballs concentrated on large swathes of dark blue coloured 1-SIGMA observations in NAmerica, Siberuia and WAus, whereas the models paint it light blue or green, thus models overshoot the observations there.
Your question:
can only be answered the the authors. But I think it should the the latter (of actually observed land area), if they did not interpolated the grids with no data; otherwise it would not make sense in the context of comparing the observations with the model predictions.