


 Arguments


Evaluating biases in Sea Surface Temperature records using coastal weather stations
Posted on 8 January 2018 by Kevin C
Science is hard. Some easy problems you can solve by hard work, if you are in the right place at the right time and have the right skills. Hard problems take the combined effort of multiple groups looking at the problem, publishing results and finding fault with eachother's work, until hopefully no-one can find any more problems. When problems are hard, you may have to publish something that even you don't think is right, but that might advance the discussion.
The calculation of an unbiased sea surface temperature record is a hard problem. Historical sea surface temperature observations come from a variety of sources, with early records being measured using wooden, canvas or rubber buckets (figure 1), later readings being taken from engine room intakes or hull sensors, and the most recent data coming from drifting buoys and from satellites.
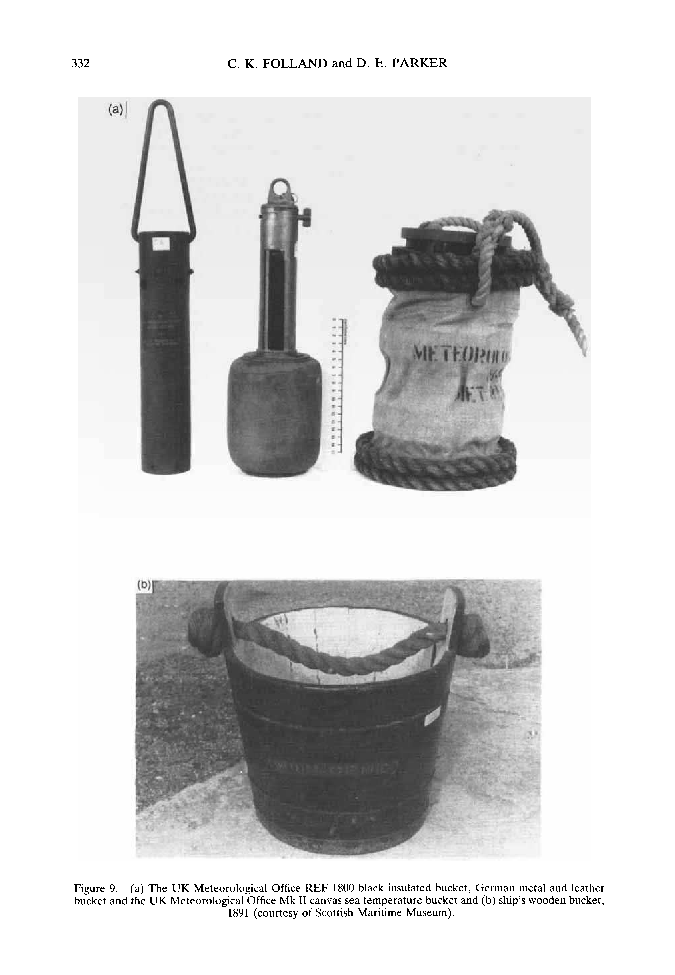
Figure 1: Three types of buckets used in early sea surface temperature observations. From Folland (1995).
These different measurement methods give slightly different readings, with the transition from bucket to engine room observations during the second world war being particularly large: this represents the single largest correction to the historical temperature record, and reduces the estimated warming since the mid 19th century by 0.2-0.3 C compared to the uncorrected data (figure 2).
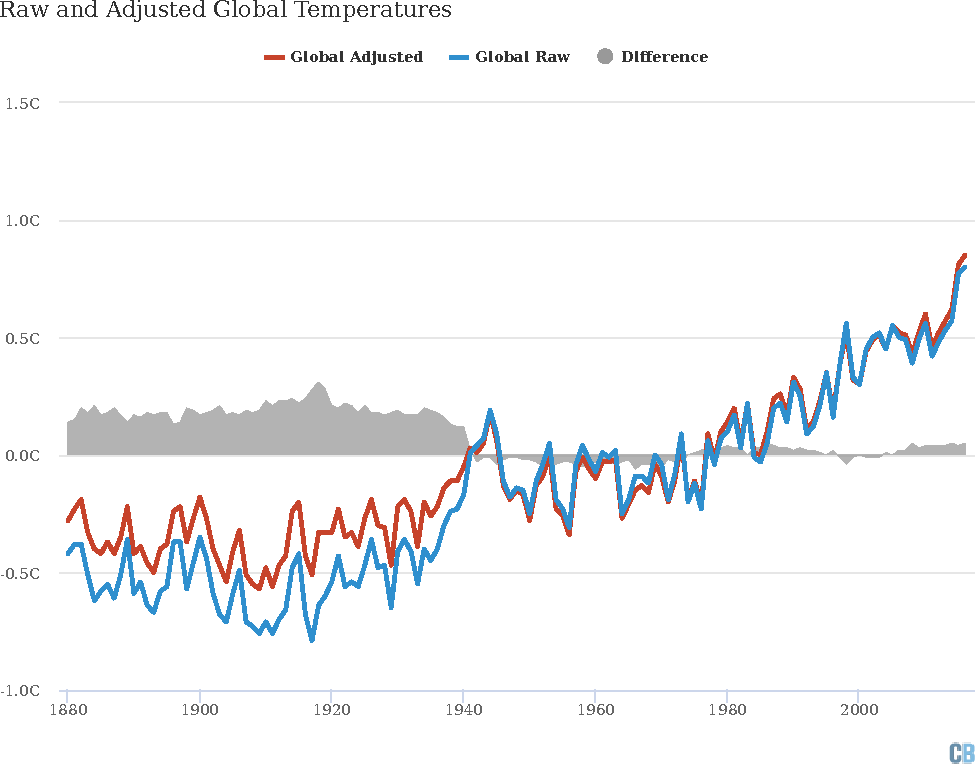
Figure 2: Difference between the historical temperature record using only raw observations, and using observations corrected for the effects of different measurement methods. The corrected data show less warming on a centenial timescale. From Zeke Hausfather.
Different approaches have been used to address the problem of combining different kinds of sea surface temperature observations. Records from the UK Met Office and from Japan use information about how the temperature was measured to correct for the type of instrument. The record from the US agency NOAA takes a different approach, using air temperature observations from ships to correct the water temperature readings. If both methods gave the same result, this would increase our confidence in the resulting record. But unfortunately the two approaches give rather different answers (figure 3).
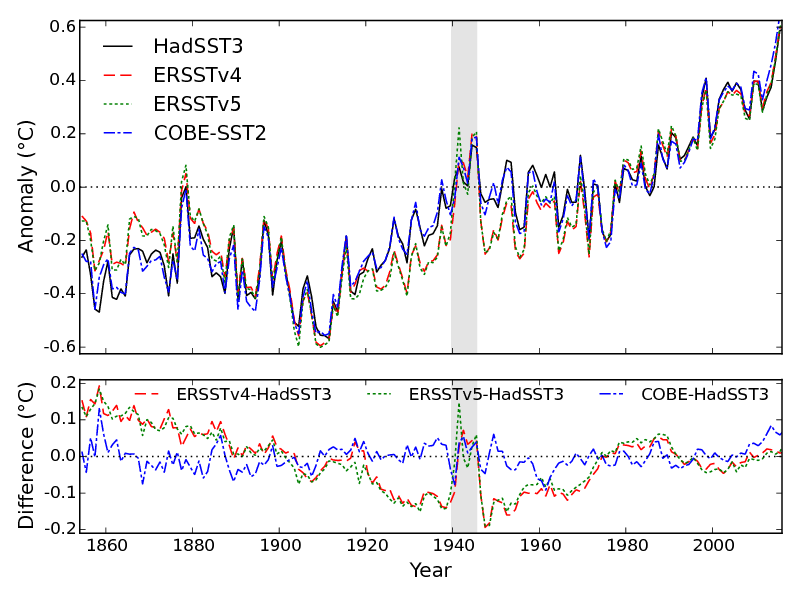
Figure 3: Existing sea surface temperature records from the UK Met Office (HadSST3), from the US agency NOAA (ERSST), and from Japan (COBE-SST2). The lower panel shows the difference between the other records and the UK record.
We wanted to determine which approach was right, so we looked for another source of data which could be used to work out how to combine different types of sea surface temperature observations. Coastal weather stations provide air temperature observations covering the whole of the sea surface temperature record, and can be compared against sea surface temperature observations from ships passing close to the coast (Jones 1991). We assembled a dataset of about 2000 coastal weather stations, of which about 400 were located on small islands or peninsulas (figure 4).
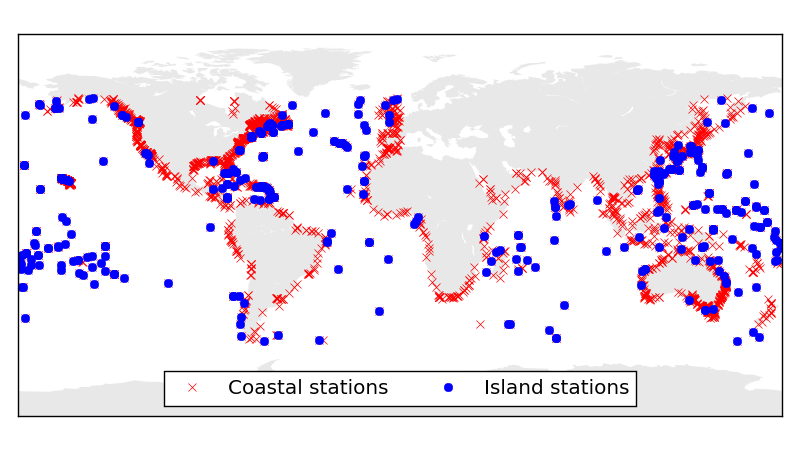
Figure 4: Coastal weather stations used to detect the effect of different observation types in the sea surface temperature data.
Coastal air temperatures warm faster than sea surface temperatures, so first we had to scale the weather stations to preserve the sea surface temperature trend for recent decades. Then we used the coastal weather stations to determine the correction required to combine the sea surface temperature observations for each month in the record. This allowed us to create a new sea surface temperature record (figure 5).
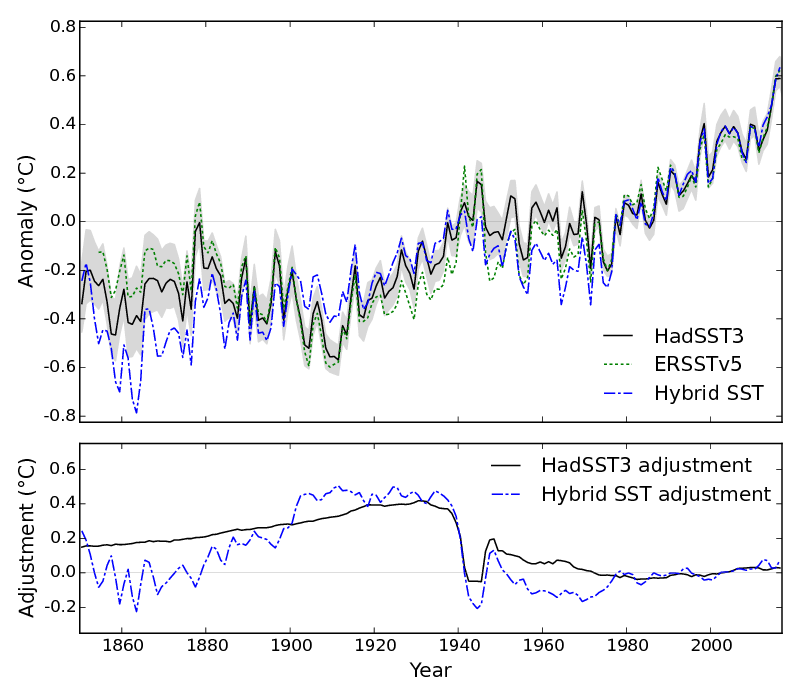
Figure 5: Our new sea surface temperature record (the Hybrid SST) is compared to existing records from the UK Met Office (HadSST3), and the US agency NOAA (ERSST). For a comparison of the bucket correction to Jones (1991) see this figure.
Unfortunately the resulting record does not agree with either the UK or US sea surface temperature records. It does rule out an unexplained and contentious warm spike in the US record during World War 2. It also tends to reject an unexplained cool feature around 1910 which is present in all existing records. When our new record is compared with the average of many climate model simulations, the differences between the models and the observations are rather different than for existing records, and tend to be slightly reduced (figure 6).
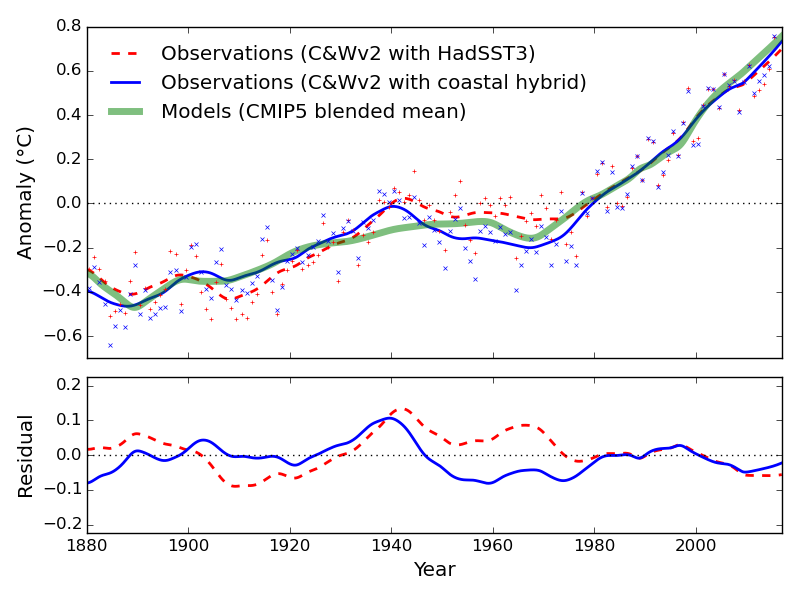
Figure 6: Comparison of global temperature records based on either the UK Met Office sea surface temperature record (HadSST3), or our coastal hybrid record. The smoothed records are compared to the average of climate model simulations from the CMIP5 project. The lower panel shows the differences between each set of observations and the models
If the new record were correct, then it would suggest that climate models have been doing a better job than we thought, and there is little evidence of any difference between the models and observations in the total amount of warming. However we do not necessarily trust our new record, because of the assumptions we had to make in constructing it. The most important result of our work may therefore be to identify places where extra attention should be given to addressing problems in the existing sea surface temperature records. A secondary result is that caution is required when trying to draw conclusions about any differences between the models and the observations, whether it be to identify internal cycles of the climate system or problems in the models, because the differences that we do see are mostly within the range of uncertainty of the observations.
Some other relevant papers on this issue include:


The new research findings described in the following article further complicates the measurement of sea level rise...
So much extra water is being added to the world’s oceans from melting glaciers that the ocean floor is sinking underneath the increasing weight. This ocean floor deformation also means we have miscalculated just how much ocean levels are rising, and the problem could be far worse than previously believed.
Over the past 20 years, ocean basins have sunk an average of 0.004 inches per year. This means that the ocean is 0.08 inches deeper than it was two decades ago. While this small fragment of an inch may not seem much, oceans cover 70 percent of our planet, making the problem bigger than it seems at first glance.
In a study published online in Geophysical Research Levels, researchers explain how they used a mathematical equation known as the elastic sea level equation to more accurately measure the ocean floor. This allowed them to see how much the bottom of the ocean floor has changed from 1993 to 2014. While they are not the first scientists to look at the ocean floor, this is the first time that researchers have taken into account how additional water from melted ice may have further stretched that floor, LiveScience reported.
The Ocean Floor Is Sinking Under The Water Weight From Melting Glaciers, And It’s As Bad As It Sounds by Dana Dovey, Newsweek, Jan 8, 2018