


 Arguments


Factcheck: How global warming has increased US wildfires
Posted on 9 August 2018 by Zeke Hausfather
This is a re-post from Carbon Brief
In the midst of record or near-record heatwaves across the northern hemisphere this summer, deadly wildfires have swept through many regions, such as the western US, Europe and Siberia. This has focused a great deal of public attention on the role that climate change plays in wildfires.
Recently, some commentators have tried to dismiss recent increases in the areas burnt by fires in the US, claiming that fires were much worse in the early part of the century. To do this, they are ignoring clear guidance by scientists that the data should not be used to make comparisons with earlier periods.
The US National Interagency Fire Center (NIFC), which maintains the database in question, tells Carbon Brief that people should not “put any stock” in numbers prior to 1960 and that comparing the modern fire area to earlier estimates is “not accurate or appropriate”.
Here, Carbon Brief takes a look at the links between climate change and wildfires, both in the US and across the globe. As with any environmental issue, there are many different contributing factors, but it is clear that in the western US climate change has made – and will continue to make – fires larger and more destructive.
As one scientist tells Carbon Brief: “There is no question whatsoever that climate plays a role in the increase in fires.”
More area burned
Many areas of the western US are currently being ravaged by record-setting wildfires for the second year in a row. The Mendocino Complex fire in California is now the largest on record in the state, with firefighters expect the fires to keep burning for at least the rest of the month.
In California, 14 of the 20 largest wildfires on record have occurred over the past 15 years. At the same time, the western US has experienced some of its warmest temperatures on record, with 10 of the past 15 years among the 15 warmest years on record, based on temperature records from the US National Oceanic and Atmospheric Administration (NOAA).
According to data from the NIFC, there has been a clear trend in increased area burned by wildfires in the US since the 1980s, when reliable US-wide estimates based on fire situation reports from federal and state agencies became available.
Today, wildfires are burning more than twice the area than in the 1980s and 1990s. These figures include all wildland fires in both forested and non-forested areas. Most of the area burned today is in the western US, where dryer conditions tend to allow for large, quickly-spreading wildfires.
The black bars in the top panel of the figure below show the annual area burned (in acres) by wildfires since 1983 when reliable data became available. The blue line shows the linear trend in fires over the same period. The bottom panel shows all of the data in their database, including pre-1983 values where the data is of poorer quality.
The NIFC explicitly warns users on its website: “Prior to 1983, sources of these figures are not known, or cannot be confirmed, and were not derived from the current situation reporting process. As a result, the figures prior to 1983 should not be compared to later data.”
Annual wildland acres burned since reliable data was available in 1983 (top panel) and area burned since 1923 (bottom panel) showing periods when quality of data was poor and incomparable. Blue line in top panel shows linear trend. Data from the US National Interagency Fire Center; Chart by Carbon Brief using Highcharts.
Those sceptical about the role of climate change in the recent increase in fires have pointed to the full dataset, trying to argue that the fire area has decreased by around 80% over the past century.
This is not an accurate comparison, according to Randy Eardley, a spokesman at the NIFC. As he tells Carbon Brief:
“I wouldn’t put any stock in those numbers. To try and compare any of the more modern data to that earlier data is not accurate or appropriate, because we didn’t have a good way to measure [earlier data]. Back then we didn’t have a reliable reporting system; for all I know those came from a variety of different sources that often double-counted figures. When you look at some of those years that add up to 60 or 70 million acres burned a lot of those acres have to be double counted two or three times. We didn’t have a system to estimate area burned until 1960, but it was really refined in 1983.”
If 50m acres had actually burned in the early 20th century, it would amount to an area of land equal to the entire state of Nebraska going up in flames every year.
Eardley suggests that earlier records were inflated by including areas where fires were purposefully set to clear forests for agriculture, or where rangelands were torched to get rid of sagebrush to improve grazing conditions. Other federal reports suggest that most of the area burned between 1930 and 1950 was in southeastern US and were primarily intentionally set fires for clearing land.
While the early 20th century data is not reliable and likely double or even triple-counted actual fires, Eardley says that it is possible that fire extents were higher back then for a simple reason: there was no large-scale firefighting organisation in the first half of the 20th century. Therefore, fires would burn through larger areas before being extinguished or burning themselves out, particularly when they were not close to towns or settlements.
Today, the US has larger and more organised firefighting operations in place. Therefore, recent increases are not due to any change in firefighting approach. If anything, many more resources have been devoted to fighting fires in the past few decades than in any prior period.
US wildfires and climate change
The recent period of large wildfires in forested areas of the western US has coincided with near-record warm temperatures. The figure below shows spring and summer temperatures (May through to August) – the period that overlaps with fire season – for the western half of the US. Annual values are shown by black dots, while a smoothed average of temperature over time is shown in red.
Temperature anomalies between March and August relative to a 1961-1990 baseline period for the US west of 102 degrees longitude. Spring/summer temperatures are shown as they play the largest role in determining fire season length and severity, according to Westerling et al 2006. Calculated using data from NOAA; Chart by Carbon Brief using Highcharts.
While the dust-bowl era year of 1934 still holds the record for the warmest spring/summer in the western US, it was something of an anomaly compared to other years at the time. In contrast, modern temperatures are considerably higher than temperatures typical of the 1930s, as shown by the red smoothed average line.
Temperatures in the western US between March and July in 2018 have been at near-record levels, similar to the spring/summer temperatures for the past three years.
There are many different factors that contribute to forest fires in a given year, including how many fires are ignited (arson, lightning strikes, downed power lines, malfunctioning equipment, etc), where they occur, how high temperatures are, how low precipitation has been and wind conditions where fires occur. For any given fire, local factors will play a large role, but when aggregated across the whole western US the role of climate conditions stands out sharply.
In a 2006 paper published in Science, Prof Anthony Westerling at the University of California, Merced and colleagues examined the relationship between climate conditions and large forest fire frequency. They found that, while land-use history and “fuel-loading” – the amount of accumulated burnable vegetation – were important factors for specific forest areas, “the broad-scale increase in wildfire frequency across the western US has been driven primarily by sensitivity of fire regimes to recent changes in climate over a relatively large area”.
Westerling identified a clear link between changes in temperature, length of fire season and areas burned over time.
Carbon Brief has compared spring and summer temperatures in the western US to forest fire area, similar to an analysis in Westerling’s paper, but updated through to present. As the figure below shows, there is a strong relationship between temperature (black line) and fire extent (red bars), with warmer years generally having higher fire extent than relatively cooler ones since the early 1980s.
Red bars show western US forest area burned (in thousand hectares) using data provided to Carbon Brief by Prof John Abatzoglou, updated from the data used in Abatzoglou and Williams 2016. Black line shows March-August temperature anomalies relative to a 1961-1990 baseline period for the US west of 102 degrees longitude using data from NOAA; Chart by Carbon Brief using Highcharts.
In the figure above, temperature changes explain about 40% of the variability in area burned, based on an “ordinary least squares” regression of temperature on forest fire area. However, temperature is not the only factor at work; some years with higher temperatures, such as 2004, can still have relatively low areas burned. For example, a warm year with wetter summer conditions, or where fires that start are more quickly extinguished by firefighters, could still have low areas burned.
As Westerling explains to Carbon Brief:
"I would say there is no question whatsoever that climate plays a role in the increase in fires. I think it is shown without any room for reasonable doubt that climate is warming and becoming more variable because of human activity. Because precipitation is more variable in western US and temperatures are increasing, you know that wildfires will be amped up because of climate change."
A recent 2016 paper in PNAS by Prof John Abatzogloua at the University of Idaho and Prof A Park Williams at Columbia University found an even stronger relationship between forest fire area and fuel aridity – a combination of temperature and precipitation – in the western US.
The figure below, updated from the one featured in the Abatzogloua paper, shows a clear connection between the two factors, as well as a dramatic increase in fuel aridity between the 1984-1999 period and the 2000-2017 period. Here, each dot represents the area burned and the fuel aridity in a given year, while the black line shows the strong relationship between the two. Years between 1984-1999 are shown in blue, while the more recent 2000-2017 period is shown in red, highlighting that forest fire area and fuel aridity have increased in tandem over the last two decades.
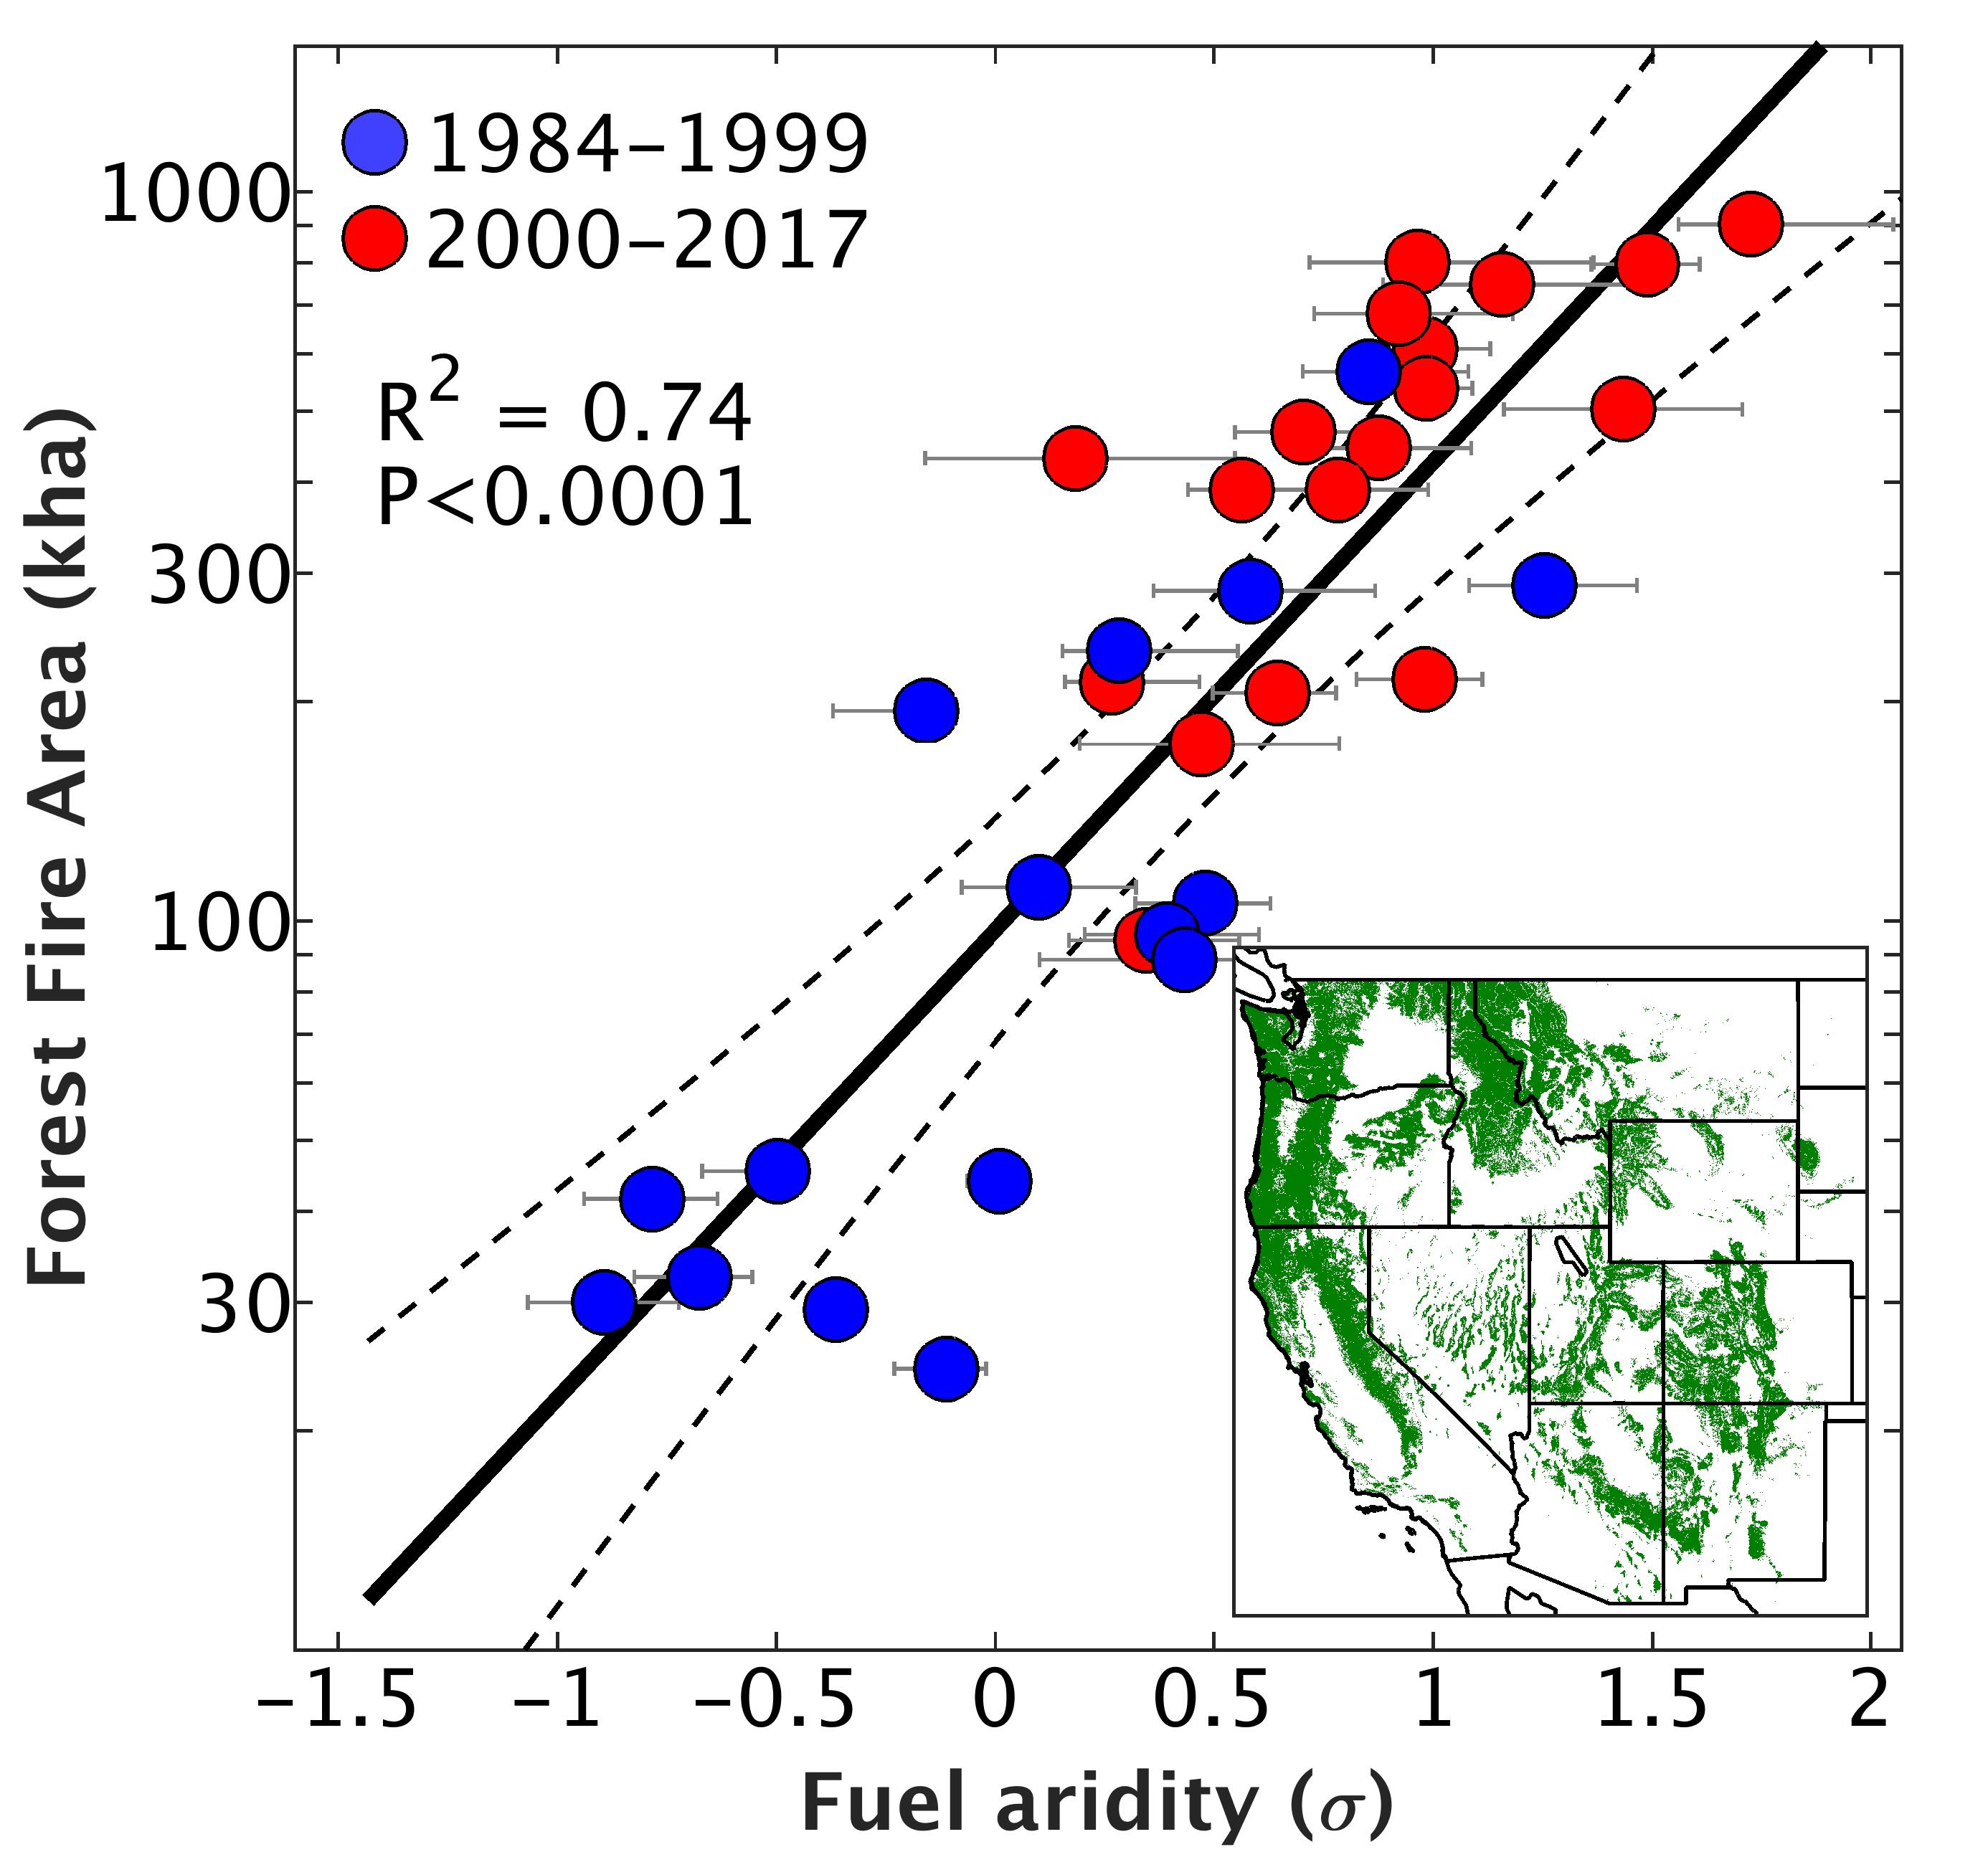
Western US forest fire area on a logarithmic scale compared to standardised fuel aridity, with datapoints during the 1984-1999 (blue dots) and 2000-2017 (red dots) periods highlighted. Map insert shows the western US forest areas. Updated version of figure 1 in Abatzoglou and Williams 2016 provided to Carbon Brief by John Abatzogloua.
Abatzogloua tells Carbon Brief: “We see a strong relationship between year-to-year variations in how dry fuels are and how much burns in western forests.”
He explains that about 75% of year-to-year variations in burned area can be explained by a single climate variable – fuel aridity.
In their paper, Abatzogloua and Williams also looked at climate models to determine how much of the change in fuel aridity over this period in the western US could be attributed to climate change versus natural variability. They found that “human-caused climate change caused over half of the documented increases in fuel aridity since the 1970s and doubled the cumulative forest fire area since 1984”.
This means that while climate change played a large role in the increase in forest fires, natural variability may also have a hand in the increases we see. Abatzogloua suggests that since the 1980s there has been “an alignment” of natural variability tending toward less rain and snow with human-caused warming. While climate models agree that temperatures have increased in the western US due to human activity, the human role in changes in rain and snow over that period is less clear-cut and varies greatly between models.
However, Abatzogloua points out that, in the future, models suggest a decline in relative humidity during the summertime, which, along with temperature, “are the primary ingredients in drying out forests and forest fuels”.
Yet high temperatures and low rain and snowfall are not the only driver of intense forest fires. The increased fuel-loading since the second half of the 20th century has also played a role, as the success in putting out wildfires has helped build up more and more burnable vegetation.
Westerling argues that while this is an important factor, it cannot explain the increases seen in recent decades. He says that, since the 1970s and 1980s, the technology and types of resources used for fire suppression have not changed that much. Additionally, a lot of the increase in fuel from fire suppression would have already showed up in the data by that point. The marginal increase in fuel-load since the 1980s would not have been nearly large enough to double the area of fires.
Abatzogloua also thinks fuel-loading does not diminish the role of climate in recent years, pointing out that changes related to fire suppression and fuel-loading would have “distinct geographic patterns and we’d see more fires in those areas”. However, he continues:
“What we are seeing is broad-scale fire activity even in forests that historical only burned every 200 years. This gives us confidence what we’ve seen is not just a function of policy, and it fits very well with being climate forced or climate driven. The broad geographic scales of these fires “points to something also operating at broad geographic scales: climate change.”
He points out that agencies in the US have been quite successful at suppressing fires when conditions are moderate, but not necessarily when conditions are warmer and dryer. Fire suppression has in many ways “primed the system to have heightened vulnerability” to climate change.
Fuel-loading and the damages resulting from wildfires have also been magnified by an increase in the number of people living in remote, forested areas in recent decades. Larger populations increase the political pressure to limit controlled burns and other preventative measures to reduce fuel load.
At the same time, when fires do occur, there are now more scattered, remote homes that are difficult to effectively protect. Scientists point out that there are many actions that communities can take to mitigate fire risk, including improved building and landscaping practices to reduce fire risk and create defensible spaces, as well as developing emergency evacuation plans.
Global picture
The climate-change signal in forest-fire frequency is clear in recent years in the western US. However, in other parts of the world, other confounding factors are at play.
Global changes in wildfire area are dominated by reductions over the past century in the frequency of human-set fires for agricultural conversion, particularly in Africa and southeast Asia.
A 2014 study in the Journal of Geophysical Research by Dr Jia Yang at Auburn University and colleagues suggests that in the tropics climate change may have also reduced the area burned over the past 50 years, due, in part, to wetter conditions. However, they find that climate change has likely increased fire risk in the high latitudes and mid-latitudes over recent decades.
The figure below, taken from their 2014 paper, shows the role that changes in human activity – mainly burning land to convert forest areas to agriculture – as well as climate change and CO2 fertilisation and increased nitrogen deposition – increased atmospheric CO2 and nitrogen pollution that both help fertilize plants and increase growth of flammable vegetation – have played in the area burned by wildfires in different regions of the world. The bars show the factors that by themselves would increase and decrease wildfire area in each region, while the solid line shows the combined effect of all factors.

Contribution of different factors in changes since 1900 in forest-fire area globally and for different regions. Effects of climate change (including changes in temperatures and precipitation) are shown by the vertical stripes. Human land management activity is shown by the diagonal stripes, while the effect of CO2 fertilization and nitrogen deposition is shown by the dots. Source: Yang et al (2014).
The authors point out that in the future climate change could play a much larger role, particularly outside of the tropics. They suggest that “if the warming trend continues in the 21st century, climate impact may outweigh [other] anthropogenic influence and become the primary factor in the extratropics”.
In other words, climate change will have a bigger effect in areas outside the tropics than changes in the conversion of forestlands to agriculture and other human influences in wildfire area.
A 2015 paper in Nature Communications by Dr W Matt Jolly at the US Forest Serviceand colleagues examined how climate changes have influenced fire-season length over the past 30 years. They found that fire season has lengthened across about 25% of the Earth’s surface and that there has been a doubling of global burnable area that is now affected by long fire seasons.
A 2016 study in Biogeosciences by Dr Wolfgang Knorr and colleagues looked at how the emissions from wildfires – a measure closely related to area burned – might change by 2100 under different future warming scenarios. They found that climate change by itself would increase emissions from wildfires in both low and high-warming scenarios, but that in low warming scenarios this would be offset by reduced conversion of forestland, as global population is assumed to decrease after 2050.
Due to the fact that global wildfire estimates are dominated by human land use rather than unintentional fires – unlike in the western US – Westerling tells Carbon Brief that it is easy to be misled by a global statistical analyses that show decreasing fires.
Careful work must be undertaken, he says, to disentangle the impact of climate change from other human influences.


Interview with Michael Brune, the director of the Sierra Club, and Michael Mann, distinguished professor of atmospheric science at Penn State University and author of “The Madhouse Effect: How Climate Change Denial is Threatening our Planet, Destroying Our Politics, and Driving us Crazy.”
=> Experts: If We Don’t Stop Climate Change, CA Fires “Will Seem Mild In Comparison to What’s Coming” - YouTube