


 Arguments


France’s record-breaking heatwave made ‘at least five times’ more likely by climate change
Posted on 8 July 2019 by Guest Author
This is a re-post from Carbon Brief by Daisy Dunne
The record-breaking heatwave that struck France last week was made at “least five times more likely” by climate change, according to a new quick-fire assessment.
A preliminary analysis by scientists at the World Weather Attribution network finds that the average temperature of such a heatwave in France is now “4C higher” than it would have been a century ago, the authors say.
Using climate models, the authors conclude that such an increase in heatwave intensity was made at least five times more likely by human-caused climate change.
However, they note that there are “large uncertainties” in their analysis and the true influence of climate change could be higher.
The research is the latest in “attribution science”, a field that aims to quantify the “fingerprint” of climate change on extreme-weather events, such as heatwaves, floods and droughts.
Record heat
Europe has been struck by another extreme heatwave. Hot weather being drawn up from the Sahara – in combination with clear skies – has seen temperatures soar in France, Germany and Spain over recent days.
Last Friday, France saw its highest temperature since records began when Gallargues-le-Montueux, a small town situated between Montpellier and Avignon in southern France, reached 45.9C – more than 1.5C above the previous record set in 2003.
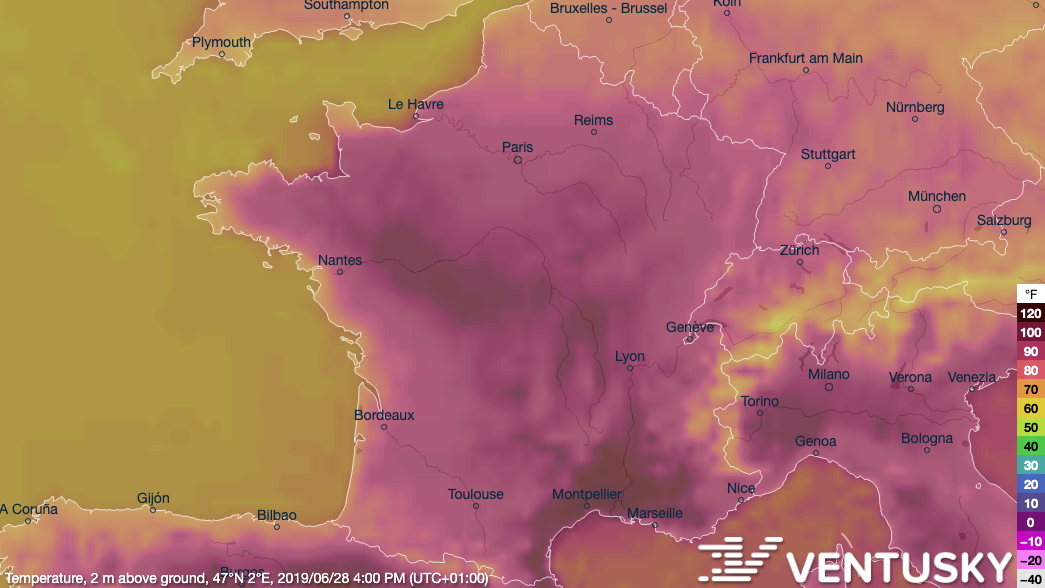
Data visualisation of air temperatures over France on Friday 28 June at 16:00 BST. Created with Ventusky.
Towns and cities in Switzerland, Germany, the Czech Republic and Spain also saw record high temperatures. Austria had its warmest June on record – “in a large part due to the heatwave”, the researchers say.
The heat fanned widespread wildfires in the Spanish region of Catalonia and caused 4,000 schools across France to close early. Temperatures in the UK peaked at 35C in London on Saturday, while the Glastonbury Festival saw highs of 28C. The heatwave brought to a close the hottest June on record for Europe – with an average temperature “more than 2C above normal”, according to the Copernicus Climate Change Service. It was also the hottest June for the world as a whole, with the global-average temperature clocking in at 0.1C higher than the previous record in 2016.
For the analysis, the researchers used temperature data taken from across mainland France, as well as from weather stations in Toulouse (where many of the authors had gathered for a conference).
The authors chose to analyse the heatwave for Toulouse in addition to France as a whole to get a picture of how temperatures are changing in cities in particular, explains Dr Friederike Otto, an author of the new analysis and acting director of the Environmental Change Institute at the University of Oxford. She tells Carbon Brief:
“The main reason for looking at a city in France and across France itself is to make the point that how impacted you are by a heatwave depends on exactly where you are.”
The team focused their analysis on the hottest three-day period in June of this year, which they took to be 26-28 June. For the first part of their analysis, they used long-term temperature data to work out how often a heatwave on the same scale of that seen in recent days is likely to occur in today’s climate.
They find that such a heatwave has around a one-in-30 chance of occuring in the current climate, the authors explain:
“Currently, such an event is estimated to occur with a return period of 30 years, but similarly frequent heatwaves would have likely been about 4C cooler a century ago. In other words, a heatwave as intense [as seen in France] is occurring at least 10 times more frequently today than a century ago.”
Warming’s fingerprint
To explore the influence of climate change on France’s heatwave, the authors carried out an “attribution analysis” using a selection of climate models.
For each model, the authors produced two sets of simulations to compare the chances of a heatwave on the same scale as that seen in France occurring in today’s world to a world without human-caused climate change.
The “real world” simulations included many of the factors that can influence the climate, including human-driven greenhouse gases, volcanic eruptions and solar variability. The simulations without human-caused climate change included all of these factors except for human-driven greenhouse gases.
The researchers then studied the simulations to see how often heatwaves on the same scale to that seen in France occur in both the “real world” and the world without global warming.
From the simulations, the authors found that climate change could have caused heatwaves on the same scale of that seen in France to become “at least five times more likely” to occur.
However, each model used in the analysis comes with its own limitations and uncertainties – making it difficult to draw any firm conclusions, the authors say:
“We note that while we are very confident about the positive trend and the fact that the probability [of the heatwave] has increased by at least a factor of five, it is much more difficult to assign a specific number on the extent of the increase – given the systematic differences between the representation of extreme heatwaves in the climate models and in the observations.”
Another limitation is that the temperature data record used in the analysis is “relatively short” – running from 1947 to 2019 – meaning that it is more likely to contain uncertainties, the authors say.
Despite the limitations, the results show “the clear impact of human activities in making the level of extreme temperatures seen this June substantially more likely” says Prof Peter Stott, a leading attribution scientist from the Met Office Hadley Centre, who was also involved in the analysis. He tells Carbon Brief:
“This rapid study illustrates the feasibility of producing rapid assessments, especially when the expertise and necessary information – both from climate models and from the [temperature] observations – can be gathered together quickly.”
However, this kind of rapid analysis currently relies on the “extreme dedication” of a small team of scientists, he adds:
“In future, a fully functional ‘operational attribution’ capability will need the training and development of expert personnel whose primary task would be delivery of an operational attribution service.”
The findings are yet to be published in a peer-reviewed journal. However, the methods used in the analysis have been published in previous attribution studies.


Maybe so. Maybe not. But certainly not via the method they used. Let's summarize what they did.
B is assumed to affect A in some proportion. Build a model around that. When A is seen in real time, go back to the model to see if B was the cause ... and pretent that the original proportion was a fact, not an assumption.
Really? This is Attribution Science? Can we just call it what it is so as not to discredit science? "Stott, a leading attribution scientist" should be changed to "Scott, a leading attributionist". By his method ...
"Worldwide non-commercial space launches was 5x more likely because of the number of Sociology doctorates awarded (US)". [see https://tylervigen.com/view_correlation?id=805]
Wffrantz, sometimes assumptions are made but they are not the core of the modelling, and they are not guesses, they are based on a lot of evaluation. You would need to provide a copy and paste from research where you think a specific assumption is not justified. Otherwise if you can't do this you are spreading cynical propoganda, and I think your comment should be deleted.
Your example of a spurious correlation has no relevance to climate models, because climate modelling insn't based on correlations alone, they consider causation.
It's easy to criticize, much more difficult to do the work. I read the links in the OP. I do not find Wffranz description to be even remotely adequate. I recommend readers to follow the links and for their own opinion. There are methods used in economics that are far less solid than what the attribution researchers did as preliminary analysis in this case.
Sorry boys & girls, Wffrantz is correct. There is nothing resembling credible scientific analysis going on here. Running a few Gameboy programs where garbage in produces garbage out is nothing like what actual scientists do. Especially going in reverse. Wow. And you want to equate economics with atmosperic physics? Huh? It's not propaganda to call out this kind of disinformation. Got a physics degree? Let me know.
[JH] Sloganeering snipped.
Please note that posting comments here at SkS is a privilege, not a right. This privilege can be rescinded if the posting individual treats adherence to the Comments Policy as optional, rather than the mandatory condition of participating in this online forum.
Please take the time to review the policy and ensure future comments are in full compliance with it. Thanks for your understanding and compliance in this matter.
jedaly... You don't seem to be offering up anything more than chiding as a response, though. If you think the science presented is wrong it would be up to you to demonstrate exactly how the science is wrong.