


 Arguments


Lessons from Past Climate Predictions: J.S. Sawyer in 1972
Posted on 19 March 2014 by dana1981
 In the Lessons from Past Predictions series, we've examined some impressively accurate global warming projections made over 30 years ago, for example by James Hansen in 1981 and Wallace Broecker in 1975. We recently learned of an even earlier successful prediction, made by John Stanley (J.S.) Sawyer in a paper published in Nature in 1972.
J.S. Sawyer was a British meteorologist born in 1916. He was elected a Fellow of the Royal Society in 1962, and was also a Fellow of the Meteorological Society and the organization's president from 1963 to 1965.
His 1972 paper reveals how much we knew about the fundamental workings of the global climate over 40 years ago. For example, Sawyer addressed the myth and misunderstanding that as a trace gas in the atmosphere, it may seem natural to assume that rising levels of carbon dioxide don't have much impact on the climate. Sawyer wrote,
"Nevertheless, there are certain minor constituents of the atmosphere which have a particularly significant effect in determining the world climate. They do this by their influence on the transmission of heat through the atmosphere by radiation. Carbon dioxide, water vapour and ozone all play such a role, and the quantities of these substances are not so much greater than the products of human endeavour that the possibilities of man-made influences may be dismissed out of hand."
Sawyer referenced work by Guy Callendar in the late 1930s and early 1940s, in which Callendar estimated that the amount of carbon dioxide in the atmosphere had increased by about 10 percent over the prior 100 years (a remarkably accurate measurement, as current estimates put the increase during that time at about 9 percent). Sawyer also referenced the Keeling Curve, which included continuous reliable measurements of the amount of carbon dioxide in the atmosphere beginning in 1958. Compared to measurements of human carbon dioxide emissions from burning fossil fuels, Sawyer noted that only about half of those human emissions were remaining in the atmosphere. The other half, climate scientists had concluded, was being absorbed by the oceans and the biosphere. Sawyer wrote,
"Industrial development has recently been proceeding at an increasing rate so that the output of man-made carbon dioxide has been increasing more or less exponentially. So long as the carbon dioxide output continues to increase exponentially, it is reasonable to assume that about the same proportion as at present (about half) will remain in the atmosphere and about the same amount will go into the other reservoirs."
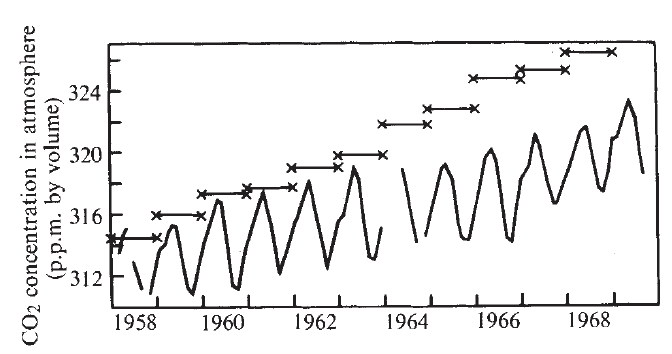
Lower curve: observed increase in atmospheric carbon dioxide from Mauna Loa. Upper horizontal lines: potential increase in atmospheric carbon dioxide from human fossil fuel burning, if all emissions remained in the atmosphere. From Sawyer (1972).
Indeed, over the past four decades, human carbon dioxide emissions have continued to increase more or less exponentially, and about half has continued to remain in the atmosphere with the other half accumulating in natural reservoirs. The carbon dioxide being absorbed by the oceans has contributed to the problem of ocean acidification, sometimes referred to as "global warming's evil twin."
Climate scientists also had a good idea how quickly carbon dioxide levels in the atmosphere would continue to rise as a result of human activities.
"Bolin has estimated that the concentration of carbon dioxide will be about 400 ppm by the year 2000. A recent conference put the figure somewhat lower (375 ppm)."
That prediction at the referenced 1971 conference on "the Study of Man's Impact on Climate" turned out to be quite accurate. In 2000, atmospheric carbon dioxide concentrations were measured at about 370 ppm.
In his paper Sawyer discussed the predicted impacts resulting from a continued rise in atmospheric carbon dioxide. He noted that directly "it might make some vegetation grow a little faster," which is generally true, although the situation is complicated. Sawyer noted that rising carbon dioxide levels would cause an increased greenhouse effect, and the associated warming would lead to more evaporation and more water vapor in the atmosphere. As a greenhouse gas itself, that rise in water vapor would act to further amplify human-caused global warming.
"...if world temperatures rise due to an increase in carbon dioxide, it is almost certain that there will be more evaporation of water–the water vapour content of the atmosphere will also increase and will have its own effect on the radiation balance."
Sawyer referenced a 1967 paper by Manabe and Wetherald, who had calculated that a doubling of atmospheric carbon dioxide would by itself cause approximately 1.3°C global surface warming, but that warming would be amplified by a further 1.1°C due to rising water vapor concentrations if the relative humidity were to remain constant. Observations have indeed unequivocally shown that water vapor strongly amplifies human caused global warming, for example as found by Dessler & Wong (2009).
Sawyer put all this information together to predict how much average global surface temperatures would warm between 1972 and 2000.
"The increase of 25% CO2 expected by the end of the century therefore corresponds to an increase of 0.6°C in the world temperature – an amount somewhat greater than the climatic variation of recent centuries."
Remarkably, between the years 1850 and 2000, atmospheric carbon dioxide levels did increase by very close to 25 percent, and global average surface temperatures also increased by just about 0.6°C during that time.
Sawyer also discussed that melting ice and snow in a warming world would act to amplify global warming, but suggested that increasing cloud cover might dampen global warming and act to regulate the global climate. However, recent research has shown that clouds may actually weakly amplify global warming as well. Sawyer discussed that climate scientists in the early 1970s understood that it would take on the order of 100 years (now understood to be even longer) for the planet to reach a new energy equilibrium due to the thermal inertia of the oceans, causing a lag in the global temperature response to an energy imbalance. Sawyer also understood that significant global warming would cause changes in weather and wind patterns around the world.
All in all, Sawyer's 1972 paper demonstrated a solid understanding of the fundamental workings of the global climate, and included a remarkably accurate prediction of global warming over the next 30 years. This goes to show that climate scientists have understood the main climate control knobs for over four decades.


Excellent !!
And don't forget about Chralie Keeling who set ground for many of Sawyer's ideas in 1960s:
Climate skeptic claims prebunked by Keeling
According to J S Sawyer the warming He estimated was a natural rebound from the little ice age so what was so ground breaking about His work?
[TD] See the rebuttal to the myth "We're Coming Out of the Little Ice Age." Just one of the flaws in that myth is that the Little Ice Age was not global.
Actually the latest peer reviewed evidence out of Sweden December 2013 seems to indicate that the little ice age was far more wide spread than preveliously thought.
[TD] Please provide a real citation rather than just a country and a month.
"Sundqvist et al. write that "the stable isotope records show enriched isotopic values during the, for Scandinavia, comparatively cold period AD 1300-1700 [which they equate with the Little Ice Age] and depleted values during the warmer period AD 800-1000 [which they equate with the Medieval Warm Period]." And as can clearly be seen from the figure above, the two δ18O depletion "peaks" (actually inverted valleys) of the Medieval Warm Period are both more extreme than the "peak" value of the Current Warm Period, which appears at the end of the record." This is peer reviewed and I found it by googling LIttle ice age sweden peer reviewed.
Your arguments seem to ignore and date from, the exact period (1995-2010), that the IPCC admitted showed NO no statistical warming. At first there was a claim that it was a PAUSE pause, but historical data from NON non-City based observation posts, have noted NO no pause, but a continuation of no statistical warming. Global Oceans haven't risen, European land has risen, and Indian land is sinking beneath the asian land mass. The same processes have been going on for Millions of years. We haven't just ignored negative feedback processes, we have pointedly tried to debunk them, and AVOIDED avoided any attempt to quantify their effects. You can hardly blame the US government for being skeptical.
(-snip-)
[JH] The use of "all caps" (except for acronyms) is prohibited by the SkS Comments Policy. Please read the Comments Policy and adhere to it.
[DB] Intimations of impropriety snipped.
By the way, Moderator, this web sites attempt to claim ISOTOPES isotopes points to human combustion, and not natural processes is incredibly ignorant of ACTUAL actual power production facilities. They have been low oxygen, high heat soak, cyclone furnaces since at least the 1950s. They produce a different mix of carbon and oxygen isotopes.
The point is it burns to carbon on one side, and FEO2, iron rust, burning carbon into a proto-diamond sand, and oxygen to black iron/atomic O2, in nano-particle size and reduce carbon dioxide emissions by at least an order of magnitude, so it's not anything like what your (sic) Science predicts. Did you even look at how modern furnaces work?
[JH] The use of "all caps" (except for acronyms) is prohibited by the SkS Comments Policy. Please read the Comments Policy and adhere to it.
[DB] All subsequent discussions of isotopes by you should take place on this thread, AFTER reading it.
Merlin5by5 @6:
1) First, is it possible for statistics to warm? I did not think so, and so do not think it is worthy of comment (or meaningful to say). You apparently disagree. So, over that interval, did your calculus warm or cool? What about your geometry?
Perhaps, just possibly, what you really meant to say was that "the warming trend from 1995-2010 was not statistically significant". That is not the same as "not warming". Every statistically significant warming trend can be decomposed into smaller parts, none of which have a statistically significant warming trend. That carries no implication as to whether or not the overall trend was a warming trend or not. Restating "the warming trend from 1995-2010 was not statistically significant" as "there was no statistically significant warming" merely attempts to gloss over that fact - to bamboozle people into thinking there was no warming trend when there was one.
2) The IPCC made no specific claim about the period 1995-2010. Rather, they discussed (Box TS3) the period 1998-2012. Further, they made no specific claims about the statistical significance of the trend in that period, merely noting:
So, when you claim 1995-2010 is "the exact period ... the IPCC admited showed NO statistical warming", you merely cram two falsehoods into one sentence (among all the other falsehoods).
3) Further, by sliding the the start period forward, you attempt to conceal that the actual start period of the period or reduced trend is 1998, year of record breaking heat due to a near record breaking El Nino. That is, you conceal the fact that the interval is cherry picked. You also create further falsehood, because the interval from Jan 1995-Dec 2010 does show statistically significant warming. Using HadCRUT4, the warming is 0.142 +/- 0.132 C per decade.
So, thirteen words, and three blatant falsehoods. That's a fairly impressive score. The rest of the rant appears to keep up that same ratio. So, perhaps instead of asking us what would be honest, you can start your "skepticism" by being truthfull. Of course, that simple step would end your fake skepticism as well.
Merlin5by5, while your argument about carbon isotopes is off-topic and mostly incoherent (i.e. nothing you said addresses the fact that fossil fuels, and thus power plant emissions, have different isotope signatures than growing plants), you can find an explanation of carbon isotopes (and various other proofs that humans are responsible for rising CO2 levels) here.
adrian smits @5... Correct me if I'm wrong but I believe you must be referring to this web page here. The full quote that you post is also found there.
What you would find if you pushed just a little further are a few interesting elements to this story. First, the graph presented on that page do not come from the paper that is being quoted. The paper doesn't specifically compare N. Sweden temperature to N. Hemisphere temps. They've pulled a trick on you by adjusting the two Y-axis scales to fit the message they want to deliver to you. Note the left axis applies to Korallgrotten series of oxygen isotope readings and the left side applies to NH temperature.
The graph originates from this website called CO2 Science, which is funded by the the fossil fuel industry and run by Dr Craig Idso. The CO2 Science site has gone through and reinterpreted peer reviewed research, added their own made up graphs, that generally do not agree with the actual findings of the actual research. And if you don't believe me, just pick one paper on their site, email the lead author and ask them if they agree with CO2 Science's interpretation. I've done this and in each case the scientists do not agree with the re-interpretations of their research.
The actual paper this is derived from is: Sundqvist et al 2010. Stable isotopes in a stalagmite from NW Sweden document environmental changes over the past 4000 years.
This research is limited to speliotherm data for Northern Sweden.
Adrian @5...
The paper itself is available here. You don't need to read it, but if you skip around and peruse it, you'll get a good feel for the actual nature and intent of the paper. You'll also see that there is nothing remotely like what is being claimed. The paper is all about the fascinating science of estimating past (as in 10,000 years ago) climate from stalagmites.
To give everyone some feel for the paper's contents, here is one paragraph from the Conclusions:
Here is the only mention, in the entire paper, of the MCA and the LIA are from the section titled Stable oxygen isotope patterns for the last 1000 years. Read it carefully and critically, and most importantly from the point of view of the author, not from the perspective of a climate change dismissive looking to find evidence of something that probably isn't there:
and later:
The bottom line: be very, very wary of what you read of other people — particularly climate change dismissive websites — claiming of actual, published, peer-reviewed papers. They very rarely say anything near what the climate change dismissives claim they say.
merlin5x5 @ 6 You are making a classic error in interpreting a statistical hypothesis test. A lack of a statistically significant trend does not mean that there has been no warming, but essentially just that there hasn't been enough warming for us to rule out the possibility that there has been no warming.
To demonstrate this, imagine I have a two headed coin, and I flip it four times and get a head each time (oddly enough). If you perform the standard test for the bias of a coin, you will find that the p-value (1/2)^4 is greater than the critical level (0.05 by tradition), so the evidence of bias is not statistically significant. Does that mean the coin is unbiased? Of course not, it has a head on both sides, it couldn't be more biased! All it means is that based solely on the observations, we cannot rule out the possibility that the coin is unbiased.
If this sounds counterintuitive, then yes, I would agree that it is, but that is the way that traditional frequentist hypothesis testing works (largely as a result of using a definition of probability that doesn't allow you to attach a numeric probability to the truth of a particular hypothesis - unlike the Bayesian framework).
Of course climate skeptic blogs tend to ignore this stats 101 issue.
Adrian Smits wrote "According to J S Sawyer the warming He estimated was a natural rebound from the little ice age so what was so ground breaking about His work?"
Except that isn't actually what he said. What he said was "Against this background [a change of 2C between the medieval optimum and the LIA and a rise in GMST of 0.6C between 1880 and 1940] a change of 0.6C by the end of the century will not be easy to distinguish from natural fluctuations and is certainly not a cause for concern".
It is a coincidence that the warming from 1880 to 1940 is about 0.6C (I suspect his data is now rather dated) and the warming from a 25% increase in CO2 by the end of the century is also about 0.6C. There is a difference in talking about past warming (1880-1940) and a prediction of future warming (that resulting from a 25% increase in atmospheric CO2) and you appear to be confusing the two, and hence missing the importance of what Sawyer actually wrote.
Sawyer also didn't say anything about a "rebound" from the LIA, just that it had warmed since the LIA, without implying any active mechanism.
I'd agree that 0.6C warming is no great cause for concern, if it stopped there I wouldn't be concerned either!