Climate Science Glossary

Term Lookup

Enter a term in the search box to find its definition.

Settings

Use the controls in the far right panel to increase or decrease the number of terms automatically displayed (or to completely turn that feature off).

Term Lookup

Settings


All IPCC definitions taken from Climate Change 2007: The Physical Science Basis. Working Group I Contribution to the Fourth Assessment Report of the Intergovernmental Panel on Climate Change, Annex I, Glossary, pp. 941-954. Cambridge University Press.

Home Arguments Software Resources Comments The Consensus Project Translations About Support

Bluesky Facebook LinkedIn Mastodon MeWe

Twitter YouTube RSS Posts RSS Comments Email Subscribe


Climate's changed before
It's the sun
It's not bad
There is no consensus
It's cooling
Models are unreliable
Temp record is unreliable
Animals and plants can adapt
It hasn't warmed since 1998
Antarctica is gaining ice
View All Arguments...


Username
Password
New? Register here
Forgot your password?

Latest Posts

Archives

Monthly Climate Summary: April 2011

Posted on 25 May 2011 by Michael Searcy

NOTE: Skeptical Science is going to begin re-posting the monthly climate summaries of Michael Searcy from Fresh Air. The Scent of Pine.  This is his monthly climate summary for April 2011.
Extreme Weather in the U.S. and Beyond

Download SummaryDrought. Wildfires. Wind. Hail. Tornadoes. Flooding.

April 2011 was a month defined by extreme weather conditions, particularly in the United States. Texas followed its driest March in over 100 years with its fifth driest April. Higher temperatures and absent rainfall were blamed for power outages at refineries, a spike in rabies reports, and wheat crop losses. By month’s end, 94% of the state was experiencing severe to exceptional drought conditions. The state has received a mere 1.68 inches of rain since February 1, easily besting its driest February-April period in history by nearly an inch. The deepening, months-long drought was accompanied by over 6,000 new wildfires that burned a record 1.79 million acres across the country during April and 2.2 million acres since January in Texas alone. The extreme conditions lead Texas governor Rick Perry to proclaim three days in April as “Days of Prayer for Rain”.

U.S. Precipitation Rankings - April 2011

Six states experienced record setting precipitation while record drought continued in Texas. Image credit: NOAA

The month also witnessed violent storm fronts that brought record precipitation, severe wind, and hail the size of golf balls and larger. Illinois, Indiana, Ohio, Pennsylvania, Kentucky, and West Virginia all reported their wettest April in history. Kentucky received an average of 11.88 inches of precipitation — nearly three times its long-term average for the month — breaking the state’s previous record by more than four inches. Up to 20 inches of rain, nearly half the normal annual amount, fell in some areas resulting in record flooding in the Ohio valley, and the Red River in Minnesota reached major flood stage for the third straight spring. The previous one-day record for severe wind reports of 455 was broken twice during the month. The storms of April 19 generated 575 severe wind reports, but even that number paled in comparison to the staggering 1,318 preliminary severe wind reports resulting from the storms of April 4.

But it was the tornadoes of April that truly made history. The 30-year-average for April tornadoes nationwide is 135. The monthly record was 542.

The preliminary number of tornadoes reported in April 2011 is 875.

U.S. Preliminary Tornado Reports - April 2011

April 2011 easily set a new record for tornado outbreaks. Image credit: NOAA

Single day events saw Wisconsin experience its largest monthly April tornado outbreak in history on April 9, and an EF-4 twister ripped a 21-mile path across the city of St. Louis on April 22. But it was the multi-day outbreaks that generated the most devastation. From April 14 to April 16, there were 329 preliminary tornado reports across 16 states with the final tally expected to be around 155, making it one of the largest outbreaks of any month in history. States of emergency were declared in Alabama, Mississippi, Oklahoma, and North Carolina. North Carolina bore the brunt with at least 30 confirmed tornadoes destroying hundreds of homes and businesses and resulting in at least 24 deaths, marking the three days as the largest tornado outbreak to ever hit the state, and the second deadliest outbreak on record for North Carolina.

April 25th through the 28th saw another massive amount of tornadic activity. An estimated 305 tornadoes hit from Texas to New York during the 4-day period, with 190 of them touching down over just 24 hours on the 27th and 28th. The outbreak included three EF-5, 12 EF-4, and 21 EF-3 tornadoes and killed nearly 350 people, mostly in the state of Alabama, making it the deadliest tornado outbreak since 1936. A strong EF-4 tornado packing winds of 190 mph devastated the cities of Tuscaloosa and Birmingham. This single cyclone tore a path as much as 1.5 miles wide and was on the ground for more than 80 miles causing an estimated 65 fatalities and over a thousand injuries.

Adelie penguins

Adelie penguin populations declining in warming Antarctica. Image credit: Peter Prokosch

Allstate, the nation’s largest publicly held personal lines insurer, announced $1.4 billion in estimated catastrophe losses for the month with over 100,000 claims reported to date in the affected areas. Risk-modeling company AIR Worldwide estimated the tornadoes caused $3.7 billion to $5.5 billion in insured losses industrywide. The years 2008 through 2010 were already the industry’s costliest for thunderstorm damage—which includes hail, tornadoes and other severe storms—with a total tab of $30 billion, said Robert Hartwig, president of trade group Insurance Information Institute, via a Wall Street Journal report, but 2011 is on track to exceed any of those three.

Meanwhile, half way around the world, Thailand experienced massive flooding that impacted nearly a million people. In what is normally the dry season, some areas received more than 50 inches of rain bringing mudslides and widespread damage to crops.

Research Examines Carbon Sinks and Ecological Impacts

Observational research from the scientific community continued to explore the ongoing reaction of natural environments and processes to changing conditions. Under a warming climate, Antarctica is becoming greener as grasses are finding better conditions under which to take root while warming waters and declining krill populations are resulting in declining penguin populations. An analysis of glaciers in the southern half of South America finds them melting at the fastest pace in the last 350 years. And earlier spring blooms are impacting the timing of ecological cycles while changes in rainfall patterns are influencing the migratory habits of some bird species.

Mangrove

USFS: Heavily deforested coastal mangroves are immense carbon stores. Image credit: Theo Allofs/Corbis

Separate studies focused on different global carbon sinks with researchers at Duke University concluding an 18-year study and finding the growth and seed-production abilities of several species of trees to be considerably more sensitive than previously thought to climatic changes such as earlier springs and summer droughts. The U.S. Forest Service found that coastal mangrove forests, which have been the targets of heavy deforestation, store more carbon than almost any other forest on Earth. And the longevity of underwater kelp forests was determined to be hindered by wave damage accompanying increased storm strength and frequency. Lastly, satellite data from NASA revealed lowered plant productivity in several of Earth’s larger ocean currents.

GOP Continues Opposition to EPA Regulation of Greenhouse Gases

In the political arena, carbon pricing remained a contentious subject in Australia while the U.S. Supreme Court signaled a likely rejection of a lawsuit brought by six states attempting to limit greenhouse gas emissions by a myriad of power companies around the nation. The court indicated a preference for such regulations to be handed by the Environmental Protection Agency (EPA), an organization facing its own challenges.

San Rafael Glacier

South American glaciers melting at fastest rate in 350 years. Image credit: Neil Glasser

The Republican party in the United States continued its multi-pronged attack on the EPA throughout the month. A bill aimed at blocking the EPA from using the Clean Air Act to regulate greenhouse gas emissions easily passed in the House of Representatives, but a companion bill failed in the U.S. Senate. And, in a budget deal compromise to avoid a government shutdown, the Republicans won significant environmental provisions that reduce the EPA’s budget by $1.6 billion, remove gray wolves in the northern Rockies from the endangered-species list, and defund the Interior Department’s Wild Lands initiative, which would have inventoried federal lands for their wilderness characteristics.

Meanwhile a study focusing on methane releases from hydraulic fracturing, an increasingly controversial process used in the drilling extraction of natural gas, found that such releases may contribute as much or more than coal to global warming. Natural gas has been gaining widespread favor amongst politicians in both parties in the U.S. considering its large natural stores in the country, relatively easy access, minimal regulation, and lower costs particularly when compared against rising oil prices.

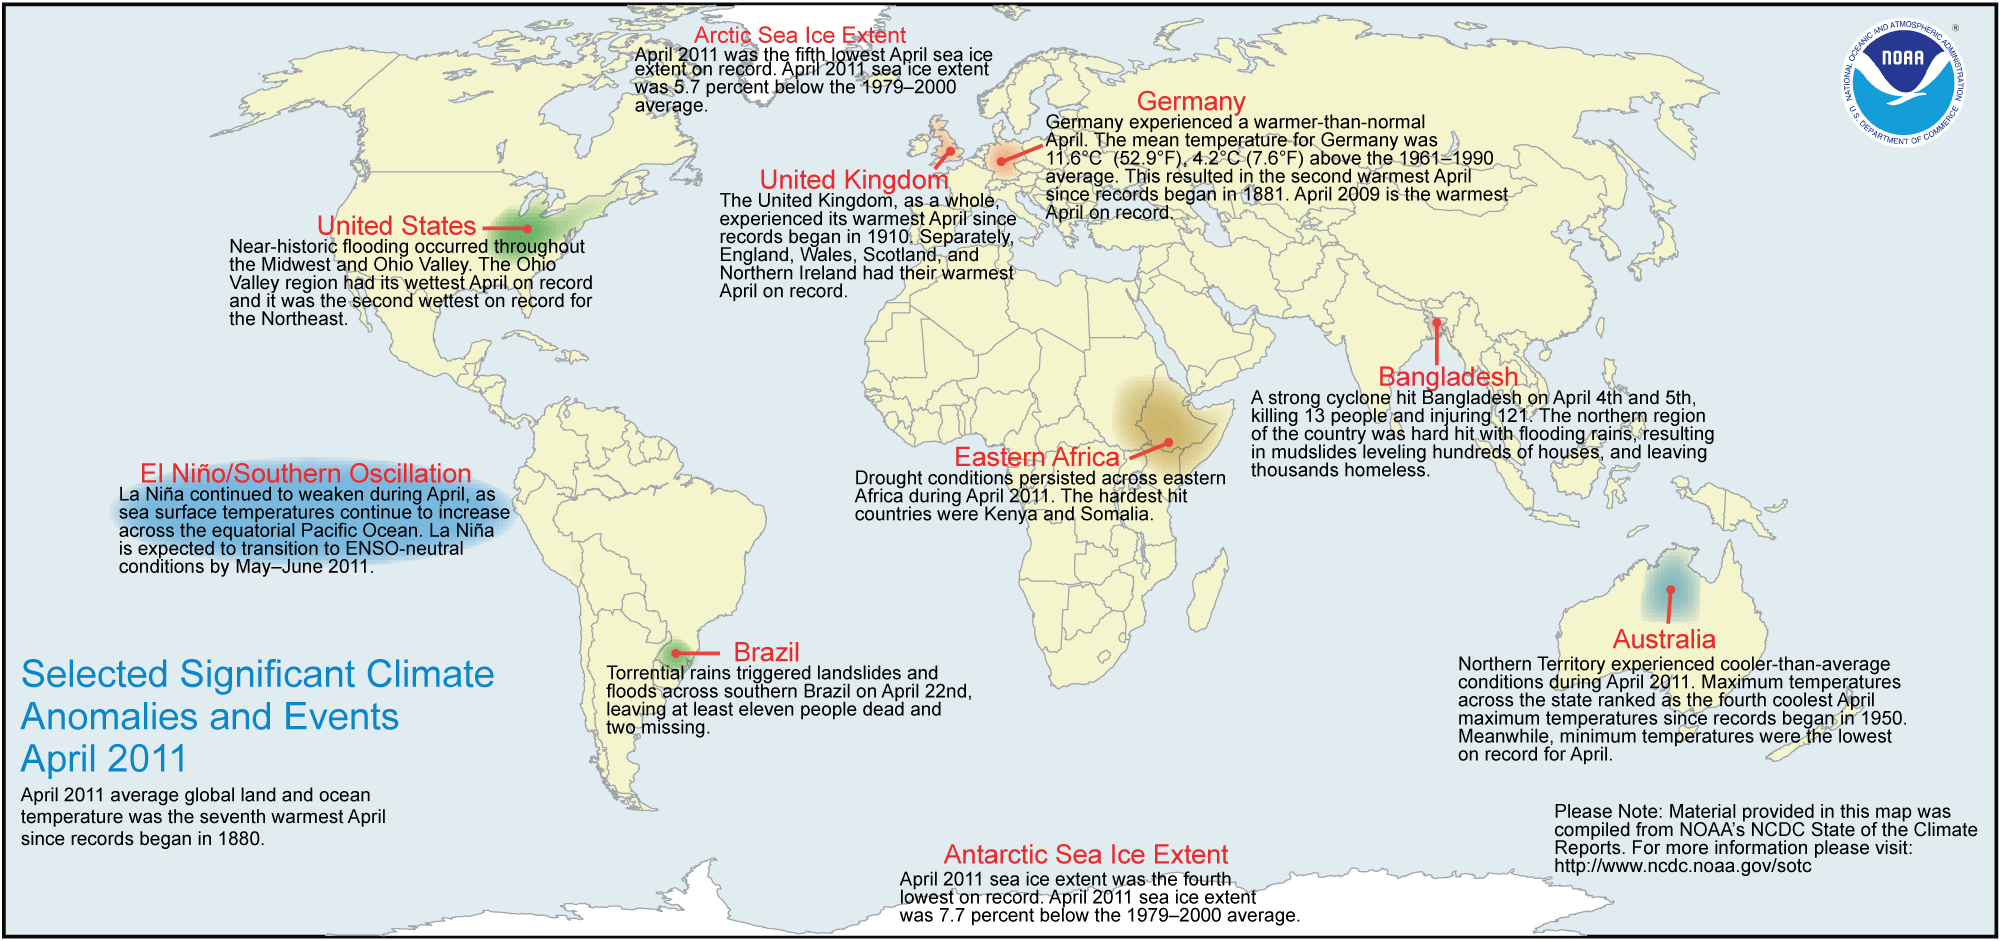
Selected Significant Climate Anomalies and Events, April 2011

Selected Significant Climate Anomalies and Events, April 2011. Image Credit: NOAA


Quotable

“Whereas, throughout our history, both as a state and as individuals, Texans have been strengthened, assured and lifted up through prayer; it seems right and fitting that the people of Texas should join together in prayer to humbly seek an end to this devastating drought and these dangerous wildfires”

- Rick Perry, Governor, State of Texas
Proclamation for Days of Prayer for Rain
April 21, 2011


Highlights

0 0

Printable Version  |  Link to this page

Comments

Comments 1 to 34:

  1. I am glad this issue points out the danger of 'fracking'. It has, after all, been far too easy for the industry to sweep the problems under the rug, taking advantage of the political climate to make a quick buck -- at great expense to our descendants. The fallacy they use to promote this folly is familiar, too. Of course, the industry response fits the pattern of dishonesty some of us have learned to expect from them, the dishonesty Darrell Huff described so brilliantly in "How to Lie with Statistics". What pattern is that? Why, exactly what industry spokesman Ingraffea did, casting doubt on the conclusion NOT because there is real room for doubt, but because it is inconvenient/embarrassing for the industry. And yes, this is the pattern: emphasize/repeat doubt when the conclusion is not favorable to you, explain it away, distract from the doubt when the conclusion IS favorablle to you. Duff provided a memorable example, the cashier who always claims an innocent mistake, but always makes the mistakes in his own favor.
    0 0
  2. I have had a go at how we talk about extreme weather here http://davidhortonsblog.com/2011/05/25/dont-mention-the-weather/. The statistics in the report above are staggering - "The 30-year-average for April tornadoes nationwide is 135. The monthly record was 542. The preliminary number of tornadoes reported in April 2011 is 875."
    0 0
    Response:

    [DB] Hot-linked URL.

  3. And the PNW and the Upper Central Great Plains continue to be colddddddddddddddd. When that cold air hits warmer air.....watch out! WE need to get that pesky Greenland high to move. The AMO is making a switch it seems....and holding that high shoveling cold air south.
    0 0
    Response:

    [DB]  "The AMO is making a switch it seems"

    Perhaps you mean the AO?  The AMO is a 20-40 year oscillation; we have been in a warm phase since the mid-90s:

    AMO

    [Source]


    The AO has been positive for several months now:

    AO

    [Source]

    It would reflect better on you to cite a source when venturing opinions on a science blog.

  4. Now I know that the tornado outbreaks are the consequence of natural influences and global warming, but they sure are off the charts!. Be interesting to see how they measure up in the May 2011 round-up, given they are still hammering the US as I write.
    0 0
  5. I would cautious about attributing any of this to global warming yet. Certain types of extreme weather are predicted by global warming but I thought the jury was still well and truly out on tornados and even tropical storms. What I dont see on that chart is much of a trend and its trends that would make me think that global warming is a factor.
    0 0
  6. Also, I rather feel that there is a tendency to rush in and attribute these events to global warming because these are attention-grabbing, especially compared to the real effects where are slow and insidious, because there is a hope that maybe this will jolt people out of complacency and into action. However, there is also a large risk of losing credibility when going in ahead of the real science. Leave the exaggerations to the anti-science bunch. Activists of all persuasions somehow cant resist hyperbole and in doing so lose their credibility.
    0 0
  7. Phil Scadden - I'm drafting up a post on tornadoes & severe thunderstorms. The gist I get from many climate blogs, is that very few commenters have actually looked at the peer-reviewed literature. Modelling definitely indicates an increase in severe thunderstorm frequency. But as for tornadoes, which are spawned from severe thunderstorms, that's still very much up in the air (pun intentional).
    0 0
  8. The fact that the Plains Indians were nomadic might suggest historic climate instability in this part of the world.
    0 0
  9. Although admittedly well-presented, this "Monthly Climate" initiative is definitely a step in the wrong direction. None of these events can ever be directly related to climate change. The whole term "Monthly Climate" is a ridiculous contradictio in terminis. This forced attempt to relate a cold winter or a longer-than-normal tornado season to climate change ultimately undermines the credibility of climate scientists: the same scientists who, rightly so, warn against the denialist practice of computing climate trends shorter than 10 years. Let us climate scientists continue to focus and work hard on extending data series and do smart long-term analysis rather than be drawn into this hysterical propaganda. Skeptical Science, please stop re-posting this.
    0 0
  10. RSVP "Plains Indians were nomadic..." because they followed the buffalo herds. But not all - others lived fairly settled lives with near-permanent villages and consistent agriculture. pkm - the News section is certainly weather rather than climate. But the Research roundup is a neat feature.
    0 0
  11. adelady But weren't the buffalo herds movements effected by changing weather and climate patterns?
    0 0
  12. skyhunter Yup. They're called seasons.
    0 0
  13. DB: I meant the AMO: http://www.esrl.noaa.gov/psd/data/correlation/amon.us.data Note the trend since the middle of 2010.
    0 0
    Response:

    [DB] I would suggest learning a little time-series analysis.  Using the EyecrometerTM does not give you appropriate context.  What about the first 5 months of 2009 then?  The AMO is a 20-40 YEAR oscillation.  On a monthly basis, much variability/noise is present.  All you can look at is if the monthly number is positive or negative and then all you can infer from that is "Hmm, interesting."  All else is cherry-picking.

  14. pkm, Obviously I disagree. I think there are many benefits to noting weather anomalies in the context of a climate discussion, as does NOAA apparently. Most of the weather event related details and statistics are drawn from their monthly "State of the Climate" summaries, which are also linked within the discussion in several places. And you'll notice, not by accident, that no climatic trend conclusions are drawn from these singular weather event or singular seasonal notations. That said, all weather events (yes, even cold ones) are influenced by changes to the encapsulating environment in which they occur. Those influences may be large or small, direct or indirect. But they are there, in the same manner that all bodily functions are impacted in varying degrees that change over time by a rising internal body temperature. Inclusion of the weather anomalies in these summaries serves several purposes:
    1. It provides a context for other concurrent events
    2. It puts a relatable human perspective on impacts from severe weather events including fatalities, costs (direct and indirect), and disruptions to human processes (e.g., crop and livestock losses as a result of drought, shipping closures on the Mississippi as a result of flooding, etc.)
    3. It provides a compact historical record of anomalous weather events within the frame of a warming world.
    While you may disagree, I think all of these items make such summaries worthwhile.
    0 0
  15. Nice pun Rob, Tornadoes have not been modelled very well due largely to reporting issues. Previously, many tornadoes that occurred went unreported because no one saw them, or they did not cause any damage. The best long-term data comes from the so-called violent tornadoes; defined as being at least an F3 or F4 (depending on the researcher). Chagnon and Hewings have compiled some statistics lookign at violent tornadoes (among other things) and found a downward trend from 1950-1997, although the data has a large scatter. Tornadoes are not caused so much by warming, but the metting of warm air and cold. The abundance of cold air over the plains has probably been the biggest contributor to the storms this year. http://wattsupwiththat.com/2011/03/01/big-time-la-nina-tornado-and-spring-flood-season-possible/ https://www.cfa.harvard.edu/~wsoon/DaveLegates03-d/Changnon03.pdf
    0 0
  16. Eric @15, "Tornadoes are not caused so much by warming, but the metting of warm air and cold." It is much more complicated than that-- there are a number of factors at play here, including much above average ocean temperatures in the Gulf of Mexico providing a source of super juicy low-level air to fuel the storms, drought in Texas and OK panhandle that may be affecting the location and strength of the dryline. The juxtaposition of the great plains low-level jet and the polar jet is also playing a role in enhancing low-level vertical wind shear critical for supercell thunderstorms that produce tornadoes. Dr. Jeff Masters has an excellent article on this issue. I recommend people read it. Ultimately it boils down to this: "In summary, this year’s incredibly violent tornado season is not part of a trend. It is either a fluke, the start of a new trend, or an early warning symptom that the climate is growing unstable and is transitioning to a new, higher energy state with the potential to create unprecedented weather and climate events. All are reasonable explanations, but we don’t have a long enough history of good tornado data to judge which is most likely to be correct." Masters also notes that there have been several billion dollar storms/events in the USA so far in 2011, with damages exceeding 20 billion dollars so far.
    0 0
  17. Albatross@16: Actually, current SST anomoly of the Gulf shows that it is not much above. Parts are warmer and parts are colder. http://www.esrl.noaa.gov/psd/data/correlation/amon.us.data
    0 0
  18. DB: I understand the AMO quit well, and know that it is a long term oscillation. We know that the AMO and the AO affect central upper plains of the USA weather. The result of the current status of them combined is keeping an open door to cold coming south. We have been between .7 and .4 degrees F below 30 year averages for several months now, and current forcast show no easing of this pattern. This is enhancing the development of tornados as the contrast is very strong.
    0 0
  19. Camburn @17, Sorry for not being clear-- I was specifically referring to the SST anomalies during the super outbreak/s in April as per Dr. Master's blog. Positive anomalies have weakened since then, but here are the mean anomalies for the past month, still above the 1971-2000 average in parts of the GOM. This is what Dr. Master said (in the link that I provided @16) when referring to the record breaking outbreak in April: "April 2011 sea surface temperature in the Gulf of Mexico were at their third highest levels of the past 100 years, so there was plenty of warm, moist air available to create high instability, whenever approaching storm systems pulled the Gulf air northwards into Tornado Alley, and brought cold, dry air south from Canada." It would help if contrarians actually followed the links provided before opining. Since then the SST anomalies have weakened, here are the mean anomalies (wrt the 1971-2000 base period) for the past month. Mean SST anomalies have still been above average over portions of the Gulf over that time. [Source]
    0 0
  20. Albatross: You are correct. I should have been thinking April 10th verses now as that is the context of the subject matter. The temps to the north in April were even colder than the present deviation, so it was a very strong clash.
    0 0
  21. 16 "In summary, this year’s incredibly violent tornado season is not part of a trend... the climate is growing unstable and is transitioning to a new, higher energy state..." ??? The energy relevant to tornadoes ( which stem from mid-latitude cyclones ) is driven by temperature gradient and most certainly not from the sum total thermal state of the earth. One of the predictions from the gcms was increased warming at the poles. Should this verify, one might expect reduced storminess as a result of reduced pole to equator thermal gradient. Fortunately, the main factors determining the general circulation change very slowly: orbital angles, location of the oceans, location of the continents and mountains. That's why the Namibian Desert has been a desert for sixty million years.
    0 0
  22. As ClimateWatcher implies, "growing unstable" is meaningless without a measurement. Likewise a "higher energy state" sounds to be like global OHC or some other global state which has no direct influence on tornadoes here. There seemed to be two local factors this year, the strong jet, the dry line further east in the April outbreak and low latitude storminess in the current outbreak. If any of those are trending positive with global warming, I will be quite surprised. There are models that include the dry line (e.g. http://digitalcommons.unl.edu/cgi/viewcontent.cgi?article=1132&context=geosciencefacpub) but are notably studying natural variations. I have not found model results for spring storms in the U.S. (studies of winter events seem to be more popular). But it will be good to see a post that focuses on US local factors rather than generic world-wide trends.
    0 0
  23. If I were forced to bet, I would go fluke and guess next year will be normal. However, there is so far a dearth of published science on this so if someone (Rob?) can present a more convincing case for an alternative explanation from peer-reviewed sources, then I would very interested to read it.
    0 0
  24. Michael @14 Inclusion of the weather anomalies in these summaries serves several purposes: 1. It provides a context for other concurrent events 2. It puts a relatable human perspective on impacts from severe weather events including fatalities, costs (direct and indirect), and disruptions to human processes (e.g., crop and livestock losses as a result of drought, shipping closures on the Mississippi as a result of flooding, etc.) 3. It provides a compact historical record of anomalous weather events within the frame of a warming world. While I do find a good documentation of weather anomalies a good idea, I continue to have problems in which weather and climate are being messed up in this report. I agree that nowhere an explicit link between these weather anomalies and climate change is made, but implicitly they merge seamlessly. After all it is published under the title "Monthly Climate", and as I learned this is in a monthly series called "State of the Climate"! Apparently NOAA feels the need to assess the state of the climate on a time scale that is barely longer than that for a low-pressure system to pass over your house. It is like visiting your dentist twice a day to see if you haven't developed any caries yet. Obviously a warming world will carry with it a changed set of weather event statistics, let there be no doubt about that. And certainly that is going to impact on societies as a whole. But given the intrinsical non-linear behaviour of weather and climate, the trend of (explicitly or implicitly) using individual weather events to illustrate climate change is simply a dangerous exercise, both scientifically and in the long run also image-wise.
    0 0
  25. pkm, While I appreciate your point, it would be much worse "image-wise" to dismiss such anomalous events off-hand as nothing more than "odd weather" or ignoring them altogether as if they occur in a vacuum with no connection whatsoever to the longer-term conditions under which they occur. When a warming world results in climatic change the impact of those climatic changes, across all aspects of our daily lives, is expressed through individual events. When you understand the breadth and depth of impact from a single event, it carries considerably more weight when countless climate studies conclude, "Expect more".
    0 0
  26. pkm: "But given the intrinsical non-linear behaviour of weather and climate, the trend of (explicitly or implicitly) using individual weather events to illustrate climate change is simply a dangerous exercise, both scientifically and in the long run also image-wise." I agree it's dangerous to do this when there is a mob of somewhat-less-than-critical folk looking intensely for anything that can be used to weaken the image of the science. Yet such reports are useful for those people who understand the relationship between weather and climate. I don't want to have to look up every anomalous weather event around the globe each month; I want someone else to do it. I know that each event isn't necessarily a signal for GW. Indeed, it is a useful exercise to work through each event and locate the possibilities and probabilities where the causes of its anomalousness is concerned. Just because people are able to become confused and draw the wrong conclusions is no reason to hide the information. On a site like this, it attracts more people and, in accord with the design and purpose of this site, even engages a few in the critical community.
    0 0
  27. Eric and CW, Masters is in all likelihood referring to the increase in moist-static energy (including latent heat) in the boundary layer arising from an increase in low-level moisture. Sensitivity tests and theoretical work has demonstrated that increases as small as 1 g/kg in low-level atmospheric moisture has significant implication for thunderstorms, both in terms of their initiation and their intensity. Updraft strength (in a sheared environment) is an important mechanism for tilting and stretching (one of several processes at play) horizontal vorticity to generate a mesocyclone or rotating updraft. We also know that moisture levels are increasing in the atmosphere globally. In recent years a few papers have been published on how severe storm environments might change as the USA warms and as low-level moisture increases. Note that they do not speak to trends in tornado occurrence per se, and keep in mind that only a small percentage of supercells actually produce tornadoes, but a consistent pattern of increasing severe storm potential is evident. Van Klooster and Roebber (2009, J. Climate): “In this work, the authors present a “perfect prog” approach to estimating the potential for surface-based convective initiation and severity based upon the large-scale variables well resolved by climate model simulations. This approach allows for the development of a stable estimation scheme that can be applied to any climate model simulation, presently and into the future. The scheme is applied for the contiguous United States using the output from the Parallel Climate Model, with the Intergovernmental Panel on Climate Change third assessment A2 (business as usual) as input. For this run, relative to interannual variability, the potential frequency of deep moist convection does not change, but the potential for severe convection is found to increase east of the Rocky Mountains and most notably in the “tornado alley” region of the U.S. Midwest. This increase in severe potential is mostly tied to increases in thermodynamic instability as a result of ongoing warm season surface warming and moistening. Trapp et al. (2009, GRL) "Our study shows that the frequency of severe thunderstorm forcing increases in time in response to the A1B scenario of GHG emissions. This is also true for severe-thunderstorm forcing that is constrained by the occurrence of convective precipitation. The rate of increase varies with geographical region and inherently depends on (i) low-level water vapor availability and transport, and (ii) the frequency of midlatitude synoptic-scale cyclones during the warm season. The current report provides further evidence of the effect of anthropogenic GHG emissions on long-term trends in thunderstorm forcing [Trapp et al., 2007a; Del Genio et al., 2007]." Trapp et al. (2007, PNAS) "We use global climate models and a high-resolution regional climate model to examine the larger-scale (or “environmental”) meteorological conditions that foster severe thunderstorm formation. Across this model suite, we find a net increase during the late 21st century in the number of days in which these severe thunderstorm environmental conditions (NDSEV) occur. Attributed primarily to increases in atmospheric water vapor within the planetary boundary layer, the largest increases in NDSEV are shown during the summer season, in proximity to the Gulf of Mexico and Atlantic coastal regions." Del Genio et al. (2007, GRL) "For the western United States, drying in the warmer climate reduces the frequency of lightning-producing storms that initiate forest fires, but the strongest storms occur 26% more often. For the central-eastern United States, stronger updrafts combined with weaker wind shear suggest little change in severe storm occurrence with warming, but the most severe storms occur more often." There have also been a few papers published on the impacts of soil moisture (thinking of the possible role of the current drought in Texas and Oklahoma on the recent spate of severe storms). For example, Grasso (2000), and Shaw et al. (1997).
    0 0
  28. 27. You're looking at the warm side but not the cold side. Moisten up the air mass within the cold trough and you've diminished the kinetic energy from which the tornadic cells evolved. The same trough that passed and plowed up impressive moisture ahead of the system also had very dry air ( dewpoints -20F ) behind the system. To be sure tornadoes are multi-factorial which leads to irregular statistics. It's just that the AGW theory predicts a decrease in lots of factors.
    0 0
  29. CW, Re "Moisten up the air mass within the cold trough and you've diminished the kinetic energy from which the tornadic cells evolved." This is a nonsensical (and unsupported) statement. Read the papers above [you might also want to read Crook (1996)] and please stop talking though your hat for the sake of arguing.
    0 0
  30. Albatross, those models for the end of this century (lots of unknowns) are mildly interesting but even their elevated CAPE don't hold a candle to the dynamics in the weather models of today. For example, here's the discussion before the Oklahoma outbreak this past Monday http://www.wxforum.net/index.php?topic=11669.0 The dynamic factors they talk about have nothing whatsoever to do with "a 1 g/kg in low-level atmospheric moisture has significant implication for thunderstorms", but in this case the opposite: "unlike the last 2 days when limited areal coverage precluded more than a slight risk...we may have the opposite problem today with storms becoming too numerous and updraft competition limiting the chances of any one storm to maintain dominance" The primary dynamic factor in this particular discussion was the "very potent negative-tilt upper trough" There are a number of interesting and somewhat conflicting trends in that type of activity. This paper http://stratus.ssec.wisc.edu/papers/key-chan_cyclones_grl1999.pdf shows an increase in upper low frequency in spring in midlatitudes worldwide, but it varies by location as shown here http://citeseerx.ist.psu.edu/viewdoc/download?doi=10.1.1.143.290&rep=rep1&type=pdf with a small downward trend in surface cyclone frequency over the N central and NE US from 1980 to 2006 An trend resulting from the increase in low level moisture that you mentioned is most likely to show up as an increase in rainfall intensity : http://journals.ametsoc.org/doi/abs/10.1175/2010JHM1229.1 rather than violent weather which has other more important factors behind it.
    0 0
  31. My citeseer link above seems to be incomplete (uses cookies maybe?) Try this instead http://acmg.seas.harvard.edu/publications/leibensperger2008.pdf (see fig 4 and note that the surface cyclones are quite often reflected from the upper lows and should have similar trends.
    0 0
  32. Eric @30, Sorry, while I agree with some of what you are saying. A careful review of the papers I provided at 27 and 29 and the literature on severe storms (something that I happen to be very familiar with) is not consistent with what you are saying in your post. I am busy now, but will post on this as soon as possible.
    0 0
  33. I will look forward to reading that. Crook is interesting, he analyzes and simulates two cases: 1) "This convergence line developed as a cold air surge, forced by previous convection over the Rocky Mountains, propagated eastward, and encountered the low-level southeasterlies over the Plains." 2) Around 1550 LT, several convective storms developed as a low level wind surge moved up from the south and strengthened the convergence line." But then he had difficulty initiating convection in his simulations. He blames measurement and initial conditions to deflect the blame from where it properly lies, the fidelity, scale and even chaotic physics of his model. He seems quite willing to downplay the horizontal forcing that he acknowledged and focus only on vertical forcing perhaps triggered with a few well placed horizontal temperature anomalies. His simulation results are not very convincing.
    0 0
  34. Eric, I get the feeling that you are trying to create faux debate here. I'm not entirely sure what you are trying to claim? What is your thesis? That the above papers are all wrong in their findings that the frequency of severe storms are likely to increase in certain regions down the road with AGW? Updraft strength is a good proxy for storm severity, and maximum updraft velocity ~ (2*CAPE)^0.5, where CAPE = convective available potential energy. Note this value overestimates max. updraft velocity because it neglects the impacts of water loading on the updraft speed. Regardless, increasing CAPE via increased low-level moisture with increase max. updraft velocity and potential for severe storm activity. I addressed the importance of vertical wind shear in another post. Yes, synoptic scale forcing can be and is important, but do not underestimate the importance of mesoscale boundaries (e.g., outflow boundaries from existing or old storms) in triggering and organizing storms and for providing low-level vorticity that can be ingested into the updraft to facilitate updraft rotation and possibly tornadogenesis. Regarding dynamics, this has already been acknowledged and addressed Eric. Trapp et al. (2009) state that: "The rate of increase varies with geographical region and inherently depends on (i) low-level water vapor availability and transport, and (ii) the frequency of midlatitude synoptic-scale cyclones during the warm season." But even with that caveat they find an increase in severe storm environments. Del Genio et al. (2007) state: "For the central-eastern United States, stronger updrafts combined with weaker wind shear suggest little change in severe storm occurrence with warming, but the most severe storms occur more often." Trapp et al. (2010) have proposed some downscaling procedures to address some of the issue identified in previous work, and there initial findings suggest that such a methodology holds much promise. So I'm afraid that your arguments are moot. If you insist on taking this further, maybe it is time to take this to another thread. Warning though, I'm busy most of this coming week, so I might only be posting short, non-technical posts at SkS.
    0 0

You need to be logged in to post a comment. Login via the left margin or if you're new, register here.


The Consensus Project Website

THE ESCALATOR

(free to republish)


© Copyright 2024 John Cook
Home | Translations | About Us | Privacy | Contact Us