


 Arguments


New research, January 15-21, 2018
Posted on 25 January 2018 by Ari Jokimäki
A selection of new climate related research articles is shown below.
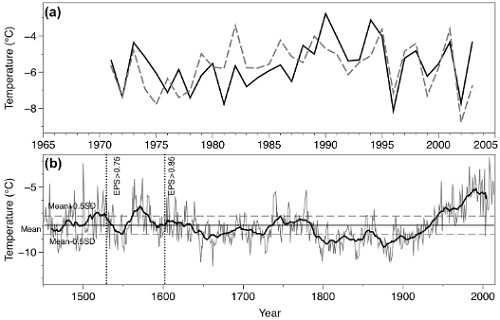 The figure is from paper #63.
Climate change mitigation
1. Does replacing coal with wood lower CO2 emissions? Dynamic lifecycle analysis of wood bioenergy
"Because combustion and processing efficiencies for wood are less than coal, the immediate impact of substituting wood for coal is an increase in atmospheric CO2 relative to coal. The payback time for this carbon debt ranges from 44–104 years after clearcut, depending on forest type—assuming the land remains forest. Surprisingly, replanting hardwood forests with fast-growing pine plantations raises the CO2 impact of wood because the equilibrium carbon density of plantations is lower than natural forests. Further, projected growth in wood harvest for bioenergy would increase atmospheric CO2 for at least a century because new carbon debt continuously exceeds NPP. Assuming biofuels are carbon neutral may worsen irreversible impacts of climate change before benefits accrue."
"We estimate that NDCs project into 56.8–66.5 Gt CO2eq yr−1emissions in 2030 (90% confidence interval), which is higher than previous estimates, and with a larger uncertainty range. Despite these uncertainties, NDCs robustly shift GHG emissions towards emerging and developing countries and reduce international inequalities in per capita GHG emissions. Finally, we stress that current NDCs imply larger emissions reduction rates after 2030 than during the 2010–2030 period if long-term temperature goals are to be fulfilled. Our results highlight four requirements for the forthcoming 'climate regime': a clearer framework regarding future NDCs' design, an increasing participation of emerging and developing countries in the global mitigation effort, an ambitious update mechanism in order to avoid hardly feasible decarbonization rates after 2030 and an anticipation of steep decreases in global emissions after 2030."
7. Response to marine cloud brightening in a multi-model ensemble
"Results indicate that CO2 leakage is possible within and outside the electric sector, ranging from negative 70% to over 80% in our scenarios, with primarily positive leakage outcomes. Typically ignored in policy analysis, leakage would affect CO2 reduction benefits. We also observe other potential societal effects within and across regions, such as higher electricity prices, changes in power sector investments, and overall consumption losses. Efforts to reduce leakage, such as constraining power imports into the SCC pricing region likely reduce leakage, but could also result in lower net emissions reductions, as well as larger price increases."
9. Economic consequences of global climate change and mitigation on future hydropower generation
12. Studying household decision-making context and cooking fuel transition in rural India
Climate change
16. Future Caribbean Climates in a World of Rising Temperatures: The 1.5 vs 2.0 Dilemma
Climate Forcings and Feedbacks
17. An assessment of tropospheric water vapor feedback using radiative kernels
"Water vapor feedbacks on different time scales are investigated using radiative kernels applied to the Atmospheric Infrared Sounder (AIRS) and Microwave Limb Sounder (MLS) satellite observations, as well as the Coupled Model Intercomparison Project Phase 5 (CMIP5) model simulation results. We show that the magnitude of short-term global water vapor feedback based on observed interannual variations from 2004 to 2016 is 1.55 ± 0.23 W m–2 K–1, while model simulated results derived from the CMIP5 runs driven by observed sea surface temperature range from 0.99 to 1.75 W m–2 K–1, with a multi-model-mean of 1.40 W m–2 K–1. The long-term water vapor feedbacks derived from the quadrupling of CO2 runs range from 1.47 to 2.03 W m–2 K–1, higher than the short-term counterparts. The systematic difference between short-term and long-term water vapor feedbacks illustrates that care should be taken when inferring long-term feedbacks from interannual variabilities. Also, the magnitudes of the short-term and long-term feedbacks are closely correlated (R = 0.60) across the models, implying that the observed short-term water vapor feedback could be used to constrain the simulated long-term water vapor feedback. Based on satellite observations, the inferred long-term water vapor feedback is about 1.85 ± 0.32 W m–2 K–1."
18. Probabilities of causation of climate changes
19. An intraseasonal variability in CO2 over the Arctic induced by the Madden−Julian oscillation
20. Climate Feedback on Aerosol Emission and Atmospheric Concentrations
Temperature and Precipitation
"A 0.24°C jump of record warm global mean surface temperature (GMST) over the past three consecutive record-breaking years (2014-2016) was highly unusual and largely a consequence of an El Niño that released unusually large amounts of ocean heat from the subsurface layer of the northwestern tropical Pacific (NWP). This heat had built up since the 1990s mainly due to greenhouse-gas (GHG) forcing and possible remote oceanic effects. Model simulations and projections suggest that the fundamental cause, and robust predictor of large record-breaking events of GMST in the 21st century is GHG forcing rather than internal climate variability alone. Such events will increase in frequency, magnitude and duration, as well as impact, in the future unless GHG forcing is reduced."
24. Seasonal and elevational contrasts in temperature trends in Central Chile between 1979 and 2015
25. Future changes over the Himalayas: Maximum and minimum temperature
27. Future changes in extreme precipitation indices over Korea
28. Regional frequency analysis of extreme rainfall in Sicily (Italy)
29. Decadal change of the south Atlantic ocean Angola–Benguela frontal zone since 1980
Cryosphere
31. Causes of glacier melt extremes in the Alps since 1949
"Using surface energy balance simulations, we show that three independent drivers control melt: global radiation, latent heat and the amount of snow at the beginning of the melting season. Extremes are governed by large deviations in global radiation combined with sensible heat. Long-term trends are driven by the lengthening of melt duration due to earlier and longer-lasting melting of ice along with melt intensification caused by trends in long-wave irradiance and latent heat due to higher air moisture."
32. Widespread Moulin Formation During Supraglacial Lake Drainages in Greenland
Hydrosphere
34. Quantifying the sources of uncertainty in an ensemble of hydrological climate-impact projections
35. Groundwater recharge in desert playas: current rates and future effects of climate change
36. Sources of uncertainty in hydrological climate impact assessment: a cross-scale study
Carbon Cycle
37. Simulated impact of glacial runoff on CO2 uptake in the Gulf of Alaska
"A conceptual model of the annual/seasonal temperature response of respiration suggests that changes in seasonal temperature during this period are unlikely to cause a significant decrease in annual respiration. The ecosystem models suggest that trends in both gross primary production and terrestrial ecosystem respiration slowed down slightly, but the resulting slight acceleration in net ecosystem productivity is insufficient to explain the increasing trend in SLAND. Instead, the roles of alternative drivers on the accelerating SLAND seem to be important."
Atmospheric and Oceanic Circulation
39. Contribution of Surface Thermal Forcing to Mixing in the Ocean
Extreme Events
Climate change impacts
Mankind
43. Hendra Virus Spillover is a Bimodal System Driven by Climatic Factors
44. Modelling maize phenology, biomass growth and yield under contrasting temperature conditions
"Although few administrative limits have been set on water availability in the east, water managers have identified 315 fresh surface water and 398 fresh groundwater basins (with 151 overlapping basins) as areas of concern (AOCs) where water supply challenges exist due to drought related concerns, environmental flows, groundwater overdraft, or salt water intrusion. This highlights a difference in management where AOCs are identified in the east which simply require additional permitting, while in the west strict administrative limits are established. Although the east is generally considered 'water rich' roughly a quarter of the basins were identified as AOCs; however, this is still in strong contrast to the west where 78% of the surface water basins are operating at or near their administrative limit."
Biosphere
"Anthropogenic climate warming has already affected the population dynamics of numerous species and is predicted to do so also in the future. To predict the effects of climate change, it is important to know whether productivity is linked to temperature, and whether species’ traits affect responses to climate change. To address these objectives, we analysed monitoring data from the Finnish constant effort site ringing scheme collected in 1987–2013 for 20 common songbird species together with climatic data. Warm spring temperature had a positive linear relationship with productivity across the community of 20 species independent of species’ traits (realized thermal niche or migration behaviour), suggesting that even the warmest spring temperatures remained below the thermal optimum for reproduction, possibly due to our boreal study area being closer to the cold edge of all study species’ distributions. The result also suggests a lack of mismatch between the timing of breeding and peak availability of invertebrate food of the study species. Productivity was positively related to annual growth rates in long-distance migrants, but not in short-distance migrants. Across the 27-year study period, temporal trends in productivity were mostly absent. The population sizes of species with colder thermal niches had decreasing trends, which were not related to temperature responses or temporal trends in productivity. The positive connection between spring temperature and productivity suggests that climate warming has potential to increase the productivity in bird species in the boreal zone, at least in the short term."
47. Hillslope topography mediates spatial patterns of ecosystem sensitivity to climate
54. A unified framework of plant adaptive strategies to drought: crossing scales and disciplines
59. Highly dynamic wintering strategies in migratory geese: coping with environmental change
"Our findings demonstrate that individual winter strategies are very flexible and able to change over time, suggesting that phenotypic plasticity and cultural transmission are important drivers of strategy choice in this species. Growing benefits from exploratory behaviours, including the ability to track rapid land use changes, may ultimately result in increased resilience to global change."
Other Impacts
Other papers
64. Memory matters: A case for Granger causality in climate variability studies


=> Analysis: The climate papers most featured in the media in 2017
(Carbon Brief)
At least a few bad links with same error (such as #32 on moulins). My browser trys to connect to the link, fails, and then switches to 127.0.0.1 and displays the following message:
"Firefox can’t establish a connection to the server at 127.0.0.1"
Doing an IP lookup for that address yields:
"You have entered reserved IP Address 127.0.0.1 for private internet use and IP lookup for these will return no results."
In the "moulin" example, the fault appears to be with the paper's source Wiley's online library - and not Skeptical Science, because if I look up the paper's title in Google and click on that link, I get the same error.
Re: #1 Does replacing coal with wood lower CO2 emissions? Dynamic lifecycle analysis of wood energy: what about residues from trees that are harvested anyway for forest products? I believe less than 1/3 of the biomass makes it into forest products (i.e. tops and bottoms, bark, sawdust, other bits and pieces). What about fallen trees on the forest floor? What about grass? Algae? Municipal solid waste? Agricultural wastes? Some of all of the above could end up as fugitive methane. Advanced biofuels have a higher value than displacing coal (which other sources of energy can do nicely) – they can give us liquid fuels for transportation. Let’s not put all our eggs in the EV basket! Biomass can be the feed-stock for everything we currently get from oil and gas. That was my impression from reading Beyond Oil and Gas: The Methanol Economy (Aug 2011), by George A. Olah, Alain Goeppert and G.K Surya Prakash. To pre-empt someone saying there’s a mismatch in supply versus demand, I’d say that’s a strawman argument based on the all too frequently heard “all or nothing” mentality. On the contrary, surely any carbon neutral contribution can be worthwhile.
Imo biofuels have very limited application. Sometimes we get too focused on the science possibilities, and fail to do enough practical thinking. For example, to have any substantial impact, biofuels require a lot of land, and land is a scare resource. We have enormous pressure for food crops, grazing land, and forestry for building construction, and now also as a carbon sink.
It doesn't make a lot of sense turning crop lands into forestry plantations. Food crops are fundamental to humanity, and so will be prioritised, which is why it's so hard preserving what forests remain. It's sad to see degradation of the rainforests, and it should stop, but let's at least acknowledge why it happens.To think we can plant vast quantities of more forests seems very idealistic to me.
Replacing electricity generation with wood fired plant with biofuels doesn't make a lot of sense, when other totally clean alternatives now exist like wind and solar. Ditto biofuels for cars don't make a lot of sense, when electric cars are a now reality.
Imo the only application of biofuels that makes some degree of sense is 1)fuels for aircraft, because alternatives like electric powered aircraft are so challenging and 2) poor countries are better to burn wood than coal.
Signed, biofuels sceptic.
Planting corn (maize) for biofuels is also pretty dubious, unless its limited strictly for aircraft applications. In that case algae based biofuels would be ideal, as they don't encroach on food crop lands.
Xulonn, I just tried the #32 and it opened with no problem. Perhaps it was just a temporary problem. There has been some problems with opening Wiley papers recently, though.
John S@3,
Burning wood does not increase the carbon in the recycling surface environment the way that burning fossil fuels does. However, all results of the entire activity needs to be included in the evaluation. That would include the other pollution created when wood is burned. It would also include any pollution related to the building and production of competing renewable energy systems.
Other considerations would include the impacts of deforestation or impacts of renewable enegry systems on other life in the diverse web of life that humans have to sustainably fit in to in order to have a future.
Another consideraton regarding biomass is if it displaces food production. Using inedible vegitation from food production would be positive. Displacing food production to 'make energy' would be a negative.
Not sure where wood burning or biomass would end up in a comprehensive evaluation of true sustainability. It would probably be the winner in many locations.
The more important point is that evaluating the true sustainability of any human activity must be the basis for allowing it to be considered to be an acceptable participant in the games of competion to win popularity and profitability.
The failure to restrict what is allowed to compete for profitability and profitability undeniably leads to unsustainable and damaging activity Winning because of the 'competitive advantage of the cheaper and easier ways that can be gotten away with'.
Admittedly the current challenge is that people peceiving themselves to be the biggest Winners understand that they have the most to lose if what has incorrectly developed actually gets corrected. The faster the correction the more they lose. And of course those undeserving Winners stand to win more by fighting against any correction occurring in their wealth-pursuing lifetime that negatively affects their wealth-pursing opportunities.
In subject #1 I would take the emissions of kg CO2 per kWh of energy as the defining factor: (http://www.carbonindependent.org/sources_home_energy.html)
Coal : 3.62 kg CO2/kWh
NG : 0.203 kg CO2/kWh
Wood : 0.10 kg CO2/kWh
Bottled gas : 3.68 kg CO2/kWh
And given that most wood pellets for burning are made from what's left from the wood industry (Veneer, furniture,etc.) which otherwise would rot away, or does get burned in open air, the actual amount of additional CO2 is from fossil transport fuels. That could be lowered as well by using bio-fuels.
Additional, using gasification (solar heat assisted) between 20~40% of the energy value of the gas is from hydrogen split from water. Actual carbon related energy value (in case of coal gasification) is 60%~80% if compared with straight burning. In case of wood, with 47% carbon instead of 70%, the total amount of carbon related energy value is far lower.