Climate Science Glossary

Term Lookup

Enter a term in the search box to find its definition.

Settings

Use the controls in the far right panel to increase or decrease the number of terms automatically displayed (or to completely turn that feature off).

Term Lookup

Settings


All IPCC definitions taken from Climate Change 2007: The Physical Science Basis. Working Group I Contribution to the Fourth Assessment Report of the Intergovernmental Panel on Climate Change, Annex I, Glossary, pp. 941-954. Cambridge University Press.

Home Arguments Software Resources Comments The Consensus Project Translations About Support

Bluesky Facebook LinkedIn Mastodon MeWe

Twitter YouTube RSS Posts RSS Comments Email Subscribe


Climate's changed before
It's the sun
It's not bad
There is no consensus
It's cooling
Models are unreliable
Temp record is unreliable
Animals and plants can adapt
It hasn't warmed since 1998
Antarctica is gaining ice
View All Arguments...


Username
Password
New? Register here
Forgot your password?

Latest Posts

Archives

Review of Rough Winds: Extreme Weather and Climate Change by James Powell

Posted on 23 September 2011 by Anne-Marie Blackburn
Book cover for Rough WindsThe perennial question following any extreme weather event is whether climate change is responsible for the event in question. Until recently, the short answer to this question was 'No' but recent findings suggest that this answer needs to be refined. It is still not possible to state categorically that climate change has caused a specific event, and natural variability continues to play a key role in extreme weather. But climate change, through rising temperatures and water vapour levels for example, is changing the odds of extreme events occurring. The last couple of years have certainly seen a large number of extreme events take place, from the floods in Queensland, Colombia, Pakistan and Sri Lanka, to the droughts in Texas, Australia, China and the Amazon, and record-setting high temperatures in countries that cover approximately one-fifth of the Earth's surface. Wildfires, snowstorms, tornadoes and hurricanes have also made the headlines in a number of countries. This has led to the appearance of new expressions: 'global weirding' and 'a new normal'.

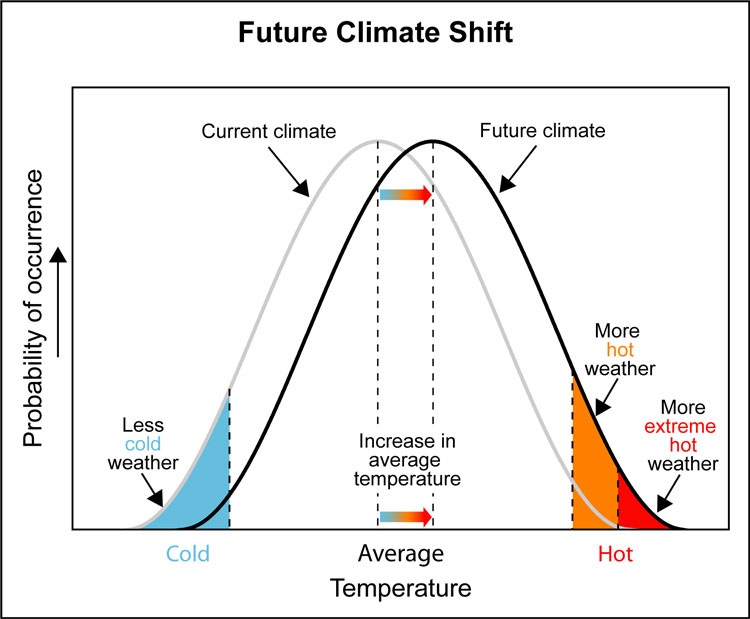
It is within this context that Dr James Powell, whose book 2084: An Oral History of the Great Warming is reviewed here, aims to find out whether there is now a 'preponderance of evidence' showing that climate change is truly under way, a situation which he argues warrants a response. He focuses on extreme weather for a number of reasons. Weather is what we experience on a daily basis and is therefore more tangible than some vague notion of climate change in distant countries or futures. Additionally, extreme weather can prove very costly in terms of lives, livelihoods and infrastructures, and we therefore all have a stake in taking preventative measures. Finally, and perhaps most importantly, increases in the occurrence of events such as extreme temperatures are the best harbingers of climate change. This is clearly illustrated in figure 1 below. With this in mind, the author frames the issue as one of risk management and compares it to the insurance industry: we take out insurance not because of a high probability of fire or burglary, but because we stand to lose a lot if we are uninsured and such an event takes place. Similarly, Powell argues, increasing and/or intensifying extreme events would require action to be taken - we should aim to 'avoid the unmanageable and manage the unavoidable'.
Climate shift

Figure 1: Bell curve showing how an increase in average temperatures leads to an increase in hot and extreme weather. Note also that this doesn't mean there'll be no more cold weather: these cold events will become rarer but will not disappear. Source: US Climate Change Science Program / Southwest Climate Change Network 

After providing some background on recent events in the prologue, the author explains the science behind climate change and its possible links with extreme weather. This is an important step as it begins to answer the question 'Why are scientists predicting that global warming will cause intensifying and/or increasing extreme weather events?' This then provides a platform from which to analyse and look at the specifics behind recent events. In doing this, Powell shows how science proceeds from a testable hypothesis whose basis, in this case, lies in basic physics: rising temperatures should lead to an increase in water vapour levels. In turn, this additional heat and moisture should provide the perfect setting for the development of more, and more intense, storms. And so the stage is set: the hypothesis and assumptions are described and the case can now be built block by block.

The book is then organised in short chapters that each tackle a specific event or related extreme weather events - heat, drought, fire, rain and snow, floods, tornadoes, and hurricanes. Powell is meticulous in his research and these chapters read like investigative reports, looking at events and placing them in their historical context, before looking at the evidence that helps determine whether climate change has played a role. And like all good scientific reviewers, the author is not afraid to discuss scientific uncertainties and diffculties which make attribution studies such a complex task. But this is more than a simple description of the mechanisms behind extreme weather. Powell discusses the resulting damage and suffering inherent to such events. This helps bring the message home: extreme events are more than abstract physical phenomena. They are some of the most destructive disasters than can hit you, and their toll can reach tens of thousands of deaths and billions of US dollars. If the overall impact of events paints a bleak picture, the personal stories are particularly harrowing. Unlike 2084, these are events which have already taken place and wreaked havoc on the lives and livelihoods of thousands of people. And Powell's personal account of the 1988 Yellowstone National Park fires somehow makes these events more tangible, particularly if you are lucky enough to never have faced such destructive forces.

Powell also addresses issues that have arisen, or could arise, from the responses and management of extreme events. For instance, the action taken by the Army Corps of Engineers to manage the 2011 Mississippi floods could have led to the river reverting to its alternate course, through the Atchafalaya Basin, an event which would have considerable impacts on downstream communities and shipping. Clearly, this did not happen this time, but should we run the risk of causing such a change again, or do we need to think of alternative solutions to manage future problems? Also, during the heatwaves in Europe (2003) and Russia (2010), people lost their lives because they did not know that they had to drink more water in warmer conditions or because they drowned after drinking alcohol. This clearly shows that simple measures, such as awareness campaigns, could yield significant results and allow us to protect ourselves against the worst effects of such events, which helps to address the issues behind 'managing the unavoidable'.

But the overall strength of his argument lies perhaps in the evaluation of predictions made by climate scientists. With rising water vapour levels now observed, is the expected increase in extreme precipitation events already noticeable? It appears so: analyses of US and northern hemisphere precipitation show just this. Similarly, changes in the timing of snow melt, and rising sea-surface and air temperatures have been implicated in wildfires, droughts and heatwaves. But at no point does Powell claim that climate change alone is responsible for all events in recent years. This is particularly true of tornadoes and hurricanes. Not only does he clearly state the uncertainties, he also points out other factors, such as river engineering projects, La Niña and forestry practices, that have played major, sometimes predominant, roles in some of the events he discusses. This is openness at its best, a way of pre-emptively answering those critics who tend to cherry-pick details and miss the whole picture when evaluating climate-related evidence.

So does Powell manage to answer the questions he sets out to answer, namely whether there is now a 'preponderance of evidence' that climate change is under way? He certainly makes his position clear: for him, there is already enough evidence to take action and prevent the worst from occurring. It is difficult to argue against this. Of course, extreme events have always occurred, without the help of humans, but it is the number of recent record-breaking events or worst events in decades that should make us stand up and take note. These come on top of trends that show rising global temperatures, melting Arctic sea ice, retreating glaciers, rising sea levels, and migrating species. All of this is consistent with what we expect from climate change. So do we now wait until we have absolute proof, which probably means leaving it too late to 'avoid the unmanageable', or do we start addressing the root cause of all these changes?

Rough Winds was released as a Kindle Single and is currently at #3 under Earth Science. The good news is that you don't need a Kindle to read it - you can download apps to read it on PC, Mac, iPhone/iPad and Android. With the Horn of Africa and Pakistan experiencing severe drought and floods, respectively, as well a new La Niña possibly on its way, this is a timely book that I thoroughly recommend.

Download Rough Winds from Amazon.

0 0

Printable Version  |  Link to this page

Comments

1  2  3  4  5  Next

Comments 1 to 50 out of 217:

  1. Pure happenstance I know, but ABC's Catalyst program had a segment on increases in extreme wind and waves last night.
    0 0
  2. The climate events described by Dr Powell are mild compared to what can - and should - be expected later this century.
    0 0
  3. Adelady, I caught that Catalyst episode more by accident than intention and thought it was quite interesting for it's relevance to ocean mixing as much as wave impacts on coastlines. IIUC much of the acceleration of Antarctic ice loss is attributed to warmer ocean temperatures eating away at the edges and reducing how much glacial flows are held back at those edges; would this data indicate the Southern Ocean would have less sea surface warming during summer (warmer surface water mixed deeper) and greater transport of heat out of the ocean during winter (colder surface water mixed deeper)? Presumably bigger waves impacting the Antarctic coast could also change the rates of ice shelf and glacial terminal disintegration both directly by wave energy and indirectly by more rapid mixing and circulation of melt and ocean water near to the coast. In any case the length of time the study covers could be too short to be more than suggestive of a solid trend of such impacts. It will be interesting to hear some reactions to this study.
    0 0
  4. I love the graphic - it reminded me of something... http://lazarus-on.blogspot.com/2011/01/what-is-one-degree.html Don't worry, I didn't try to copyright it. In fact I wish I could have stolen it for my own use.
    0 0
  5. The whole question 'what caused weather event XYZ' is inherently flawed. You'll frequently hear 'skeptics' claim things like, 'no it was not global warming, it was El Nino'... seemingly unaware that this claim is just as clearly false as blaming global warming alone would be. If the ENSO cycle were "responsible" for the recent Texas drought/wildfires, Mississippi flooding, hurricane Irene, massive tornadoes, et cetera (as many 'skeptics' confidently proclaim) then we would see these events during every ENSO cycle. We do not, because weather is never 'caused' by just one thing. The very concept of the 'butterfly effect' demonstrates this... it argues that in a chaotic system (like Earth's weather) small changes (like a butterfly displacing air by flapping its wings once) can cause large deviations (like a hurricane which would not otherwise have occurred). The aspect of the concept which many people seem to miss is that there are ALOT of butterflies in the world. Along with billions of other things which influence the weather. If a different butterfly on another continent gets hit by a car that could prevent the butterfly-hurricane from forming. Ditto a cloud drifting between the sun and an area of blacktop and thus preventing a thermal updraft from forming. Et cetera. ENSO, like global warming, just makes certain kinds of weather more likely. It does not 'cause' them entirely on its own any more than global warming does because all weather events are caused by the collective action of billions of factors. That being said, global warming has changed the climate of the entire planet. Some butterflies which would not be alive had AGW not taken place are... others have died because of AGW. Evaporation, clouds, precipitation, albedo, and dozens of other factors have changed the world over. Thus, it could be reasonably said that ALL weather we see now is due to global warming. It is all an aspect of the current climate, which has been changed by AGW. Thus, I can guarantee that if the past 150 years or so of global warming had not taken place Hurricane Irene would not have happened exactly the way it did. It could have been nice and sunny... or there could have been an even worse storm, but that exact weather event would not have taken place. Far too many of the 'butterflies' which contributed to the way it played out were changed by AGW. So really, as the article above also notes, the only meaningful metric of the 'effect' of global warming (or ENSO) on the weather is a change in frequency of various types of events.
    0 0
  6. Well said CB. The Current Texas drought is ocurring during a La Nina. Previous La Ninas have not resulted in drought, however, the worst droughts have all occurred during La Ninas. Therefore, I would agree with your statement about this weather event being more likely, but not caused by La Nina. Similary, La Nina enhances Atlantic hurricanes, but SST, the jet stream, wind shear and other weather systems all combined to influence Irene. Individual weather events are the result of several factors acting together. While the temperature of the planet has changed over the past 150 years, I am not sure we can say that the climate has changed. This may be more an issue of semantics, but the majority of the world has only experienced minor temperature and precipitation changes. Temperate regions are still temperate, semi-arid are still semi-arid, polar, etc. I firmly believe that there is a big difference between an increased likelihood of certain weather events, and global climate change.
    0 0
  7. 6, Jonathon,
    I am not sure we can say that the climate has changed.
    Yes, and no. We cannot say the climate has changed yet. That's the whole point. If we wait that long, it's game over. But it is in the process of changing and we know that on our current course it will change. We can certainly say the climate is changing. The number of extreme events and the extremity of those events has certainly increased. Other observations, such as the loss of ice mass in Greenland and Antarctica, the retreat of glaciers, earlier springs, and many others all emphatically demonstrate that the climate is in fact changing. Your premise that it has not changed yet is a strawman. Similarly, your later implication that climate change be defined as the wholesale conversion of entire ecosystems ("Temperate regions are still temperate, semi-arid are still semi-arid, polar, etc.") is another strawman. If you think that such dramatic and unassailable changes are the only things that will affect the future of mankind, you are in for a shock.
    0 0
  8. Sphaerica, For some reason, you seem to like strawmen. I do not know what implications they have. As I mentioned earlier, it may be more a matter of semantics, but your observation list is not examples of a changing climate, but simply, a temperature increase (by the way, Antarctic ice mass is relatively stable). Finially, if climate change does not refer to a wholesale conversion, then it is nothing more than a temperature change. Is the climate really different if spring arrives a week (or two) earlier, more rain and less snow falls, and temperatures are higher?
    0 0
  9. Jonathan - For your reference, a Strawman Argument is a logical fallacy where one argues against a distorted, exaggerated or misrepresented version of someones position, rather than their actual position. As a logical fallacy, it proves exactly nothing. Antarctic ice is not stable at all - while sea ice has increased a bit, land ice is decreasing at a considerable rate. Your statement is flatly wrong. "...if climate change does not refer to a wholesale conversion, then it is nothing more than a temperature change. Is the climate really different if spring arrives a week (or two) earlier, more rain and less snow falls, and temperatures are higher?" Absolutely yes. Even a slight temperature change can change rainfall patterns, melt polar ice, alter the crops that can be grown in a particular region, shift pests into areas that never had them before, and lead to multiple species extinction as habitats go away. I find that last paragraph of yours rather astoundingly wrong.
    0 0
  10. KR, First off, Antarctic ice is not decreasing at a considerable rate. In fact, the change in mass does not exceed the measurement uncertainties. http://www.springerlink.com/content/9k58637p80534284/ I find your last paragraph somewhat confusing. First, you agree with me (absolutely yes), then you say that I am astoundingly wrong. All this, while you seem to agree with my position about what constitutes a climate change. [inflamatory deleted]
    0 0
    Moderator Response: [Dikran Marsupial] Please keep the discussion civil.
  11. Jonathan - the "Absolutely yes" in my reply was to "is the climate really different". I found your "nothing more than a temperature change" the odd part of that paragraph. A temperature change is a climate change, affecting weather, plant life, sea level, etc. My apologies if that was unclear. Did you follow the Antarctica link I provided? Did you see Fig. 2, where an entire group of studies show a high rate of mass loss, a factor more than 5x higher than the study you point to? I believe that the weight of evidence (so to speak) points in the direction of significant Antarctic mass loss, although you have found a (single) study that disagrees.
    0 0
  12. Another serendipity moment. CSIRO has just released results showing that wind speeds across Australia have increased by 14%. Media release And for the Antarctic, this item is on deep ocean heating but there's a lot of Antarctic info in the second half of the article.
    0 0
  13. The climate shift diagram is a little simplistic, as it shows globally-averaged temperatures. In the case of the UK, for instance, global warming is tending to change air patterns so that we've been experiencing record cold spells in the winter. This is because the change in climate, certainly over the last few years, has been tending to push Arctic air further south than historically has been the norm. I only mention this because anyone reading the book might think that increases in extreme weather will always tend to be at the warmer end of the scale and -- if they are so minded -- therefore claim that an increase in extreme cold events experienced locally proves climate change to be a hoax. So there's a danger in over simplification. We need to be careful what predictions we make.
    0 0
  14. John R#13: "climate shift diagram is a little simplistic" Of course it is; this is a book for a general audience. But this story is entirely consistent with what some are calling 'rolling 13s' - a pair of normal dice gives 2-12; we're seeing that nature has new and different dice. Here's a cogent summary statement from Michael Tobis' analysis of the Texas drought report by John N-G: Climate characterizes the statistics of weather and the statistical bounds of weather. If we start seeing weather patterns change, that can indicate a change in climate. The question is all about how likely it is that this weather would occur if the statistical parameters of the climate were held fixed as it has been since instrumental records began, say. If weather like this is sufficiently unlikely under our previous understanding of regional climate, it may be (a piece of) evidence that the climate is itself experiencing a dislocation. There are new normals; get used to them.
    0 0
  15. muoncounter @14 From other places you have posted I believe you are a teacher or college professor who lives in Texas. Here is an interesting link to Texas climate. Historical and Current Texas Weather Patterns. Some interesting points is that droughts have been less intense, on average after 1960. Last year and this year have been very bad for Texas but not unusual. Also in this document they have an interesting page with Texas Hurricane History. In the first graph they have hurricanes from 1950 to 2000. This is a 50 year period and the trend is up. Many may conclude that hurricanes are increasing and then link it to global warming. Then the next graph is Texas hurricanes from 1850 to 2000. Now the trend line is down. Maybe the author is trying to point out that weather trends are not that meaningful in trying to determine the future. This sample shows that 50 years has one trend, 150 years has the opposite trend. Who knows maybe 500 years and you have another postive trend and then go back 1000 and it is negative again. Also look at the rain and temperature graphs at the start of the document.
    0 0
  16. @muoncounter #15 writes: "There are new normals; get used to them." No need to be aggressive. Is that how you talk to your students (assuming that Norman is right about your profession)? That there are 'new normals' is exactly the point I was making. It's just that in some places, like the UK, our 'new normal' seems to be cool, wet summers and really cold spells in winter (-15C) -- which makes it difficult for me to convince the 'general audience' (that you say the book is aimed at) that global warming is real. You don't have to explain it to me, mate -- I get it. I know several people who I call 'on the sceptic side of don't know' who have been to SkS on my suggestion and asked a few innocent questions. Some of them (admittedly those with a tendency to the devil's advocate approach) have come away with a negative opinion about the site and therefore have been pushed further towards denial. Which makes my job harder as a climate communicator. That does not mean they've all had this experience, some have suddenly 'got it'. All questions should be answered in ways that does not belittle the genuine student. Your last line was a put down and was unnecessary.
    0 0
  17. John Russell, I live in the UK and am a keen cricketer and I can tell you that cool wet summers are not the "new normal". We (the team I play for) isn't loosing any more games to the weather than it used to. Summers in the UK are notoriously variable and they are little different to how they have been for the last 20 years or so. The difference is that more fuss is made of it than there used to be. Cold spells in the winter are also nothing new. IIRC the U.K. is a rather bad place to look for evidence of climate change or extremes; we are buffered to a large extent by the Atlantic ocean and our weather is changable because it depends so strongly on regional atmospheric circulation. If from the west it is wet an cool in the summer, wet an mild in the winter; if from the east it is dry and hot in the summer, dry and cold in the winter. The only new thing is there being a possible increase in weather from the north in winter, due to blocking, but the evidence for that is fairly weak AFAICS. All just IMHO of course.
    0 0
  18. @Dikran Here in the SW of the UK, we've not had a good summer for the last four years. Instead we've had a lot of rain and it's been very difficult to find a slot for bringing in the hay. Because I grow trees on a large scale, the state of the ground is very high on my radar and it's been on the whole much wetter that it was a few years ago. I accept that in some areas of the UK, say the SE, that's not been the case and certainly a farming colleague in East Anglia has been moaning about drought. As far as the winters go, since the cold spells of my childhood in the 50s and 60s, as you know, winters have on the whole been very mild. Until 2 years ago most people under, say, 40 had not experienced snow drifts that come up to your waist. Most snowfalls in the south of the country seemed to melt within a day or so. The last two winters however have shown us how cold it can get and have caught many people out as they didn't consider it normal (ask your plumber!). You'll be aware that denialist writers like Delingpole and Booker have been making hay with this in the popular press, and will probably do so again this winter. Note that overall I'm talking about perception rather than the facts. I'm well aware that, considered annually, our average temperatures have been slowly rising: but that's not what people notice -- they don't experience weather through a thermometer. In this situation convincing some people that global warming is real, based on their experiences, can be difficult in the UK -- that's why the concept of climate change, with its redistribution of weather patterns, is the idea to push in the UK. I'm sure a shift towards higher temperatures (as illustrated by the temperature 'shift' bell curve) is probably a lot easier to sell in the US and Oz.
    0 0
  19. Dikran/John I also live in the UK. I agree that one might not perceive much in the way of temperature change in relation to our notoriously variable summers (the one just past being pretty pathetic warmth/sunshine-wise, 'though we did have a fantastic summer in March-April!). However the earlier onset of Spring is quite noticable on a personal level, and I believe that what I perceive to be an increase in extreme rainfall events is a reflection of real changes in rainfall (increased during Autumn and Winter) that are consistent with expected global changes in precipitation regimes in a warming world. Likewise at a personal level I am aware of the problems in Scotlands skiing industry over the last 25 years with Glencoe shutting down, Glenshee being put up for sale and Cairngorm being taken into public ownership and skier days plummeting in the last 20 years ('though again 2008-2009/10 were very good years snow-wise in Scotland!), and am concerned about global warming related effects on the ecology of some unique habitats e.g. the Cairngorms, etc. Obviously some of these problems are exacerbated by non-climatic factors (continued paving/cementing over of urban centres reducing soil absorption of rainwater; tendency for skiers to head for more glamerous locales). But global-warming related impacts are already occurring and will undeniably bite deeper. Whether that's going to have much of an impact on our unreliable summers is a moot point!
    0 0
  20. Chris, I agree with everything you say. And I don't really disagree with anything Dikran says -- or muoncounter for that matter. The problem I was addressing -- based on the subject of the post -- is in explaining climate change to people in the UK who do not perceive themselves to be experiencing extreme weather: and what they are experiencing seems not to be connected with 'warming'. Now, if they were in Texas, it might be more obvious.
    0 0
  21. Norman#15: "an interesting link to Texas climate. " This graphic produced by Texas' state climatologist, John Nielsen-Gammon is very relevant here: It's easy to say that the big red dot (2011's hot and dry weather) is exceptionally odd. But note the years 2006, 2007, 2008, 2009, 2010 and 2011 are all above the curve, with 2004 and 2005 on it. That is starting to scare people, including the same John NG, who doesn't see it ending any time soon: ... we have heightened drought susceptibility during this period, and, according to some studies, the effect of La Niña is likely to be amplified. So this coming year looks very likely to be another dry one, and consequently it is very likely that next summer will have water shortages and drought problems even more severe than this summer. That's what I take the concept of a 'new normal' to signify: Higher probabilities of 'extreme,' 'severe,' 'more intense,' 'never been like this,' etc. But I find it unreasonable to believe that everyone, everywhere will be seeing the same warmer, drier summers at the same time: I'd love to know where that idea got started. My suspicions are that oversimpliers gave the suggestion and deniersphere picked it up with ignorance like this. I apologize to John R and any others who took exception to my brusque turn of phrase, but if a certain governor gets his party's nomination next year, ya'll will be hearin' a lot more of that.
    0 0
  22. chris, the first thing that people need is to change the reference from 'global warming' to climate ... 'change' or 'disruption' or, for the unlucky ones in some places at the wrong times, 'crisis'. I know that it is global warming, but as soon as people start thinking about themselves or their own location, they drop the 'global' without even noticing. As for Britain's last 2 winters. Those cold winters, below 71-2000 average for temperature, were both accompanied by above average hours of sunlight and below average rainfall. No idea if those things are significant. As for your 'unreliable summers', I remember reading a gardening magazine a few years ago talking about growing some plant or other which grew a lot better with England's consistent rainfall than Oz's long, dry, hot periods. They referred to England's "terrible weather but wonderful climate" for gardeners.
    0 0
  23. John Russell that is pretty much why "climate change" is a more accurate term than "global warming". Physics sas the globe will warm on average as a result of increasing atmospheric CO2, but that doesn't mean it will warm uniformly everywhere, or that there won't be anywhere tht cools rather than warms. The thing to do is point them toward the regional projections for Europe in the IPCC reports, which suggests that the U.K. is somewhere where it is unlikely to see that much warming. I can't remember what it says about extremes or precipitation off-hand. I'd also point out that internal variability (i.e. weather) is increasingly dominant over short timescales and on small spatial scales, so weather over a decade or two in the U.K. (which is tiny) says virtually nothing about climate, changing or not. It's good we are in basic agreement though, it would be nice if there were more of that generally! ;o)
    0 0
  24. 15, Norman, It is very important to note that the current warming trend only covers the last three bars (out of sixteen) in that 1850-2000 bar graph, and of those, only that last 1 or 2 demonstrate enough warming to tease out a climate change impact. As such, I find the reference of no value whatsoever. A proper verbal interpretation of the graph would say "the overall trend for the period prior to the impact of anthropogenic climate change is downward, but there is not yet enough data to determine if the 'climate change tail' will be definitively upward -- i.e. yet another hockey stick."
    0 0
  25. Another relevant graphic is Fig 2.4 in 'Degrees of Risk.' This suggests that rather than the simple linear shift to the right of the symmetric probability curve shown in Fig 1 above, we may see a flattening and broadening of the probability spectrum, shapes better represented by Poisson distributions: Along the horizontal axis, plot a 'severity' index; the vertical is probability of occurrence. The m=0.5 curve might represent historic conditions; m=1 or 2 or 4 might be where we are heading. By flattening the distribution, extreme events start showing up under the long tail to the right. That doesn't mean that everyone sees the same extremes; it simply means there are more possibilities. The metaphor of 'rolling 13s' is a very good one.
    0 0
  26. #25, muoncounter, I agree with your assessment that the shift of the distribution is an oversimplification. My argument has always been that the shape of the distribution is a function of climate change and local weather. For example we could see large changes in the shape and position of the distribution of precip and temp in Alaska but not much in San Diego (perhaps only a small shift). Your link however doesn't seem to contain to the graphic you show. In fact, the full report http://goo.gl/KLpwL shows the shifted distribution in fig 6.4
    0 0
  27. Eric#26: Thank you. I meant to link to the full report. A similar figure is at the end of the Gulledge presentation.
    0 0
  28. muoncounter @21 "That is starting to scare people, including the same John NG, who doesn't see it ending any time soon:" I would suggest John NG look at the annual temperature graphs of Texas that were provided by Jeffrey Lindner in the link I posted at #15. If you look at the annual temp graph then people must have been really scared from 1920 to 1940. Your graph is only of summer temps, the overall annual temps in 2007 and 2010 were below the normal temp line.
    0 0
  29. I do have a question about the graph in the article titled "Future Climate Shift". I do not know if it is a correct assumption (logic can be perfect but if the assumption is not correct, perfect logic will not lead to the correct answer). The author of the graph is making the assumption that heat waves are a random fluctuation of weather patterns (in order to get a bell curve you need random sampling). The problem with this is that heat waves, monsoon rains and other weather phenomena are not random noise in the variables of heat, humidity, etc. They are not like waves in the ocean. They are organized patterns that persist over time. The current Texas heat wave and drought is caused by a High pressure ridge aloft (similar to what happened in Russia last year). A warmer world does not necessarily lead to more extreme heat wave events. The only way Global warming would create more heat waves (as implied by the graph) would be if the increase in heat content of the atmposphere would cause more blocking highs. I have not seen this demonstrated yet on this thread or the others where this topic has been brought up. If one would conclusively prove that a warmer earth would develop more blocking highs (which cause heat waves and droughts) then I would consider this a valid argument. Showing a bell curve and forming this conclusion is not based upon the mechanisms that are responsible for heat waves and droughts. They are not random events that respond to bell curve descriptions.
    0 0
  30. Sphaerica @24 In post #7 you state "We can certainly say the climate is changing. The number of extreme events and the extremity of those events has certainly increased." In post #24 you state "A proper verbal interpretation of the graph would say "the overall trend for the period prior to the impact of anthropogenic climate change is downward, but there is not yet enough data to determine if the 'climate change tail' will be definitively upward -- i.e. yet another hockey stick." My position on this topic is that there is not enough data to make a declaration of certainty on the topic. I think earlier data on severe weather events was not as fully reported as today. I do not think there is adequate accounting of severe weather events to take a strong position that the number and intenstiy of severe weather events has certainly increased. I am not stating it has not. I am making the case that there is not enough good reliable data to make any claim of certainty on this issue at this time and we may not know for many more years. Your contention is that if we wait to see if it is getting worse, it might just be too late. I just wish on these threads that more mechanisms would be developed to demonstrate how global warming will create more severe weather. If someone could demonstrate how global warming will create more blocking patterns, or hurricanes, or tornadoes or floods I would maybe share the certainty you have that things are getting worse weatherwise.
    0 0
  31. #29, Norman. Think of it as a notional graph- a graph of temperature "events" in multiple locations compared to the baseline for those locations. The daily average, low and high could all be considered events. The PDF of events would be normally distributed as shown given a sufficient number of locations. With "climate change" the PDF would probably shift right and flatten out as depicted by muoncounter above (note that the PDF is still in comparison to the pre-CC baseline). I disagree a bit though, I think the right tail will be truncated somewhat by physical limits imposed by the initiation of convection.
    0 0
  32. #30, Norman: there are threads about extreme event causation from time to time: e.g. /extreme-weather-global-warming.htm Some other promising threads devolved into debates about insurance company record keeping.
    0 0
  33. muoncounter Here is an article that figures out how much of the Texas drought of 2011 was a result of global warming. "I think we’re pretty close now. This record-setting summer was 5.4 F above average. The lack of precipitation accounts for 4.0 F, greenhouse gases global warming [edited 9/11/11] accounts for another 0.9 F, and the AMO accounts for another 0.3 F. Note that there’s uncertainty with all those numbers, and I have only made the crudest attempts at quantifying the uncertainty. But this will do until something better comes along. (Also note that the AMO index is not, strictly speaking, independent of the global mean temperature, but the AMO trend since 1900 is weak so any double-counting here is very small. [edits 9/11/11]) Link to article of the above quote.
    0 0
  34. Eric (skeptic) @ 32, Thanks for the link, I have already been there and posted on this thread and it does not explain much. A warmer atmosphere can hold more water vapor, yes. Does that mean it will increase rain? Might but it would not have to. It can hold more water vapor does not mean more rain will fall. "Atmospheric blocking leads to a stagnation of weather patterns. As you are well aware, atmospheric patterns tend to repeat themselves. In the case of blocking, the same pattern repeats for several days to even weeks. This can lead to flooding, drought, above normal temperatures, below normal temperatures and other weather extremes. It is important to recognize a blocking pattern in its initial development. With this awareness, you will be able to forecast out to several days in advance with a high degree of accuracy." Source of above quote. Droughts, floods and heat waves are not a random fluctuation anywhere on the earth. They are created by known weather patterns. A blocking system is responsible for many of the extreme long-term weather disasters. In order to link Global Warming to these extremes, it would be necessary to create a physical mechanism where global warming will increase the number and intensity of these blocking systems. It there is no mechanism found then stating extreme weather events are like loaded dice is an incorrect view because there is nothing random about them. I am still looking for such a link but have not yet found one.
    0 0
  35. 34, Norman,
    I just wish on these threads that more mechanisms would be developed to demonstrate how global warming will create more severe weather.
    Did you consider buying and reading the book that is the subject of this post? If not, why not?
    0 0
  36. I don't have a Kindle or Kindle SW. Has anyone used Kindle SW on a Mac or PC and found it useable and useful?
    0 0
    Moderator Response:

    [DB] I use my Kindle to store PDFs of science papers from my PC.  Works well for travel and camping trips.

    [grypo] Kindle for PC works well. Kindle also offers apps for most smartphone OS (iOS, Android, etc)
  37. Norman#34: "stating extreme weather events are like loaded dice is an incorrect view" Norman, its a metaphor. When the expected range is 2-12 and 13s start popping up, the dice aren't loaded; there's a die with a 7 on it. Dr. Tobis says this best: A truly bizarre season occurs in a particular place. Either these extraordinary events are connected, which is perhaps unlikely, or they are unconnected, which is extremely unlikely. That is, you are asking for a bizarre coincidence. But now we add up the number of bizarre coincidences, for each of which John [Nielson-Gammon] can make comparable arguments. The tornado outbreak this spring. The huge blocking event in Asia last summer which did so much damage in central Russia, Pakistan, and parts of China. The fires in Australia in 2009 and the floods this year. The floods in the midwest. Heat waves in Europe. None of these are clearly part of local trends. None of these are particularly predicted in the literature, and as far as I know the GCMs don't indicate these things happening. But, here's the thing. They are happening.
    0 0
  38. Norman One thing I find interesting about your approach to the possible link between climate change and extreme weather is the very narrow way in which you think climate change can affect extreme weather. You say that many extreme events are caused by blocking events. This is correct, but many are not linked to blocking events. So I really don't think is a valid premise to start with, and I've not seen any scientist claim that this is the only way to determine the link we're trying to establish. Also, let's say, hypothetically, that a blocking event is purely natural in cause, how can you show that greater temperatures or water vapour levels brought on by climate change are not going to have an impact on a drought or flood caused by that blocking event, for example? What mechanism do you suggest nullifies the role of climate change in extreme weather when a blocking event is involved?
    0 0
  39. Anne-Marie Blackburn @38, In my post to muoncounter at #33 I link to an artice that does go into the effect of Global Warming on the Texas drought. His conclusion is about 0.9F of the total 5.4F above normal for the Texas summer.
    0 0
  40. Schaerica #35 Good point, I am considering buying and reading the book at this time after your post. Maybe it will answer the questions I have.
    0 0
  41. muoncounter @37 I will post the link again for ease. (it is also at post 15). Historical Texas climate. Look at the Texas annual precipitation graph. Any one season can be extreme and has been. Look at the preciptiation for Texas in 1917. It is several inches below the normal. Then two years later it is several inches above the normal. The severe weather phenomena makes me think of selective perception. Looking at the highly varialbe nature of temperature and precipitation in the state of Texas over a 100 year period, I think it would be a safe assumption to expect this of any location. So if the globe is your area of selection, you will certainly be able to find extreme events in some location on the globe every year. Looking at Texas overall I can't see any clear link that precipitation or temperature of the last decade are anywhere outside the long term events. If some meteorlogist took the time and made such graphs of other locations would it look much different? If Texas data is a sample of what goes on around the globe, from the available graphs I can't see how anyone could conclude "global weirding" or "the new normal" Look at the preciptiation amounts before 1960 and after and please explain where is the evidence Texas droughts are getting worse?
    0 0
  42. Norman#41: "some meteorlogist took the time and made such graphs of other locations would it look much different?" Short answer, yes. Look again at this graph. Then look at this map: That's a twelve month period with precipitation below 60% of a 50 year average. We're way out of normal bounds here. Not the new normal? That is a measurable event, based on 30 year averages -- in other words, a climate change. Look back at any of our extreme weather threads; read just the April recap of Jeff Masters' blog. I've suggested this before: keep a list of the number of things you have to explain away as 'a normal event.' Or you can content yourself with the warm feeling that all we ever see is weather and thus climate change is always Mañana.
    0 0
  43. muoncounter @42 From your Jeff Masters link. Link to graph of Texas March drought index. If you look at this graph you can see about 8 years that were exceptional droughts (-4) before 1960 and there were none after 1960 except for this year. Around 1920 you had one year that was a drought in the -6 level and a few years later it was above 6+. From the drought index chart it would seem that there are very few years that are normal. Normal is a data point between extremes.
    0 0
  44. Norman, refer back to John Nielson-Gammon's graph. Would you call 2011 'normal' for Texas. It's set new records for temperature as well as drought, and is far from the previous distribution of such events. See Tamino's take on it as well. While annual Texas temperatures may not have much trend, summer temperatures do. Which ones do you think matter more for extremes? It reminds me of the way that in the UK, we had the hottest April ever, beating the previous clear record-holder, 2007, into second-place. Remember that? Thought not. Of course, in UK April hot dry weather means nothing more than some pleasant evenings and a few (occasionally quite damaging) wildfires. It's not headline-making in the way that the large amounts of snow in the last few winters (without significant temperature records) has been, and it's not a headline-making record-breaking heatwave like the same weather in July would inevitably cause. It's still extreme weather. A lot of British weather opinion has been linked to the perceived cold wet summers (I think I would agree with that for the last five years or so), and the extreme snowfalls. Less has been made of the extreme floods that we've seen (e.g. Cumbria and Gloucestershire), or the general patterns of extreme precipitation. I remain interested in the link between reduced Arctic sea ice and early winter snowfalls - if true we should see more of that. Extremes come in many guises, but they are not very likely unless something is forcing the climate system out of its normal state. In the UK and worldwide we're seeing a lot of extremes. Norman, as an aside, an interesting link between blocking events and global warming comes from Stu Ostro (very large presentation), but then I've linked that to you before. He sees a link between blocking, extreme weather and climate change.
    0 0
  45. skywatcher#44: "a link between blocking, extreme weather and climate change. " How could there not be a link? We've had this back and forth before. 'Blocking' is a weather pattern; saying 'this drought is caused by blocking' is a bit like saying 'it's a drought because there hasn't been any rain.' But no blocking system has been in place for a year, as indicated by the map here. Norman's thesis appears to be 'yeah, but this has all happened before.' 'This' being drought, heatwave, flooding, windstorms, tornadoes, etc. Until it literally starts raining cats and dogs, he's right. Its just that the list of 'yeah, buts' keeps getting longer.
    0 0
  46. muoncounter, exactly! Particular types of weather events lend themselves to generating unusual or extreme weather. 'Blocking' patterns are one of those kinds of weather events, that can lead to prolonged dry or wet in particular regions. Except now, blocking events are often leading to 'extreme', rather than just 'unusual'. Extremes that are as you would expect with a warmer atmosphere that can hold more water vapour. And Norman's wrong, it's very obvious that the intensity of this year's Texas drought and summer heatwave has not happened before, shown by you in John N-G's graph (#21). His response was to say "look at the annual temperatures", an obvious diversionary tactic from the uncomfortable fact of this year's heat and dry in Texas' summer, part of a summer trend, shown by Tamino.
    0 0
  47. 45, muoncounter, I've done an extensive search of the literature, and can find no definitive link between climate change and feline-canine precipitation. I'm afraid this is just evidence of more unsubstantiated alarmism on your part.
    0 0
  48. Sphaerica#47, Ha! There is documentary evidence. No trend though. At least no one will blame this on cosmic rays. Sorry, upon closer inspection, there do not appear to be any dogs involved. Just raining cats and pitchforks.
    0 0
  49. "An analysis of Texas statewide tree-ring records dating back to 1550 indicates that the summer 2011 drought in Texas is matched by only one summer (1789) in the 429-year tree-ring record, indicating that the summer 2011 drought appears to be unusual even in the context of the multi-century tree-ring record."
    http://www.ncdc.noaa.gov/sotc/national/2011/8 Claims of "not happened before" should be qualified with the period of record being used. There's no doubt that the drought is unusual in the largest context available.
    0 0
  50. With regard to the Texas drought, I have been working on the following adaption of Tamino's graph: It is the same as Tamino's graph, showing post 2000 years circles red. What I have added is the six strongest La Nina events since 1949 colour coded to match this graph: The 2008/9 La Nina is coded grey for clarity. Data for the MEI index is here: http://www.esrl.noaa.gov/psd/enso/mei/table.html Texas Summer climate data is here (Temp/Precipitation): http://www.ncdc.noaa.gov/temp-and-precip/time-series/index.php?parameter=tmp&month=8&year=2011&filter=3&state=41&div=0 http://www.ncdc.noaa.gov/temp-and-precip/time-series/index.php?parameter=pcp&month=8&year=2011&filter=3&state=41&div=0 What's the point? I keep on hearing the refrain - "It's La Nina" or "It's El Nino" for every extreme climate event that happens. In the case of Texas droughts, the culprit is supposed to by La Nina. The graph shows that this explanation simply does not pass muster. Pre 2000, La Nina's are typically cooler than the average, and neither unusually wet or unusually dry. The '74, '75 La Nina, as strong as that of 2011 show values of 8.82", 80 degrees F, and 8.89", 79.4 degrees F respectively. In other words the last La Nina as strong as that of 2011 was cool, and wet in Texas. 2011 is clearly not just what happens in La Nina years in Texas. In contrast to ENSO, the grouping of all years since 2000 on or above the red line is highly suggestive. If we treated them as "the new normal", 2011 would still be unusually dry and hot, but not exceptionally so.
    0 0

1  2  3  4  5  Next

You need to be logged in to post a comment. Login via the left margin or if you're new, register here.


The Consensus Project Website

THE ESCALATOR

(free to republish)


© Copyright 2024 John Cook
Home | Translations | About Us | Privacy | Contact Us