Climate Science Glossary

Term Lookup

Enter a term in the search box to find its definition.

Settings

Use the controls in the far right panel to increase or decrease the number of terms automatically displayed (or to completely turn that feature off).

Term Lookup

Settings


All IPCC definitions taken from Climate Change 2007: The Physical Science Basis. Working Group I Contribution to the Fourth Assessment Report of the Intergovernmental Panel on Climate Change, Annex I, Glossary, pp. 941-954. Cambridge University Press.

Home Arguments Software Resources Comments The Consensus Project Translations About Support

Bluesky Facebook LinkedIn Mastodon MeWe

Twitter YouTube RSS Posts RSS Comments Email Subscribe


Climate's changed before
It's the sun
It's not bad
There is no consensus
It's cooling
Models are unreliable
Temp record is unreliable
Animals and plants can adapt
It hasn't warmed since 1998
Antarctica is gaining ice
View All Arguments...


Username
Password
New? Register here
Forgot your password?

Latest Posts

Archives

Review of Rough Winds: Extreme Weather and Climate Change by James Powell

Posted on 23 September 2011 by Anne-Marie Blackburn
Book cover for Rough WindsThe perennial question following any extreme weather event is whether climate change is responsible for the event in question. Until recently, the short answer to this question was 'No' but recent findings suggest that this answer needs to be refined. It is still not possible to state categorically that climate change has caused a specific event, and natural variability continues to play a key role in extreme weather. But climate change, through rising temperatures and water vapour levels for example, is changing the odds of extreme events occurring. The last couple of years have certainly seen a large number of extreme events take place, from the floods in Queensland, Colombia, Pakistan and Sri Lanka, to the droughts in Texas, Australia, China and the Amazon, and record-setting high temperatures in countries that cover approximately one-fifth of the Earth's surface. Wildfires, snowstorms, tornadoes and hurricanes have also made the headlines in a number of countries. This has led to the appearance of new expressions: 'global weirding' and 'a new normal'.

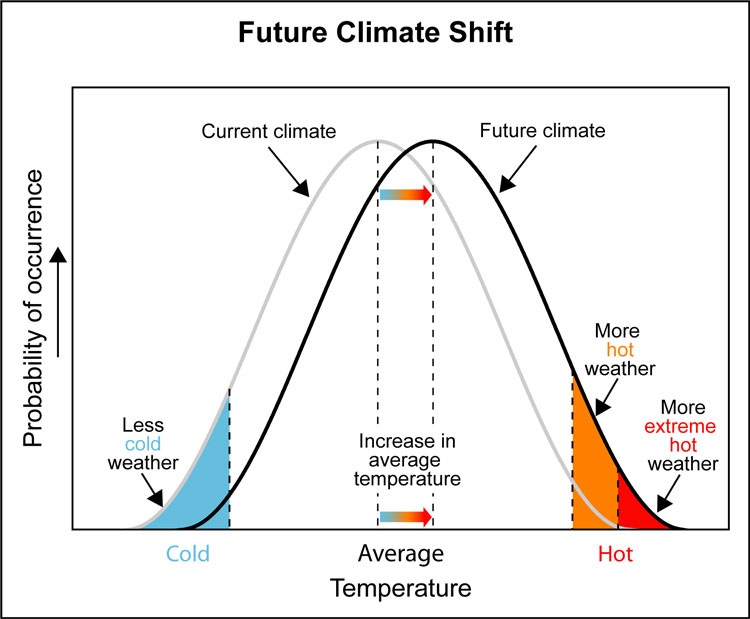
It is within this context that Dr James Powell, whose book 2084: An Oral History of the Great Warming is reviewed here, aims to find out whether there is now a 'preponderance of evidence' showing that climate change is truly under way, a situation which he argues warrants a response. He focuses on extreme weather for a number of reasons. Weather is what we experience on a daily basis and is therefore more tangible than some vague notion of climate change in distant countries or futures. Additionally, extreme weather can prove very costly in terms of lives, livelihoods and infrastructures, and we therefore all have a stake in taking preventative measures. Finally, and perhaps most importantly, increases in the occurrence of events such as extreme temperatures are the best harbingers of climate change. This is clearly illustrated in figure 1 below. With this in mind, the author frames the issue as one of risk management and compares it to the insurance industry: we take out insurance not because of a high probability of fire or burglary, but because we stand to lose a lot if we are uninsured and such an event takes place. Similarly, Powell argues, increasing and/or intensifying extreme events would require action to be taken - we should aim to 'avoid the unmanageable and manage the unavoidable'.
Climate shift

Figure 1: Bell curve showing how an increase in average temperatures leads to an increase in hot and extreme weather. Note also that this doesn't mean there'll be no more cold weather: these cold events will become rarer but will not disappear. Source: US Climate Change Science Program / Southwest Climate Change Network 

After providing some background on recent events in the prologue, the author explains the science behind climate change and its possible links with extreme weather. This is an important step as it begins to answer the question 'Why are scientists predicting that global warming will cause intensifying and/or increasing extreme weather events?' This then provides a platform from which to analyse and look at the specifics behind recent events. In doing this, Powell shows how science proceeds from a testable hypothesis whose basis, in this case, lies in basic physics: rising temperatures should lead to an increase in water vapour levels. In turn, this additional heat and moisture should provide the perfect setting for the development of more, and more intense, storms. And so the stage is set: the hypothesis and assumptions are described and the case can now be built block by block.

The book is then organised in short chapters that each tackle a specific event or related extreme weather events - heat, drought, fire, rain and snow, floods, tornadoes, and hurricanes. Powell is meticulous in his research and these chapters read like investigative reports, looking at events and placing them in their historical context, before looking at the evidence that helps determine whether climate change has played a role. And like all good scientific reviewers, the author is not afraid to discuss scientific uncertainties and diffculties which make attribution studies such a complex task. But this is more than a simple description of the mechanisms behind extreme weather. Powell discusses the resulting damage and suffering inherent to such events. This helps bring the message home: extreme events are more than abstract physical phenomena. They are some of the most destructive disasters than can hit you, and their toll can reach tens of thousands of deaths and billions of US dollars. If the overall impact of events paints a bleak picture, the personal stories are particularly harrowing. Unlike 2084, these are events which have already taken place and wreaked havoc on the lives and livelihoods of thousands of people. And Powell's personal account of the 1988 Yellowstone National Park fires somehow makes these events more tangible, particularly if you are lucky enough to never have faced such destructive forces.

Powell also addresses issues that have arisen, or could arise, from the responses and management of extreme events. For instance, the action taken by the Army Corps of Engineers to manage the 2011 Mississippi floods could have led to the river reverting to its alternate course, through the Atchafalaya Basin, an event which would have considerable impacts on downstream communities and shipping. Clearly, this did not happen this time, but should we run the risk of causing such a change again, or do we need to think of alternative solutions to manage future problems? Also, during the heatwaves in Europe (2003) and Russia (2010), people lost their lives because they did not know that they had to drink more water in warmer conditions or because they drowned after drinking alcohol. This clearly shows that simple measures, such as awareness campaigns, could yield significant results and allow us to protect ourselves against the worst effects of such events, which helps to address the issues behind 'managing the unavoidable'.

But the overall strength of his argument lies perhaps in the evaluation of predictions made by climate scientists. With rising water vapour levels now observed, is the expected increase in extreme precipitation events already noticeable? It appears so: analyses of US and northern hemisphere precipitation show just this. Similarly, changes in the timing of snow melt, and rising sea-surface and air temperatures have been implicated in wildfires, droughts and heatwaves. But at no point does Powell claim that climate change alone is responsible for all events in recent years. This is particularly true of tornadoes and hurricanes. Not only does he clearly state the uncertainties, he also points out other factors, such as river engineering projects, La Niña and forestry practices, that have played major, sometimes predominant, roles in some of the events he discusses. This is openness at its best, a way of pre-emptively answering those critics who tend to cherry-pick details and miss the whole picture when evaluating climate-related evidence.

So does Powell manage to answer the questions he sets out to answer, namely whether there is now a 'preponderance of evidence' that climate change is under way? He certainly makes his position clear: for him, there is already enough evidence to take action and prevent the worst from occurring. It is difficult to argue against this. Of course, extreme events have always occurred, without the help of humans, but it is the number of recent record-breaking events or worst events in decades that should make us stand up and take note. These come on top of trends that show rising global temperatures, melting Arctic sea ice, retreating glaciers, rising sea levels, and migrating species. All of this is consistent with what we expect from climate change. So do we now wait until we have absolute proof, which probably means leaving it too late to 'avoid the unmanageable', or do we start addressing the root cause of all these changes?

Rough Winds was released as a Kindle Single and is currently at #3 under Earth Science. The good news is that you don't need a Kindle to read it - you can download apps to read it on PC, Mac, iPhone/iPad and Android. With the Horn of Africa and Pakistan experiencing severe drought and floods, respectively, as well a new La Niña possibly on its way, this is a timely book that I thoroughly recommend.

Download Rough Winds from Amazon.

0 0

Printable Version  |  Link to this page

Comments

Prev  1  2  3  4  5  Next

Comments 51 to 100 out of 217:

  1. Tom, You are half right. Not every La Nina will lead to a drought in Texas, as your graph details. However, every Texas drought has ccurred during a La Nina. Clearly, there is more to it than just ENSO events. By any standard, 2011 was hot and dry in Texas. Using the past decade to establish a "new normal" appears rather premature, as historically (as shown earlier) Texas has some rather extreme years, with few being "normal."
    0 0
  2. I encourage readers to peruse the "ClimateCommunication" site, it has easily accessible discussions of the science, including a discussion about extremes. Input for the text has been provided by some of the leading experts int he world on the relevant issues. "Recent weather events such as deadly heat waves and devastating floods have sparked popular interest in understanding the role of global warming in driving extreme weather. These events are part of a new pattern of more extreme weather across the globe, shaped in part by human-induced climate change. As the climate has warmed, some types of extreme weather have become more frequent and severe in recent decades, with increases in extreme heat, intense precipitation, and drought. Heat waves are longer and hotter. Heavy rains and flooding are more frequent. In a wide swing between extremes, drought, too, is more intense and more widespread. All weather events are now influenced by climate change because all weather now develops in a different environment than before. While natural variability continues to play a key role in extreme weather, climate change has shifted the odds and changed the natural limits, making certain types of extreme weather more frequent and more intense. The kinds of extreme weather events that would be expected to occur more often in a warming world are indeed increasing. [Source] The highlighted text above drives home a very important point, a point that is very inconvenient for those in denial about AGW or those "skeptical" that the consequences of continuing with business as usual will be very deadly and costly.
    0 0
  3. skywatcher @ 44 I am going through the presentation by Stu Ostro. It is interesting but I am not completely following the connection to Global Warming. Ridges at the 500 mb level prevent troughs from moving and create extreme weather in these areas. I was not sure he made a clear explanation of how global warming is changing patterns. I will continue to digest and research the material as time permints. I thank you for reposting this. I remember looking at it earlier. Here is a few month's worth of 500 mb anomalies from December 2003 to February 2004. Animation of 500 mb anomalies. What I am trying to determine is if Stu Ostro's presentation of anomalies at 500 mb level is really that extreme. I am looking for more animations of this pressure level to determine height anomalies and get some form of what normally occurs. It is a way for me to verify this presentation.
    0 0
  4. Hi Norman - what I took from Stu Ostro's presentation was that there was the observation that quite often extreme events happened around these large pressure anomalies. I didn't see him indicate a causal mechanism, and so his idea is firmly in 'hypothesis' territory. I would have thought that ordinary blocking events provide the conditions under which dry weatehr has the opportunity to become extremely dry, and wetter weather has the chance to be extremely wet. In that case the blocking itself may not have changed much (though Ostro shows some very extreme values). The weather extremes are thus a result of higher average temperatures and a greater capacity to evaporate or hold more water vapour in the atmosphere - these are of course known consequences of the enhanced greenhouse effect. It remains an interesting possibility that blocking itself may have changed either in location or in strength, leading to greater extremes and/or extremes in places less used to them.
    0 0
  5. skywatcher @44 I believe a valid explanation of the Texas 2011 point on the John Nielsen-Gammon (way outside the cluster) is that this year's drought covered more area and with a similar drought in the 1980's, this one shows up much worse because it could have included area that 1980 did not reach. Here is a NOAA page with 1980 vs 2011 in the Dallas FortWorth area (DFW). 2011 was not much different than 1980 in this area. In fact 2011 had almost 2" more of rain in the area as compared to 1980. Night temps were warmer in 2011 but 86 F is not a brutal temp that would likely lead to death. 1980 vs 2011.
    0 0
  6. Eric (skeptic) @49 Your quote says that only one summer (1789) matched 2011 summer drought in Texas. The question I have for you is how many others were close. Maybe only one matched but maybe 20 or 30 were close enough. Not enough data in your quote to form a valid conclusion on the extremity of the 2011 Texas drought.
    0 0
  7. muoncounter @45 "Norman's thesis appears to be 'yeah, but this has all happened before.' 'This' being drought, heatwave, flooding, windstorms, tornadoes, etc. Until it literally starts raining cats and dogs, he's right. Its just that the list of 'yeah, buts' keeps getting longer." Not a thesis. Just looking at evidence. Here are some links for you to check out and see what you think. You can clearly see that listing weather disasters strictly by a dollar value can give very misleading results on trend lines and after more detailed analysis is performed, the trends are no longer there. Normalized Hurricane damage shows no trend. Quote from article: "Across both normalization methods, there is no remaining trend of increasing absolute damage in the data set, which follows the lack of trends in landfall frequency or intensity observed over the twentieth century." Here is another study done on floods. It depends upon how you calculate the losses that determines what is actually going on. Three types of graphs are given using different approaches to financial loss. Floods in USA.
    0 0
  8. Norman, By the 1980 drought, you mean this: PDSI, August 1980: as opposed to PDSI, August 2011: Yep, they look about the same. You can look at the monthly US PDSI history here
    0 0
  9. I am posting a link to an article on the extremes of weather in Texas in 1980 for a reference. The claim is that weather is getting weirder. But remember now we are using the entire globe as our sampling table. If one State in one year can have all these extremes (some very wet places, some super dry, some really hot, some really cold, some very snowy places...all one state all one year), why should any be amazed that there are extremes in 2011? Wild Texas weather in 1980.
    0 0
  10. Norman, you tried to cherry-pick one site, yet from your link, that site is #1 in all the temperature records for August (high max, min, average), and all but the high max for the summer. Hardly supportive of this being a typical year. Following the link on the NOAA page for Waco also shows the extremes. When average temperatures for a month are broken by >2F (Dallas) and 3F (Waco), and for the entire summer by >1F, you don't have to wonder if it is extreme. You do realise how hard it is to break a monthly average temperature record by that much? Look at 2nd-10th rankings for the average temperatures at these sites: they span 2.6F for Dallas, 1.7F for Waco. The new records are so far above the older series that they show the records being not just broken, but utterly smashed. muoncounter's NOAA map summarises it nicely too. These droughts are not similar.
    0 0
  11. muoncounter @58 Here is what Wikipedia has to say about the 1980 drought. "The 1980 United States Heat Wave was a period of intense heat and drought that wreaked havoc on much of the midwestern United States throughout the summer of 1980. It is among the most devastating natural disasters in terms of deaths and destruction in U.S. history, claiming at least 1,700 lives[1] and because of the massive drought, agricultural damage reached US$20.0 billion (US$55.4 billion in 2007 dollars, adjusted for the GNP inflation index).[2] It is among the billion-dollar weather disasters listed by the National Oceanic and Atmospheric Administration" Wikipedia information on 1980 drought. Here is a NOAA chart of some of the most costly weather related disasters. The drought and heat of 1980 ranks very high in both life and property damage. Maybe you need to reconsider. The drought of 2011 would be higher on the PDSI because of low rain amounts from 2010. Areas were already dry. We will see how 2011 summer drought compares to 1980 in cost. NOAA chart of billion dollar weather related disasters in US.
    0 0
  12. Norman, you cherry-pick one site (Dallas), then claim to wish to look at the whole globe? Nice goalpost shift there. Following your example, can I call on Russia (2010), Europe (2003), Pakistan (2010), Australia (2010), amongst a wealth of other examples, including (flippantly) Arctic heat in winter or British record-breaking heat in spring? Why not a global temperature dataset? Ah, they all show significant warming. We should be amazed because in Texas, 1980 has been utterly put in the shade by 2011 in terms of heat and drought severity, as shown by your NOAA link. Are the cats and dogs falling in your area yet?
    0 0
  13. skywatcher @62, Look at my last post at 61. It was much more extensive than on city in Texas. Also the drought post you refer to is from muoncounter. 1980 has not been put in the shade in terms of heat. It was one of the hottest years Texas has experienced. But the ground was not so dry as in 2011 and it did not cover as much area of Texas. Also skywatcher, I am not making a claim against AGW theory that the globe is getting warmer. And the term significant is one of those "in the eye of the beholder". I would agree many areas show warming. Not sure at this time if it is significant. Significant in what way? It is a matter of degrees. Maybe you can't stand it when the temp should be 88 (normal) and it is now 89 on a regular basis. For you this would be significant. Maybe not for others. This thread is not about global warming (evidence would suggest a degree or 2 of warming depending on your temperature scale). It is about extreme weather events. Are they increasing because of the global warming? That is what I question. I am not saying I am correct in my position. I just of the opinion that at this time there is not enough good, reliable data to make a sound judgement upon this issue. I see some blogs throw out the year's worst weather events and tell me things are getting worse. Maybe they are, I just need more evidence than one or two years worth of data. Need a lot more from a lot more areas and over a lot longer time period. Need a consistent way of logging an extreme event. I think monetary damage is not a good one. Hail size, area of coverage, duration of hail storm. That is much more scientific. Get enough of this data compiled and you can answer the question in a sound scientific way based upon solid data. What I intended with the Texas data of 1980 was to show that in one small location (as compared to the whole earth) in one year you have many extremes and disasters. Why should listing 30 global extremes lead me to think that climate is shifting in a very dangerous way?
    0 0
  14. No Norman, your NOAA link shows 2011 to utterly put 1980 and any other year in the shade, for both Dallas and for Waco. If you don't think that breaking average temperature records by a the same amount as the span of 2nd to 10th place on the record table, then you and I have a very different idea of extreme. It was Texas' hottest summer by a clear margin, NOAA data shows this. In case it hasn't already been linked, Tamino has an interesting FEMA graph of the numbers of declared US disasters, with 2011 already top of the tree with three months to go. I'd say it's a more complete survey of extreme weather events than Pielke Jr's attempt to evaluate just coastal counties' hurricane damage (thus avoiding inland flooding from hurricane remnants), and doesn't involve sums of money. There are of course weaknesses as to how individual disasters are declared, but it is more evidence. Note how the rising trend with an early spike in 1998 looks rather familiar... European floods showing an increase, corroborated by the The International Disaster Database, where you can see that the trend in storm and flood damage is much more pronounced than the trend in geological disasters. If weather-related disasters worldwide are rising faster than geological disasters, Pielke Jr's nitpicks disappear. Powell is on the money, and it becomes clearer every year as what was once an abstract trend gets large enough to substantially impact people and productivity. That we see this happening worldwide is of course the key.
    0 0
  15. muoncounter, that PDSI comparison is very interesting. And not just for the current drought. The biggest difference between the 2 maps is all of the extremes. 1980 is largely coasting along for most of the country. A few extreme drought spots, a few flooded spots. And the extreme areas are less than the graduated, less severe areas. When you look at the 2011 map it's almost the reverse. Huge swathes of the country at both extremes. Not much of the country coasting at averages. Haven't 'counted pixels', but it might be worth it for those with the patience.
    0 0
  16. Good point Adelady. And that was before the floods of September in the northeast too. And how many of the white areas near the Mississippi had issues with tornadoes or flooding earlier in the year? In fact, how many parts of the USA have been 'coasting along' all year, let alone August?
    0 0
  17. skywatcher @ 64 1980 had higher high temps and more days above 105 (misery index). 2011 had a higher overall temp (high and low) because the lows were warmer. It would be interesting to have the satellite data for 1980 vs 2011. I am making a hypothesis that the contrails in 2011 were much more extensive in Texas in 2011 as compared to 1980 and in some studies this could be the cause of the warmer nights. But if you go by misery index (human suffering) then 1980 would have been a worse year than 2011 for the citizens of DFW area. 28 days above 105 in 1980, 18 in 2011.
    0 0
  18. 67, Norman, You do know, I assume, that warmer nights are a predicted consequence of CO2 induced climate change?
    0 0
  19. adelady#65: Yes, the 2011 map makes the point: Extremes are more polarized, wets are wetter, drys are drier. The extreme wet conditions in the upper midwestern US are, of course, the result of heavy snowfall the past winter. Its amazing how many people simply refuse to connect those dots. By way of anecdote, all the locals in those areas say 'its never been like this before' and the number of records broken this year backs that up.
    0 0
  20. Norman, I suggest you read Barnett (2008) and Hong et al. (2008) on contrails. Note also that IPCC AR4 has contrail warming at a tiny .01 Wm-2. I thought SkS had an article on "It's contrails."
    0 0
    Response:

    [DB] See CO2 is not the only driver of climate (Intermediate tab).

  21. Norman, you may or may not read the papers others have referred you to, I don't know what you will make of them if you do. How about another approach. Thinking about whether something, anything, is bad or not. Smoking is the example I have in mind right now. We all know 'smoking is bad'. We know that ~50% of smokers will die from smoking related causes. A goodly proportion of those deaths will be premature rather than the thing that finally takes you out when you're 90+. Read that again. Our societies go to a lot of trouble to warn us against an activity - that brings early death to less than 50% of those who engage in it. Same thing, but different numbers, for driving over the speed limit or over the blood alcohol limit. And occupational health and safety, or building standards, or food safety. Can you apply the reasoning you use for climate change impacts to these issues? Or are smoking, speeding, drunk-driving, shaky bridges, rats in the kitchen OK? None of these is a particularly good analogy for climate change. On the other hand, thinking about how we regard all these risks and our personal and social response to them is useful for thinking about responding to the risks of climate change. Many people seem to raise the old smoking gambit. "My grandfather smoked a pack a day and he lived to be 94." That doesn't mean it's a good idea for everyone to smoke. Similarly, just because there will always be places that see little or no impact from climate change, it doesn't mean that it's OK.
    0 0
  22. Norman, other's have already debunked teh contrails part, but I'll add that you continue to cherry-pick your numbers. The only way you can consider your selected single city in Texas to not have record-breaking heat is to pick one particular measure of heat (highs above 105). Nearly all other measures of heat have 2011 out in front, and if I indulge in a bit of cherry-picking myself, Waco, <150km from Dallas (and easily linked on NOAA), had a lot more of those heat misery days this year than in 1980 (29 to 10). It is ahead on every heat index. How did the contrails affect Waco again? I'm going to leave it at that, you're obviously too desperate to avoid considering that this year might just be classified as 'extreme' by the state of Texas - please look at muoncounter's map again too.
    0 0
  23. skywatcher @60 "Following the link on the NOAA page for Waco also shows the extremes. When average temperatures for a month are broken by >2F (Dallas) and 3F (Waco), and for the entire summer by >1F, you don't have to wonder if it is extreme. You do realise how hard it is to break a monthly average temperature record by that much?" I am not sure where you live but it is not as difficult to break monthly averages as you perceive. I have been logging daily temperature high and lows for Omaha Nebraska for a couple of years. I have the monthly anomalies for 21 months. Of those 21 months, 7 have anomalies above or below 3 F. Greatest high was around 7 above. in April 2010. Lowest was -6.58 in February 2010. Four more monthly anomalies were above or below 2 F. So 11 of the 21 were above or below 2 F. I cannot see how you conclude this is an extreme.
    0 0
  24. Norman: See label: Warmest summer on record -- source July daytime/nightime record highs -- source No one is saying that 1980 Dallas wasn't very hot. But the hallmark of this heatwave is that its not just very hot in Dallas, its not just very hot in Texas, its widespread and its very hot.
    0 0
  25. Sorry for the mess, I will try once more to post an image.
    0 0
    Response:

    [DB] Fixed image.

  26. muoncounter, If you would be so kind to inform me how you so easily post a graphic on the thread. My second attempt made a link to the graphic but it did not appear in the post. It might make it easier for people to follow if I post a graphic in my post.
    0 0
    Response:

    [DB] If you go to the Posting Tips section, use the html string there with the width 450 limiter in it.  Using that string, replace everything between the quote marks with your graphic's URL (in both places).

    Use the Preview function to verify the image will appear before posting the comment.

  27. skywatcher @72 "Norman, other's have already debunked teh contrails part, but I'll add that you continue to cherry-pick your numbers" I am not sure it has been debunked. The original researcher behind the claim still believes the contrails will reduce local DTR's by up to 1.8 C (around 3 F) I was on this thread about the topic: SkS thread on DTR topic. Check the link in Post 106 of this thread if interested.
    0 0
    Response:

    [DB] "I am not sure it has been debunked."

    Linear Contrails from aviation have a slight warming effect of +0.01 Wm-2.

    Contrail Forcing

    Global mean radiative. Anthropogenic RFs and the natural direct solar RF are shown. (IPCC AR4 Section 2.1)

    Please do the math and show us how a contrail radiative forcing of +0.01 Wm-2 translates into a reduction in local DTR's by up to 1.8 C?

    Until then we will consider it debunked.

  28. Agreed muoncounter. #73 Norman, I'll have to spell out what I meant. It seems I missed a word in my comment above, I was talking about record average temperatures - my apologies for the confusion. I would hope you did not think the climate average monthly temperature for Dallas in August was 91F! Dallas August 2011: Average temp was 93.4F. The rest of the top 10 record average August temperatures, in a record that goes back to 1899 (I think): 91.1 (1952) 90.3 (1951) 90.2 (1999, 2000) 89.8 (2006, 2010) 89.3 (1943) 88.8 (1954) 88.5 (1980) from Norman's earlier NOAA link I'm not talking about smashing monthly averages, but smashing the monthly average records. Records such as these, involving averages, and involving a dataset going back many decades, ordinarily would be broken by a fraction of a degree here and there, maybe by up to 1F, especially when the dataset is shorter. At Waco the monthly average record fell by 3F, that is, the second-hottest ever month was 3F cooler than August 2011, for Dallas, the second-hottest month was 2.4F cooler than August 2011. That easily qualifies as "extreme". The average August temperature for Dallas (1899-2010) for reference is 84.9F, but the size of anomalies from the average depends on your climatology and continentality, so are not that relevant. Records falling by large amounts by comparison to the pattern of previous records is something to take note of. When this happens over a wide area and in different parts of the world, it's significant.
    0 0
  29. adelady @71 I do look at links that others refer to. I am not convinced that things are worse. I do not think there is enough good data to determine at this time. I know about the many posts with disaster charts showing things are getting worse. I do not think a disaster classification is an independent variable. Basically a disaster deals with loss of life or property. Since property values and populations grow and move, it makes it an shifting variable. A means of describing extreme weather needs to be developed (like the tornado scale or hurricane scale) that does not depend upon people in the equation. Only wind speed and size are used to describe the severity of a tornado or hurricane regardless if this hurricane stays out at sea or the tornado only touches down in an empty field. It is a true independent variable. Once you would get enough of these logged and monitored you could make a claim if they are increasing or decreasing in number. Disaster statistics use the dependent variable (people and property both with vary and change or time and region). Here is my case in point. You have a flood plain. Has not seen a flood in 100 years but no one was living there. People decide it is safe and start moving on the plain. Then a flood comes and a situation that would not have been a disaster before has now become one because of the dependent variable involved. I know the most severe tornadoes have had a declining number over the years.
    0 0
  30. skywatcher @79, Thanks for the clarification and I see what you were getting at. Sorry for the misunderstanding on my part.
    0 0
  31. munoncounter @58 Have you looked at the drought of 1934 to compare it to 2011? Drought of 1934 to compare to 2011 August. The nice thing about the NOAA drought index is you can animate a month of data from 1900 to 2011. I suggest a try and you can see what is and is not normal. There have been some extensive and extreme droughts over this time period as well as some very wet years that cover large areas. Not sure about the extremes from the 2011 year when looking at the longer history of these type of events.
    0 0
  32. #81 - No worries! #80 - A variety of datasets indicate that disasters involving fire, flood and storm appear to be increasing more rapidly than do those involving earthquake or volcano (both absolute numbers as linked above, or insurance IIRC. Some, like Pielke, disagree based on their (limited) datasets. [I wonder how the earthquake or volcanic data would look with a 'Pielke correction' applied. Large decrease?] When geological disasters increase more slowly than weather disasters, what is your explanation? On contrails, your linked paper (Travis et al 2002) does not seem to be the end of the story: From the IPCC AR4 report: "The Travis et al. conclusions are weak because they are based on a correlation rather than a quantitative model and rely (necessarily) on very limited data (Schumann, 2005). Unusually clear weather across the USA during the shutdown period also has been proposed to account for the observed DTR changes (Kalkstein and Balling, 2004). " Where did the 1.8C number come from, as the maximum effect in Travis02 is much less than that?
    0 0
  33. Norman, I think that part of what you should recognize is that it is still very early in the climate game. We've barely raised temperatures so far, and we haven't yet reached the level of warming we've set the CO2 thermostat to. And yet we see events like these. But they're events that you can find wiggle room to argue about and doubt and tell yourself it's okay. When temperatures increase further, things will get more frequent and the things that do happen will be worse. You might be able to argue a bit by holding up 1980 or 1934 now, but in 10 or 20 years time there will be 5 new examples for every old one, and it will be obvious that they'll keep coming. And 10 or 20 years after that it will be that much worse still. I don't think you are that wrong to say "this isn't necessarily so different" right now. This event or that event might not be due to climate change. But I do think you are very wrong to be so focused on the present, with a hopeful eye towards the future, figuring that this is the worst it will get, and you can't even be sure this is related to climate change. It doesn't matter if this one event or that one event is or isn't a direct, attributable result of climate change. There will be more. They will get worse. And when that time comes, there will be no going back. There's no rewind-do-over-oops button that lets us undo the mistakes. If the day comes when you are able to sit down and say "wow, this sucks, and it's obviously due to climate change" then it's way, way too late.
    0 0
  34. Sphaerica, well said. What's also interesting is that five or ten years ago we weren't really having this discussion. There were a few wild events (e.g. the European heatwave), but for the most part, the extremes weren't breaking the mould. As you say, take that logic forward, and we'll see that we're on a trajectory. 5 or 10 years ago: "can't link this / that weather event to AGW, there's been extremes like this before". now: "blimey, there's a lot of very weird events happening, and quite a few records are being smashed, maybe these extreme events have a component of climate change within them?" in 10 or 15 years: "Ah. It's really obvious. The weather's totally mad and it's obviously closely linked to the much hotter world we created." By then it's too late to stop the next step, which might well be "Take cover all!"
    0 0
  35. Norman, have a really good, long look at the graphic in this post at CapitalClimate . Note that this catalogue of record breaking events is based on thermometers. Physical measurements unrelated to population or other issues. Just looking at the previous all-time record, the normal and the 2011 figures must give cause to pause. And then have a look at the ratio of cold/hot records set for August in the US. Something's going on.
    0 0
  36. Norman, you probably already know this, but unlike the GAT indexes, records (and the ratio shown in post 85) are not corrected for local site effects and UHIE. In one case, National airport in DC, the extent of gravel has grown: http://i433.photobucket.com/albums/qq51/palmer2/national-asos.jpg and the low temperatures are routinely higher than dozens of nearby weatherbug stations (higher than all other stations on radiational cooling mornings). I am quite sure there was no effect on record highs, but there seems to be a warming effect on lows on clear, calm mornings. I don't know if it affected record high minimums in this particular case.
    0 0
  37. DB #77 The 0.01 watts/meter of contrails is its effect on the entire globe (the contrail coverage of the globe is small) but in localized areas that may have a high degree of contrail formation (based upon upper atmpospheric conditions) the effect can influence the local region (still a small part of the globe) to a greater degree. Would be similar to a thick cloudy night in a local region. It will keep the temps much warmer in that region but will have little effect on the global temp.
    0 0
    Response:

    [DB] We are left with this:  In this absence of actual research or performing the radiative equations (line by line is best) to demonstrate the feasability of your hypothesis, you present unsupported conjecture.

    In like fashion, I could be the recipient of a large grant from a Nigerian bank (as I get those email notifications daily), but it remains conjecture until I supply them with necessary bank account details for them to process the deposits (and subsequent withdrawals).

  38. DB @87 I can't take credit for this hypothesis, it comes from this article and is based upon some empirical evidence. Others may have questioned it as reported in article links above but the author of this still believes it has a noticeable effect on temperature. DTR after 9/11.
    0 0
  39. Norman, There's a basic point that keeps slipping through the cracks here. Look back at the original post: from the floods in Queensland, Colombia, Pakistan and Sri Lanka, to the droughts in Texas, Australia, China and the Amazon, and record-setting high temperatures in countries that cover approximately one-fifth of the Earth's surface. Wildfires, snowstorms, tornadoes and hurricanes have also made the headlines in a number of countries. -- emphasis added Look at the PDSI map you posted for July 2011. Deep green (very wet) and Deep Purple (very dry) appear on the same land mass. Compare that to the map you linked for 1934: very dry only. No one has said that there wasn't a drought in 1980 (nor 1934). But this combination of opposite extremes - it's hard to find precedent for that; its downright weird. Note: there is a thread for 1934 was the hottest year. Also note: Deep Purple.
    0 0
  40. muoncounter, A climate challenge for you to give to your students (if you are a teacher). I am performing the test as I post on different windows. Using the NOAA Palmer drought index you linked graphs to in post 58. This page allows animations of any year you wish to select from 1900 to 2011. Here is the challenge (like the blindfold taste tests). Take the 30 year period (1981-2011) as one animation. Now pick a few other 30 year animations from the list and have your students watch them side by side and see if they can pick the last 30 years from a clear signal of increasing rainfall patterns and droughts. If they can they are better than me. I can't see any relevant pattern in my current selection. I can recognize 2011 by that unique pattern of lots of moisture north and very dry south but the overall 30 year period certainly does not show any obvious pattern that things are getting more extreme. If you do the challenge let me know how the results come up.
    0 0
  41. muoncounter @ 89 I will agree with you that 2011 does have the largest of the type of pattern with the the combination of extremes but it is not that "weird". Looking at the 100+ years of August for the Palmer drought index, the pattern has come up in other years. In 1914 the combination was there only east/west rather than north/south. In 1917 the pattern shows up, just a smaller version. In 1919 you have a reverse of 2011. Wet south but dry north. 1951 has the pattern of 2011. It is greater than 1917 but not as much as 2011. I am not sure such a pattern of extremes (very dry and very wet) is unusual or "downright weird".
    0 0
  42. Thank you Daniel Bailey for the instruction on posting direct graphics. Muoncounter, I am posting the graphics of the years I listed in post 91.
    0 0
  43. Norman#91: "the combination of extremes but it is not that "weird"." So the list of things disputed grows: the findings of the author of the book in this post, Jeff Masters' blog post on extreme weather events, disaster counts by professionals who deal in disasters, hurricane/tropical storm trends, flooding trends, 2011's drought vs. 1980, 2011's drought vs. 1934, 1981 - 2011 vs. any other arbitrary 30 year period's PDSI 'pattern.' Do we have a trend here? I find it revealing that the list of things requiring a 'yes, but --- was just as bad' keeps growing. I did some graduate work in earthquake seismology a number of years ago. Nobody at that time would 'predict' a large earthquake, but everybody sure knew the signs that something was building up. With a consistent cluster of foreshocks, geothermal activity, anomalous uplift or tilt and strange animal behaviors, it would be time to avoid tall buildings for a while. But with climate data, it's ok to look at these patterns and say 'it's not that bad.' If you were a structural engineer and you saw a pattern of incipient cracks in the supports of a bridge, would you say 'its not bad'?
    0 0
  44. Just reading the 'recent comments', and two side-by-side comments seemed worth connecting. adelady's latest comment on another thread somehow seems incredibly relevant to muoncounter's comment here at #93. Norman, is there a point at which you'll accept that extreme events are on the rise, seeing as you've been contesting everything in muoncounter's post? How many more extreme events will it take?
    0 0
  45. muoncounter @93 "If you were a structural engineer and you saw a pattern of incipient cracks in the supports of a bridge, would you say 'its not bad'?" You may indeed think it is bad, but then if you see the same cracks for years and they do not seem to be getting worse your thinking about disaster may gradually go down. The list of "yes, but --- was just as bad' keeps growing"... Maybe it keeps growing because that is the reality of the beast called weather. Here is one sample. "This report provides a review of the winter of ???? a winter of unusual extremes in parts of the country. Although December was not unusually active, January and February proved to be quite interesting. Those months included the following extreme events: The January blizzard and ensuing flooding in the Northeast, and then in February-- a severe cold wave, Pacific Northwest flooding, and unusual warmth and fires in the southern plains. Another interesting aspect of the past winter was the 'seesaw' pattern of temperatures and precipitation over much of the nation. Extremely cold conditions (such as early February) were often followed by unusual warmth. The same applied to precipitation, with the Northwest beginning the season on the dry side, and then moving into a very wet pattern. Therefore, as is sometimes the case in climatology, the averages of the season as a whole belie the extremes contained within." Can you guess the years? It was not cherry-picked. Just a random grab. My perception is that weather extremes take place every year. Unless directly affected, the actual occurence fades from memory. It is only the globalization of media that exposes so many areas extremes to us in a rapid fashion that we feel things are getting really bad, even though they may not be. I still challenge the disaster count. I had long debates about this with Tom Curtis on the SkS thread here. Here is the link to the above quote on climate extremes. Random sample from NOAA on extreme weather in US.
    0 0
  46. muoncounter, Another one for you. I wonder what Jeff Master's would have said about this storm? Super Storm of 1993.
    0 0
    Response:

    [DB] Do please try to focus more on the topic of this thread:  Review of Rough Winds: Extreme Weather and Climate Change by James Powell

    You are sounding ever more as one in pursuit of an agenda (denial of climate change and extreme weather) and less as one examining all of the evidence critically.  For example, your Black Knight routine after the lack of evidence supporting your position on contrails was pointed out to you, and now you furnish yet another link (off-topic on this thead) in an effort to prosecute your agenda followed on the earlier extreme weather thread.

    A greater effort to stay on topic and examining all of the evidence would enhance your position.

  47. Norman "... then if you see the same cracks for years and they do not seem to be getting worse your thinking about disaster may gradually go down." And if that bridge is in an earthquake zone, or an area subject to storm surges or other flooding, or drought that shrinks and cracks the underlying clay or .... name your soil destabilising phenomenon, you'd be saying what exactly? You've been lucky so far, but you're really pushing your luck now.
    0 0
  48. Norman, The observations Masters made here includes the time period of your super storm. the wild roller-coaster ride of incredible weather events during 2010, in my mind, makes that year the planet's most extraordinary year for extreme weather since reliable global upper-air data began in the late 1940s. Never in my 30 years as a meteorologist have I witnessed a year like 2010--the astonishing number of weather disasters and unprecedented wild swings in Earth's atmospheric circulation were like nothing I've seen. "the reality of the beast called weather." This will continue going in circles until you answer skywatcher's question: How much would it take for you to admit that the weather beast has new fangs? To that question, I would add: What makes you so sure, when a number of experts are saying you're wrong? "if you see the same cracks for years and they do not seem to be getting worse your thinking about disaster may gradually go down." In other words, you have to ask yourself 'do I feel lucky?' I seem to recall NASA Ames did some tests of small chunks of foam impacting a space shuttle wing that produced nothing to be concerned about. That was prior to Feb 1, 2003.
    0 0
  49. skywatcher @64 "I'd say it's a more complete survey of extreme weather events than Pielke Jr's attempt to evaluate just coastal counties' hurricane damage (thus avoiding inland flooding from hurricane remnants), and doesn't involve sums of money. There are of course weaknesses as to how individual disasters are declared, but it is more evidence. Note how the rising trend with an early spike in 1998 looks rather familiar" Please reread the important quote from the Pielke paper. The content of the paper was not to discredit AGW, but warn people about moving to the coasts in large houses. "A normalization provides an estimate of the damage that would occur if storms from the past made landfall under another year’s societal conditions. Our methods use changes in inflation and wealth at the national level and changes in population and housing units at the coastal county level. Across both normalization methods, there is no remaining trend of increasing absolute damage in the data set, which follows the lack of trends in landfall frequency" There was no trend in the actual hurricanes that have hit the US but the raw disaster data showed a sharp upswing. Once you normalize for population shift and propery values the upward trend is more reflective of actual hurricane number and intensity reaching the coastal areas. Look at figure 3 of this article.. At the end they list all the hurricanes that have hit the US and you can compare the category of hurricane to the damage in Figure 3 and you can see how unreflective disaster graphs are of actual weather events. I think it becomes significant if you think about it. Remember a scientist will investigate all angles to arrive at the Truth. You may be totally convinced that the Earth is headed for disaster like a car going over the cliff, do not let this sensation stop you from investigation.
    0 0
    Moderator Response:

    [muoncounter] fixed closing link tag

  50. "no trend in the actual hurricanes that have hit the US" That's because 'hitting the US' is a biased standard. There is a trend in named storms; we went around and around on this here. As is category, which is based entirely on wind. As we saw in Irene and TS Allison, torrential rain is very bad.
    0 0

Prev  1  2  3  4  5  Next

You need to be logged in to post a comment. Login via the left margin or if you're new, register here.


The Consensus Project Website

THE ESCALATOR

(free to republish)


© Copyright 2024 John Cook
Home | Translations | About Us | Privacy | Contact Us