Climate Science Glossary

Term Lookup

Enter a term in the search box to find its definition.

Settings

Use the controls in the far right panel to increase or decrease the number of terms automatically displayed (or to completely turn that feature off).

Term Lookup

Settings


All IPCC definitions taken from Climate Change 2007: The Physical Science Basis. Working Group I Contribution to the Fourth Assessment Report of the Intergovernmental Panel on Climate Change, Annex I, Glossary, pp. 941-954. Cambridge University Press.

Home Arguments Software Resources Comments The Consensus Project Translations About Support

Bluesky Facebook LinkedIn Mastodon MeWe

Twitter YouTube RSS Posts RSS Comments Email Subscribe


Climate's changed before
It's the sun
It's not bad
There is no consensus
It's cooling
Models are unreliable
Temp record is unreliable
Animals and plants can adapt
It hasn't warmed since 1998
Antarctica is gaining ice
View All Arguments...


Username
Password
New? Register here
Forgot your password?

Latest Posts

Archives

Extreme Events Increase With Global Warming

Posted on 11 November 2011 by Rob Painting

For a more basic version of this post, see here

That continued warming of the Earth will cause more frequent and intense heatwaves is hardly surprising, and has long been an anticipated outcome of global warming. Indeed the 1990 Intergovernmental Panel on Climate Change (IPCC) Policymakers Summary stated that: 

"with an increase in the mean temperature, episodes of high temperatures will most likely become more frequent in the future, and cold episodes less frequent."

One such "high temperature episode" was the monster summer heatwave centred near Moscow, Russia in 2010, where temperatures rocketed well above their normal summertime maximum and were so record-shattering they may have been the warmest in almost 1000 years.

Rahmstorf and Coumou (2011) developed a statistical model and found that record-breaking extremes depend on the ratio of trend (warming or cooling) to the year-to-year variability in the record of observations. They tested this model by analysing global temperatures and found that warming increased the odds of record-breaking. When applied to the July 2010 temperatures in Moscow, they estimated a 80% probability that the heat record would not have occurred without climate warming.
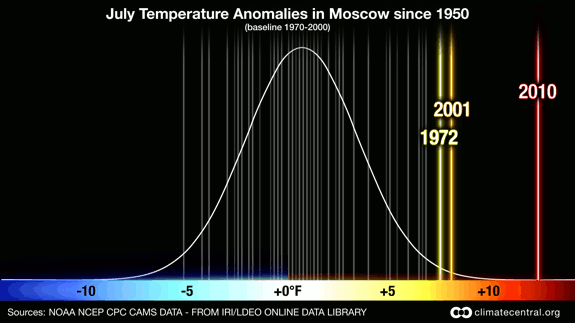
Figure 1 - Probability of July average temperature anomalies in Moscow, Russia since 1950. This image shows that the average temperature in Moscow for July 2010 was significantly hotter than in any year since 1950. Credit: Claudia Tebaldi and Remik Ziemlinski. From ClimateCentral.org

Some statistical background

Earlier statistical work on record-breaking events has shown that for any time series that is stationary (i.e. no trend), the probability of record-breaking falls with each subsequent observation. This is known as the 1/n rule, where n equals the previous number of data in the series. For example, the first observation has a 1-in-1 chance of being the record extreme (100%), the second has a 1-in-2 chance (50%), the third a 1-in-3 chance, and so on.

For climate heat records, the stationarity rule is not apparent, as one might expect in a warming world. Previous work in this area has shown that the slowly warming mean (average) temperature is responsible for this nonstationarity.   

Monte Carlo 

Following on from this earlier work, Rahmstorf and Coumou (2011) sought to disentagle the two effects of the mean change in temperature (climate warming), from the random fluctuations of weather, so as to find out the contribution of each to record-breaking. To do this, the study authors turned to Monte Carlo simulations. These are computer-generated calculations which use random numbers to obtain robust statistics. A useful analogy here is rolling a dice. Rolling once tells us nothing about the probability of a six turning up, but roll the dice 100,000 (as in this experiment) and you can calculate the odds of rolling a six. 

From the simulations the authors obtain 100 values which represent a 100 year period. Figure 2(A) - 2(C) are the "synthetic" time series, and 2(D), 2(E) are respectively, the 'synthetic' global mean and Moscow July temperature. In all panels the data have been put into a common reference frame (nomalized) for comparison. (See figure 1 for an example of a Gaussian or normal distribution. Noise represents the year-to-year variability). 
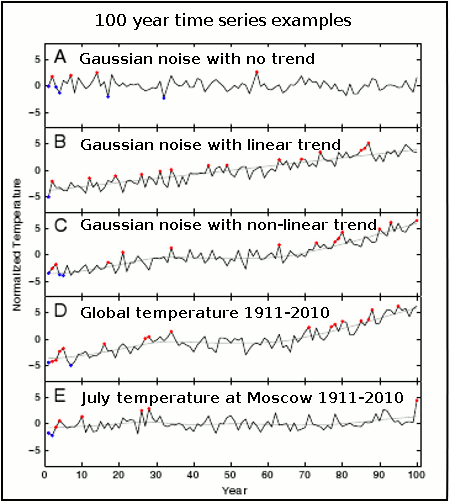
Figure 2 - examples of 100 year time series of temperature, with unprecedented hot and cold extremes marked in red and blue. A) uncorrelated Gaussian noise of unit standard deviation. B) Gaussian noise with added linear trend of 0.078 per year. C) Gaussian noise with non-linear trend added (smooth of GISS global temp data) D) GISS annual global temp for 1911-2010 with its non-linear trend E) July temp at Moscow for 1911-2010 with non-lnear trend. Temperatures are normailzed with the standard deviation of their short-term variability (i.e. put into a common frame of reference). Note: For the Moscow July temperature (2E) the long-term warming appears to be small, but this is only because the series has been normalized with the standard deviation of that records short-term variability. In other words it simply appears that way because of the statistical scaling approach - the large year-to-year variability in Moscow July temperatures makes the large long-term increase (1.8°C) look small when both are scaled. Adapted from Rahmstorf & Coumou (2011)

Follow steps one.....

Initially, the authors ran the Monte Carlo simulations under 3 different scenarios, the first is for no trend (2[A]), with a linear trend (2[B]) and a nonlinear trend (2[C]). The record-breaking trends agree with previous statistical studies of record-breaking namely that: with no trend the probability of record-breaking falls with each observation (the 1/n rule), and with a linear trend the probability of record-breaking gradually reduces until it too exhibits a linear trend. With a non-linear trend (2[C]), the simulations show behaviour characteristic of the no-trend and linear trend distibutions. Figures 2(D) and 2(E) are the actual GISS global and Moscow July temperatures respectively.   

.....two.....

Next, the authors then looked at both the GISS global and Moscow July temperature series to see whether they exhibited a gaussian-like distribution (as in the 'lump' in figure 1). They did, so this supports earlier studies  indicating that temperature deviations are fluctuating about, and shifting with a slowly moving mean (as in the warming climate). See figure 3 below.   

Figure 3 -Histogram of the deviations of temperatures of the past 100 years from the nonlinear climate trend lines shown in Fig. 2(D)  and (E) together with the Gaussian distributions with the same variance and integral. a) Global annual mean temperatures from NASA GISS, with a standard deviation of 0.088 ºC. (b) July mean temperature at Moscow station, with a standard deviation of 1.71 ºC. From Rahmstorf & Coumou (2011)

.....and three.

Although the authors calculate probabilities for a linear trend, the actual trend for both the global, and Moscow July temperature series is nonlinear. Therefore they separated out the long-term climate signal, and the weather-related annual temperature fluctuation, which gave them a climate 'template' on which to run Monte Carlo simulations with 'noise' of the same standard deviation (spread of annual variability from the average, or mean). This is a bit like giving the Earth the chance to roll the 'weather dice' over and over again.

From the simulations with, and without the long-term trend, the authors could then observe how many times a record-breaking extreme occurred.
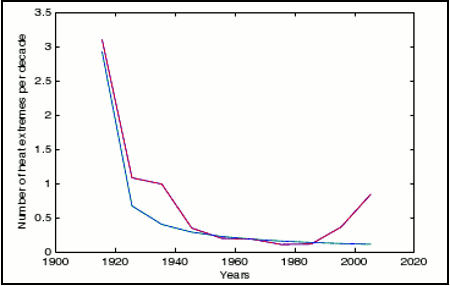
Figure 4 -Expected number of unprecedented july heat extremes in Moscow for the past 10 decades. Red is the expectation based on Monte Carlo simulations using the observed climate trend shown in Figure 2(E). Blue is the number expected in a stationary climate (1/n law). Warming in the 1920's and 1930's and again in the last two decades increases the expectation of extremes during those decades. From Rahmstorf and Coumou (2011)

Large year-to-year variability reduces probability of new records

A key finding of the paper was that if there are large year-to-year non-uniform fluctuations in a set of observations with a long-term trend, rather than increasing the odds of a record-breaking event, they act to reduce it because the new record is calculated by dividing the trend by the standard deviation  The larger the standard deviation the smaller the probability of a new extreme record.

This can be seen by comparing the standard deviation of the NASA GISS, and Moscow July temperature records (figure 3), plus figure 2(D) and [E]). As the GISS global temperature record has a smaller standard deviation (0.088°C) due to the smaller year-to-year fluctuations in temperature, you will note in figure 2(D) that it has a greater number of record-breaking extremes than the Moscow July temperature record over the same period (2[E]). So, although the long-term temperature trend for Moscow in July is larger (100 year trend=1.8°C), so too is the annual fluctuation in temperature (standard deviation=1.7°C), which results in lower probability of record-breaking warm events. 

Interestingly it's now plain to see why the  MSU satellite temperature record, which has a large annual variability (large standard deviation, possibly from being overly sensitive to La Niña & El Niño atmospheric water vapor fluctuations) still has 1998 as it warmest year, whereas GISS has 2005 as it's warmest year (2010 was tied with 2005, so is not a new record). Even though the trends are similar in both records, the standard deviation is larger in the satellite data and therefore the probability of record-breaking is smaller. 

That other Russian heatwave paper

The results of this paper directly contradict the findings of Dole (2011) who discounted a global warming connection with the 2010 Russian heatwave. Rahmstorf & Coumou (2011) demonstrate that the warming trend from 1980 onwards (figure 4) greatly increased the odds of a new record-breaking warm extreme, and in fact should have been anticipated.

It turns out that Dole (2011) failed to account for a quirk in the GISS Moscow station data which had wrongly applied the annual urban heat island (UHI) adjustment for the monthly July temperatures, when UHI is a winter phenomenon in Moscow. This meant that the large warming trend evident there in July had been erroneously removed. This was confirmed by looking at Remote Sensing Systems (RSS) satellite data over the last 30 years, which shows a strong warming trend in Moscow July temperatures. See Real Climate post "The Moscow Warming Hole" for detail, and note Figure 5 below.
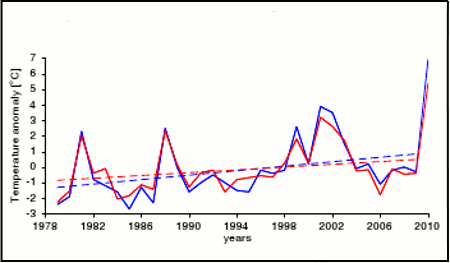
Figure 5 - Comparison of temperatues anomalies from RSS satellite data (in red) over the Moscow region versus Moscow station data (in blue). Solid lines shows the average July value for year, whereas the dashed lines show the linear trend for 1979-2009. Satellite data have a trend of 0.45°C per decade, as compared to 0.72°C per decade for the Moscow station data.

Whatchoo talkin' bout Willis?

Using the GISS data from 1911-2010 (a nonlinear trend), the authors calculate a 88% probability the extreme Russian heatwave (a record in the last decade of the series) was due to the warming trend. Clearly the summer temperatures for July 2010 in Moscow were a massive departure from normal, and including them would create bias, so the study authors exclude 2010 from their analysis, and re-calculate for 1910-2009. They found a 78% probability the freak heatwave was due to warming, and extending their analysis back to include the entire GISS temperature observations (1880 -2009), they found an 80% probability.

So to sum up:

  • Rahmstorf and Coumou (2011) is a statistical/analytical study, which does not look at the physical causes of the 2010 Russian heatwave. Instead they assess the likelihood of record-breaking extremes. 
  • Based on earlier work, and confirmed by the Monte Carlo simulations; in a climate with no trend (no long-term warming or cooling), the probability of record-breaking extremes falls over time (perhaps contrary to popular belief).
  • With a warming (linear) trend, the number of record-breaking warm extremes reduce until they eventually increase in a linear manner.
  • With a nonlinear trend (warm/stagnation intervals) the probability of record-breaking is a combination of the no trend/linear trend scenarios.
  • Larger annual fluctuations (larger standard deviation) reduce the number of records, whereas smaller fluctuations increase the number of record- breaking extremes.
  • This helps explain why the satellite temperature record (large annual fluctuation) has 1998 as it warm record, whereas GISS (small annual fluctuation) has 2005 - GISS has a greater likelihood of seeing record-breaking.
  • By seperating out the random (weather) component and the long-term (warming) component, the authors established there is a 80% probability that the 2010 July temperature record in Moscow would not have happened without climate warming from 1880-2009. 
  • The record-breaking extreme should have been anticipated, which contradicts earlier work on the Russian heatwave (Dole [2011]).
  • In a warming world expect to see more record-breaking warm temperatures. 

0 0

Printable Version  |  Link to this page

Comments

Prev  1  2  

Comments 51 to 82 out of 82:

  1. Norman @ 43 - Just to add to the comments made by others, the important point you miss is the warming climate leading up to the North American heatwave made a record-breaking warm extreme more likely. You provide evidence that actually supports the findings of Rahmstorf & Coumou. So once again: In a stationary climate (no warming trend) the probability of record-breaking falls (the 1/n rule). This doesn't mean that natural variability alone cannot break records, just that the odds decrease with each subsequent observation. In a warming climate the probability of record-breaking warm extremes increase. This assumes of course, that the standard deviation follows a gaussian distribution - which it does in the case of the GISS global and Moscow July temperatures. As Tom Curtis has already pointed out to you, arguing probability on the basis of a singular event is an illogical premise.
    0 0
  2. Tom Curtis @46 You do have excellent posts. I would suggest you click on the source of the 1936 graph of the heat wave (1st graph). From the larger article the graph was part of: "Seventeen states broke or equaled their all-time record absolute maximum temperatures during the summer of 1936 (still standing records)." It was a large extent pattern and if you look into the article you will see it started in June and set state records, extended and grew in July and then persisted in August setting records in all three months so it was quite large and enduring. The amazing thing about 1936 is that not only was it very hot in the summer, it was the extreme of extreme years. It was also the coldest February recorded in the US. It has the record number of consecutive days below zero in the lower 48th (41 days). In the article they list many of the record high temps.
    0 0
  3. Norman @52 -"It was also the coldest February recorded in the US. It has the record number of consecutive days below zero in the lower 48th (41 days). Yes, hardly a surprise given this occurred early in the observational record. This asymmetry of warm vs cold records is discussed in Rahmstorf & Coumou, although I don't deal with it in the blog post. I you take a gander at Figure 1 in the post above, that's a gaussian (or normal) distribution. Keep moving that distribution to the right (climate warming trend) and the cold extremes (to the left) gradually diminish. In other words the frequency of record-breaking cold extremes decrease - as observed in figure 2 in both the GISS data and the Monte Carlo simulations.
    0 0
  4. Norman, the question you are failing to answer is this: Why does the existence of any past individual event change anything about the increasing probability of extremes in a warming world? Your #50 is irrelevant - all it shows is that in the map for 1936 a la Hansen et al 2011, North Dakota would have experienced a >= 3-sigma event and been coloured brown. Otto would have had a hot summer had he been in the town named after him. You're still avoiding the focus of everyone's issues with you: that nobody here doubts that large extremes happened in the past. But the data here (Hansen and R & C) provide strong evidence for the frequency of heatwaves increasing - the Gaussian distribution flattening slightly and shifting to the right, and each year, a greater proportion of the Earth's surface experiences extremes. Without being pejorative, I do wonder if you get what probability is all about?
    0 0
  5. Rob Painting @53 Yes that is true, the cold extremes would diminish and the warm extremes would increase. I agree with this logical thought process. As I look at Figure 1 from you above original post, I know the current global warming is about 0.8 C. This would shift the distribution curve just slightly to the right. Not enough to really affect the 2010 Moscow anomaly either way or make it more likely. If the model projections for global warming are correct with a large temp increase (due to possibility of enhanced effects...doubling CO2 levels by themselves will only raise the global temp a couple of degrees) then the shift will definately make 2010 events much more likely as they become normal events. The research I have done on the topic still indicates that blocking patterns caused this heat wave and the pattern would have taken place regardless of warming.
    0 0
    Response:

    [DB] "Not enough to really affect the 2010 Moscow anomaly either way or make it more likely."

    Based on what citation do you state this so authoritatively?

    "The research I have done on the topic still indicates that blocking patterns caused this heat wave and the pattern would have taken place regardless of warming."

    Then feel free to submit that research for publication in a reputable journal.  In the meantime, you continue to prosecute your agenda of selective cherry-picking & disregarding all evidence that doesn't conform to your preset view of things.

    Shorter response: you continue to waste the time of others here.  For now.  This will not last, however...

  6. Norman @50, the data source you link to is just the daily temperatures for July 2011. That is a small data set, and distorted high by global warming. More importantly, it is a daily mean. The July 2010 temperature often quoted for Moscow was a monthly average. That means while, assuming a normal distribution and no global warming, the probability of a Moscow 2010 heat wave is only 1 in 66,667 in a given year, the probability of a Bismarck maximum under the same assumptions, and using your data is only one in every 32,258 years. Of course, temperature records are not normally distributed. Accounting for that, and for global warming, Tamino shows that the average return interval of a Moscow style heat wave is 260 years given the current level of global warming, or close to 1 in every 1000 years without global warming. (Note that that makes the event 4 times more likely based on global warming, an independent confirmation of Rahmstorf and Comou.) The correct estimate of the temperature record for Bismarck requires a similar detailed analysis to that provided by Tamino, using more than a single months data. One thing we can be sure of, however, is that the result will (once again) show the event to be significantly more probable than the Moscow event. Finally, you still appear to be arguing that because you can role a '12' on a pair of standard dice, that shows you will not role '12's more frequently if you use a standard die, and a second die numbered '2' to '7'. Such an argument is a game effort in denialism, but is doomed to failure for anyone prepared to look at the data logically.
    0 0
  7. Norman#48: "the current amount of global warming would only increase the average a few degrees." Well, that's a start; despite the fact that it reveals a very basic misconception. The key word in that statement is global. Increasing the global - or even hemispheric - average temperature by 'a few degrees' is a lot of warming. But your fascination for individual location, short term records is more of the same 'I can't see it, so its not happening.' How does one month in Bismarck, ND equate to all of Europe showing a significant increase in the number of summer days much warmer than a 30 year average? The graphs here include your 1936 heat wave. At that time, approx 40% of the NH land area saw summers classified as 'hot' and very little area was classed as 'extremely hot.' Now we see approx 80% 'hot' and nearly 20% 'extremely hot.' What happened in Bismarck this past summer is just a tiny spot out of that land area. How can you continue to miss this point?
    0 0
  8. Norman#55: "The research I have done on the topic still indicates ... " OK, out with it. Trenberth, tamino, Hansen, R and C have all put their work on the table. Call: What cards do you have, other than your Bismarck ace-in-the-hole?
    0 0
  9. Norman, please, please go look at the Hansen graph that muoncounter linked to in #30. It demolishes your statement in #55, and I really would like you to understand that. The 'modest' global warming we have experienced has greatly increased the chances of seeing a 'hot' or 'extremely hot' spell of weather. That's not projected, that is from observations. We should hope that blocking patterns (whatever your 'research') don't materially increase in a warming world - Hansen's and R & C's work show that the increasing number of extremes needs no help...
    0 0
  10. Norman @48 and @55, you appear to working under several misconceptions. First, nobody is denying that meteorological, and major climactic events have the dominant role in day to day weather. There is a drought in Texas because of a La Nina event. There was a heat wave in Moscow because of a blocking event. Trivially, the probability of exactly identical heatwaves of blocking events occurring at exactly the same time without greenhouse gas forcing is almost zero (butterfly effect); but almost as trivially and far more importantly, La Nina's and blocking events would have occurred at very similar frequencies in the absence of GHG forcings. What is being claimed is that global warming influences the events that occur so that very high temperatures become more common than they once where. Second, you can approximate to the effect of global warming by simply adding the monthly value of the trend in global warming to the monthly or daily temperatures. This is a very crude approximation, but it does not lead you totally astray. Based on that, for example, John Nielsen-Gammon (state climatologist for Texas) argues that:
    "This record-setting summer was 5.4 F above average. The lack of precipitation accounts for 4.0 F, greenhouse gases global warming [edited 9/11/11] accounts for another 0.9 F, and the AMO accounts for another 0.3 F. Note that there’s uncertainty with all those numbers, and I have only made the crudest attempts at quantifying the uncertainty. But this will do until something better comes along."
    I would quibble that the drought was partly the result of the heat, so that some of the "drought contribution" is a secondary effect of global warming. But Neilsen=Gammon's position is perfectly reasonable. You could also as a crude model simply add the regional global warming anomaly to the Russian heatwave and say that that was the contribution of global warming. That contribution is not 0.8 degrees C, ie, the global anomaly, but closer to 1.8 degrees C (four decades of the decadal trend) for the Moscow region). But using the correct figures, the approach is not unreasonable. Using that approach, you would say that global warming added 1.8 C to the 6.67 degree C July 2010 Moscow anomaly, or 27%. However, leaving the analysis there seriously underestimates the effect of global warming on the return frequency of extreme events. For example, even a 0.8 degree C increase in mean temperatures represents a significant fraction of a Standard Deviation. For high Standard Deviation events such as those in the US in 1936 or Moscow in 2010, even a small increase in temperature can greatly increase the return interval. As an example of this, your state SD of the Bismarck record was 5, whereas, the actual value was 4.89. That 0.11 difference in SD increases the return interval by more than 70%. That is, a 0.67 degree C increase in temperature can increase the return inverval from 32,000 years to 56,000 years assuming normal distribution. For actual values found such as the Moscow event, the return interval can be increased from 1 in 260 year events to 1 in 1000 year events just by that small difference in temperature. Hence, using this crude model, the only logical conclusion is that global warming significantly reduces the return period of extreme temperature events. Finally, and briefly, it is not at all clear that the crude model is in fact warranted. There is evidence that global warming is changing the frequency and intensity of ENSO episodes (although the evidence is not conclusive). There are good logical reason to expect a non-stationary climate, ie, one significantly warming over time, to not be as well behaved as a stationary climate. These are areas around which there is legitimate debate. But without venturing into those areas, the conclusion you are arguing against follows directly from your own premises. And a final note about your 52, despite the many records set in the state, the map you show (as also the one from GISS) shows the highly localized nature of the very extreme heat. Further, I'll see your 17 states from 1936 and raise you 19 national records from 2010.
    0 0
    Response:

    [DB] Fixed html issues.

  11. muoncounter @58 and DB, Here are some of the sources of the blocking patterns argument. First comes from skywatcher's post 44 on the "Review of Rough Winds: Extreme Weather and Climate Change by James Powell" In Stu Ostro's presentation he shows how extreme weather is caused by numerous blocking patterns. skywatcher link in post 44. NASA research on blocking patterns. Old article on blocking patterns. abstract describes how blocking can lead to warming. blocking patterns. Tony Lupo to study blocking. There are many others all saying close to the same thing. Blocking patterns create much of the extreme weather we experience. Heat, cold, snow, rain (in the extreme). My point is not that absurd or farfetched and it seems all who study the phenomena are in agreement as to what it will do to regional weather. If it can be demonstrated that global warming increases blocking patterns, then it would logically follow that global warming will result in more weather extreme events. Otherwise it would just be factual that global warming will raise the avearge temperature and make things warmer. If the blocking patterns remain the same with global warming, I see no logical reason to assume more extreme heat waves (greater frequency). I would agree that the heat waves that do occur will be warmer (by a few degrees) than similar heat waves in the past.
    0 0
  12. "If the blocking patterns remain the same with global warming, I see no logical reason to assume more extreme heat waves (greater frequency)." Norman, your final paragraph in #61 seems to explain where you are going wrong. You seem unable to understand what happens when you shift a Gaussian distribution to the right. Tom Curtis in #61 does a good job in trying to explain. You do realise that the graphs in Hansen et al 2011, posted by muoncounter in #30, directly contradict your above claim, and that these are observations?
    0 0
  13. Norman#61: First of all, quoting a smattering of links is hardly deserving of the term 'research.' Second: Your NASA link on blocking? Stalled Weather Systems More Frequent in Decades of Warmer Atlantic The researchers observed the frequency of blocked weather events in the North Atlantic ... over the entire twentieth century and compared it to the evolution of ocean surface temperatures for the same area. They then removed the effect that global warming has on water temperatures, and found that decades with more frequent, recurring blocking events in the North Atlantic corresponded to those decades when the North Atlantic Ocean was warmer than usual, as it is now. Nothing there about global warming - by design. Your 'Abstract describes': Winters with clusters of more frequent blocking between Greenland and western Europe correspond to a warmer, more saline subpolar ocean. It's not clear from that whether blocking causes warming or warming causes blocking.
    0 0
  14. How about also considering that the effects of blocking patterns are more severe in a warmer world? (ie both more severe drought - higher evaporation rate, and more severe flooding - rain intensities are jigher so a prolonged pattern has greater effect).
    0 0
  15. “Climate change is likely to cause more storms, floods, droughts, heatwaves and other extreme weather events, according to the most authoritative review yet of the effects of global warming. “The Intergovernmental Panel on Climate Change will publish on Friday its first special report on extreme weather, and its relationship to rising greenhouse gas emissions. “The final details are being fought over by governments, as the "summary for policymakers" of the report has to be agreed in full by every nation that chooses to be involved. But the conclusions are expected to be that emissions from human activities are increasing the frequency of extreme weather events. In particular, there are likely to be many more heatwaves, droughts and changes in rainfall patterns.” Source: “IPCC expected to confirm link between climate change and extreme weather,” the Guardian (UK), Nov 17, 2011 To access the entire article, click here.
    0 0
  16. Suggested reading: “Monte Carlo versus blocking formations: why attributing heatwaves to climate change is still a gamble,” The Carbon Brief, Oct 27, 2011 To access this article, click here.
    0 0
  17. muoncounter @ 63 Here is a quote from the NASA link: "A series of connected changes begin because clusters of blocking events can divert the normal track of the storms crossing the Atlantic, which in turn can alter the twisting motion that the wind has on ocean waters, or wind curl. Depending on how wind curl works, it can speed up or slow down the large, circulating currents in the ocean known as gyres. When a blocking event reverses the rotation of the wind curl, the winds push against the direction of the whirlpool-like North Atlantic subpolar gyre, slowing its rotation. A slower, weaker gyre allows subtropical waters that would normally be trapped in the whirlpool-like flow to escape and move northward. "These warmer and more saline waters then invade the subpolar ocean and cause a series of impacts," said Peter Rhines, an oceanographer at the University of Washington, Seattle, and co-author of the new study. "They erode the base of glaciers, contributing to the melting of the Greenland ice sheet. And the change in temperature and freshness of the waters can alter subpolar ecosystems, too." The blocking pattern allows for warmer tropical water to move up north. The warmer water does not cause the blocking pattern. Your point: "It's not clear from that whether blocking causes warming or warming causes blocking." From my reading it seems it is farily clear that the blocking causes the warming. The enhanced warming may intensify the blocking but I can't find articles which make the case that warming is the cause of the blocking. Articles on blocking make the claim that a high or low pressure gets stalled by jet stream pattern. A high pressure system that stalls in an area will prevent clouds and rain from entering an area. Sunshine will dominate, the ground will dry and the temperature will rise above the normal. Do you have any links or articles that would support the possible idea that a heat wave causes a blocking pattern and not visa versa?
    0 0
  18. Norman#67: So its 'blocking' time again. This seems to be a very complex meteorological phenomenon, but let's see what we can learn from a few minutes with the google machine. Here's another snippet from the same NASA article: Blocking events occur when one of the jet streams ... pinches off large masses of air from the normal wind flow for an extended period. These kinks in the jet stream typically last at least five days but can persist for weeks. They can cause weather patterns to stall over one area and fuel floods, droughts, and other extreme weather events. Agreed, then, that 'a blocking event' causes stalled weather patterns; but this is apparently a short-term phenomenom. Do you associate a year-long mega-drought with events that last days to weeks? From Mendes et al 2008, Table 2 shows that Atlantic blocking events are most frequent in May and Sept (at a whopping 6% or 2 days per month); blocking in the Pacific southwest peaks in July/Aug at 27% (8 days per month) and Oceania peaks in July (25% or 8 days per month). From Barriopedro et al 2004: The long-term analysis in blocking frequencies has shown a downward (upward) trend in blocking days over ATL and EUR (WPA) sectors. ... These results suggest that those observational trends could be partially explained by simultaneous changes in the forcing factors responsible for blocking formation (ATL and WPA) and maintenance (EUR), respectively. ... regional modes have shown to modulate blocking occurrence through the anomalous TCP-associated temperature distributions. Thus, recent trends in surface temperature could be partially responsible for the observed trends in blocking occurrence. --emphasis added This paper also discussed blocking duration, producing a graph (their Fig 10) with the most commonly observed duration on the order of 7 days. If blocking frequency and duration are modulated by surface temperatures, it would be incorrect to conclude on the basis of superficial evidence that 'blocking causes warming.' If blocking formation responds to 'forcing factors,' then it is those forcings that must be investigated. Croci-Maspoli and Davies 2009, studying the European winter of 2005/6: ... the occurrence of the blocks was sensitive to, and significantly influenced by, the warm surface temperature anomalies upstream over the western Atlantic Ocean and North America. So the question appears to be: What's causing warm surface temperature anomalies?
    0 0
  19. “Maybe if the rest of the world understood a bit more about our experience authoring this report, they’d stop blaming us for trying to give warning to a warming world. Maybe then, they’d join in educating themselves about their own risks and prevent the worst.” Source: “Managing the Extreme Impacts of Climate Change” by Sabrina McCormick*, Culture of Science, Nov 18, 2011 *Sabrina McCormick is a lead author on the IPCC report, “Managing the Risks of Extreme Events and Disasters to Advance Climate Change Adaptation (SREX).” McCormick, PhD is Assistant Research Professor at George Washington University and Senior Fellow at the Wharton Risk Center. She is also President of Evidence Based Media.
    0 0
  20. @Rob Painting: Second sentence of initial paragraph: "(IPCC))" should be "(IPCC)"
    0 0
  21. John Hartz - typo fixed, thanks.
    0 0
  22. Suggested reading: “When should we blame climate change for natural disasters?” by Brad Pulmer, Washington Post, Nov 18, 2011 To access this informative article, click here Pulmer’s article nicely supplements Rob Painting’s excellent post.
    0 0
  23. muoncounter @ 68 I found an online book that addresses your question: "Agreed, then, that 'a blocking event' causes stalled weather patterns; but this is apparently a short-term phenomenom. Do you associate a year-long mega-drought with events that last days to weeks?" Online book that answers muoncounter's good question. The blocking pattern starts the drought. Once a drought has started it has a tendency to become persistent. Ground has less moisture to supply that can result in rainfall with the right uplifting atmopheric front. Here is a detailed explanation of what caused the current drought in Texas. Texas drought explanation. One point this author Professor David M. Hillis brings up about Global Warming and Texas. "Will these long-term patterns continue in central Texas with increased global warming? There is considerable debate about that point, with different models showing different outcomes. A moderate degree of ocean warming is likely to increase El Niño events, which tend to make central Texas wetter. However, a major increase in temperatures could cause a shift in the Pacific jet stream, which supplies us with much of our moisture."
    0 0
  24. Also from that "Texas drought explanation" link: --- The one thing that is clear is that global warming will produce major effects on precipitation patterns. Whether that means that central Texas will become wetter, drier, or more variable is not yet entirely clear, however. To date, recent global warming seems to have made central Texas wetter, but a switch point in the climate could end that trend suddenly. The following graph from NOAA documents the reality of global warming, and how quickly and suddenly it is happening. ---
    0 0
  25. From the bottom of that page: Update, 8 August 2011: We are in record territory, with a poor long-term outlook The early 1950s drought lasted much longer than our current drought has existed so far, but the past year was worse than any single year during that five-year drought-of-record. ---
    0 0
  26. Norman#73: "Once a drought has started it has a tendency to become persistent." Well, that sounds like a positive feedback to me. From your online book: The presence of high pressure centers for long times, therefore, provides a primer for drought occurrence, but they cannot explain why dry periods survive much longer than the anti-cyclone from which they originate. "a detailed explanation of what caused the current drought in Texas." Your 'drought explanation' is actually more of that anecdotal evidence you seem to prefer: ... our 12-month running total will be at about half the previous record low for any comparable period since rainfall records have been kept. ... The early 1950s drought lasted much longer than our current drought has existed so far, but the past year was worse than any single year during that five-year drought-of-record. ... We have already had highs of over 100 for 73 days this summer, with highs of 110 the past few days. The live oaks across the ranch are mostly leafless, and the post oaks, blackjack oaks, and Texas red oaks are brown and look like winter. Yep, that's extreme; it certainly debunks your 'this is nothing unusual' from prior threads. BTW, the author is a professor of biology. What was the point of that reference? No, the key question remains unanswered: What's causing warm surface temperature anomalies? Do you deny that has anything to do with global warming?
    0 0
  27. muoncounter @76 "No, the key question remains unanswered: What's causing warm surface temperature anomalies? Do you deny that has anything to do with global warming?" At least some of the warm surface anomalies would likely be caused by carbon dioxide redirection of Long wave radiation, so I am not denying this condition. The point I am making on this thread is that I am not sure you can use normalized distribution when dealing with extreme temperatures Random Variable.. The reason I am questioning the use of a Gaussian distribution is because I am not sure extreme temperatures fall under the concept of random variables. When rolling a pair of dice, the outcome of the previous roll has no bearing on the current roll. Each roll is independent of any other roll and they are then true random variables. With extreme temperatures, what happened the day before has a huge bearing on what will happen today and the following day. With heat waves, the temp tends to build up over a period of time (lack of clouds and rain during the day) until reaching an equilibrium that is much warmer than the normal temps for that region. The hot day keeps the air warmer at night and allows the following day to become much warmer as well (as long as no fronts move in). That is why I am not sure it is valid to use normal distribution to calculate odds of extreme temps based upon a shift in the Guassian bell curve. That is why I am suggesting alternate approaches to determine the likelihood of extreme heat waves. I think the probablility of a heat wave taking place may be better determined by calculating the probability of a blocking pattern forming and then determining the odds a drought will become persistent which will help generate a very extreme heat wave.
    0 0
  28. skywatcher @ 62 "You do realise that the graphs in Hansen et al 2011, posted by muoncounter in #30, directly contradict your above claim, and that these are observations?" I have looked into those graphs and I do not understand how they have 2011 for US about double 1936 for extremely hot. I will agree the eyeball is not the most accurate measuring tool but it can still easily distinguish areas that are twice the size of another. source. The 2011 grpah of the 2 to 4 C positive anomaly for the US does not look to be twice the size of the 1936 anomaly of the same temp range.
    0 0
  29. Norman &77- "The reason I am questioning the use of a Gaussian distribution is because I am not sure extreme temperatures fall under the concept of random variables" Rahmstorf and Coumou (2011) demonstrate that both global temperatures and Moscow July temperatures follow a Gaussian distribution. That comes about by doing the math, not by repeated handwaving. If you have some scientific literature that supports your notion, then post it here, otherwise your continued handwaving is tantamount to trolling.
    0 0
  30. Norman @77, Rob Painting @79, Tamino performed a detailed analysis the Moscow July temperature record and showed that the temperatures did not follow a normal distribution. In particular, he claimed that by performing a Quantile-Quantile (Q-Q) plot it is possible to determine if a distribution is normal by the fact that it will plot as a straight line. The upward bend above one standard deviation shows that warmer events are more common than we would expect from a normal curve. Taking the measured statistical properties into account, Tamino calculated a probability of the Moscow 2010 heat wave of 1/260 chance per annum assuming global warming, and close to 1/1000 without it. In other words, Tamino has clearly taken into account Norman's concern, and shown that global warming has made such events significantly more probable. Even this must be taken with a grain of salt, however. Because no event even close to Moscow 2010 is on record (in Moscow), we do not have statistical evidence showing that the divergence which makes warm events more common than the normal distribution will predict is not reversed at even higher levels. Indeed, we know it must be. Any standard statistical distribution will have an infinite tail, indicating that though 3,000 C days are very rare, they are possible. Cearly that is just as much nonsense as an expectation of rolling 19 on three six sided dice. So very extreme events such as Moscow 2010 may be even rarer than Tamino indicates, but are unlikely to be more common. Further, even if the distribution is not gaussian, shifting the temperature to the right will significantly increase the probabilities of warmer events unless the probability distribution is constant with increasing temperature. That is very clearly not the case - 50 degree C days are not as common as 40 degree C days in any part of the world. Norman ignores the significance of global warming on probability distribution, therefore, on no basis at all.
    0 0
  31. Rob Painting @ 79 I did generate a post to show (with math) the point I was making but the post did not get through moderation. I chose a station with 10 years of data to get a longer term standard deviation and then demonstrate that extreme heat waves do not follow the rules of random variables and demonstrate that these data points are not random variable by the definition of such. Normal distribution requires that the varibles be random.
    0 0
    Response:

    [DB] Since others have already touched upon this there is no need to rehash the whole thing...but it must be reiterated:

    • nothing statisically useful can be learned from a 10-year trend of temperatures in a geographic datapoint of 1
    • nothing statistically useful can be learned by comparing 1 datapoint in time far removed from the first 10-year trend as there is simply no context for the comparison
    • you do not show the statistical significance of how looking at 1 geopgraphic datapoint (1 station's set of data - in an extremely truncated dataset) says anything about global trends (the subject of the OP)
    • you continue to ignore guidance about not cherry picking data by continuing to ignore using the full set of data available (something that climate scientists do all of the time); it is hard work that cannot be avoided in order to prove your point. 
    • Without the context of using the whole data range covered by the global datasets you will never be able to mount a coherent case that may withstand scientific scrutiny.

    As such your comment then simply amounted to further wasting the time of others, so it was moderated out.

  32. Norman, Your point that temperature data is autocorrelated is recognized by everyone. You have discovered something that everyone else already knows. Tamino discusses autocorrelation all the time. I read your deleted post. You use only 10 years of data at a single location(!!) for your average. Hansen (2011) use 30 years of data averaged over 250 km for their average. It is well known that short temperature records can have large variation. Can you provide a reference showing that a single ten year record of temperature is a Gaussian distribution? You then compare the highest single days from the hottest year to your average. Hansen compares the average temperatures over a three month period. If you look at single days you get a different result than if you look at the entire summer average. You then claim autocorrelation is significant without further analysis of the statistics. It is up to you to provide evidence of yor claim. Since you do not know how to show if autocorrelation in the hot years is significant, you need to learn statistical analysis or stop trying to make the argument. Take your issue to Climate Audit where they claim statistical knowledge and see if they can find a problem with the analysis. Do not bother putting up a cherry picked analysis of a single cities data over a short time period.
    0 0
  33. Norman#78: "I do not understand how they have 2011 for US about double 1936 for extremely hot." Consider looking at the Northern Hemisphere Land graph (lower left), rather than just the US (lower right). Then note that the maps you produced include the oceans (LOTI=land ocean temp index); you are comparing that to 'land only.' Look at the GISS US-only average temperature anomaly data;
    1936: 0.134, 2010: 0.497, 2011: 0.477. Perhaps a bigger question is this: If you do not understand something, do you automatically assume it isn't true?
    0 0
  34. Here are the salient points from tamino's Extreme Heat analysis referenced by Tom Curtis: ... the bottom line is that every degree Celsius increase in mean July temperature in Moscow, roughly doubles the chances of any given extreme heat wave. In fact Moscow temperature has increased as much as 3 deg.C since the early 20th century, and according to the extreme-value approximation model I computed, this makes a given extreme 8 times more likely than before. Without global warming, Moscow’s July 2010 would have been one for the history books. As global warming drives average temperatures even higher, present citizens of Moscow are likely to see multiple such events in a single lifetime. Which is scary. That post is well worth some study for anyone struggling with the notion of increased probability of extreme events.
    0 0
  35. A commenter in tamino's Extreme Heat post referred to Barriopedro et al 2011: The Hot Summer of 2010: Redrawing the Temperature Record Map of Europe. Increasing greenhouse gas concentrations are expected to amplify the variability of summer temperatures in Europe. Along with mean warming, enhanced variability results in more frequent, persistent, and intense heatwaves. They also note that despite increasing overall probability of additional heatwave, the 2010 heatwave was so extreme it is not very likely to be repeated in the near term. I suppose some will translate that observation into yet another 'what global warming?' headline: Forecast: Smaller chances of record-breaking heatwaves!
    0 0
  36. muoncounter @ 83 "Perhaps a bigger question is this: If you do not understand something, do you automatically assume it isn't true?" I hope you don't believe I do this. I hate to automatically assume anything. I did look at all four graphs you posted. I saw on the United States graph that the 1936 heat wave was far less prominant than the 2011 heat wave in area covered (for extremely hot). Your graphs are on summertime hot area percentage. 2011 US shows 2011 summer as extremely hot in an area covering a bit more than 20% but the 1936 heat wave is shown only to cover around 10% of the area. I went to the GISS data base to investigate this and it did not seem the two graphs match. I took out the ocean temps (just land) and I lowered the smoothing to 250 km to check again and I still do not see that the 2011 summer covered twice the area for extremely hot temperatures as 1936 summer. The data set you included in your post was for the whole year. 1936 had one of the coldest winters on record so the overall temperature for the year was not that great. The graphs you posted are for summer time hot areas and have no bearing on the entire year. source. source. Even with these revised maps (no ocean temp included and better resolution on smoothing) I still do not see an area twice as large for extremely hot in 2011 summer as compared to 1936 summer. So I guess I still do not understand how the United States percentage graph, in your post at 30, was generated.
    0 0
  37. michael sweet @ 82 I was looking at the month of July averages (not single days). I was not making an attempt with that post to any larger scale phenomena. I was using this data set to get a longer period standard deviation (over 350 points of data). The goal was to demonstrate (I guess autocorrelation.) that temperatures were not random under heat wave conditions and so normal distribution was not an effective way to determine probability. A reference that may convince you is found in the muoncouter post 85 link to the Barriopedro 2011 paper. In it they show how the heat wave slowly grew in time (the previous condition influenced the following conditions...this is not a random sample when this takes place). Also from that paper: "The most evident features associated with the 2010 event were (i) quasi-stationary anticyclonic circulation anomalies over western Russia (fig. S5) and (ii) deficit of January-to-July 2010 accumulated precipitation and early spring snow cover disappearance in western-central Russia (fig. S6). High-pressure systems are well-known to produce warm conditions at surface by enhancing subsidence, solar heating, and warm-air advection (19–21). The lack of water availability results in a continuous reduction of soil moisture and enhanced sensible heat fluxes that exacerbate the strength of summer heatwaves (20–22)." With normal temperature fluctations which would fall under random events, today's temperature will not have a great effect on the temperatures of a few weeks. A cold day today will not determine if it is still cold in a week (various random weather events of moving warm and cold around will be much more influential). But with the heat wave it is a pattern that will continue to heat as long as the pattern remains in place. Each warm day will build and make the continuous days warmer. The temperatures are connected and influence each other. I am not sure how these can then be considered random temperature fluctuations which would follow the normal distribution.
    0 0
  38. Norman: I reviewed your prior posts and I am going to remove myself from this discussion. I see no point in discussing data with someone who does not know how to look at data. For example, in your post 86 above you show two graphs which are clearly labeled [degrees C] anomaly and then you conclude "I still do not see an area twice as large for extremely hot in 2011 summer as compared to 1936 summer". Extremely hot is a designation of a variation of standard deviation. It is impossible to look at a graph of anomaly and reach an understanding of standard deviation. It has been pointed out to you previously on this thread that anomalies and standard deviations are different. If you cannot read the graph, accept that Hansen did it correctly and in 2011 there was twice as much "expremely hot" as there was in 1936. The hot areas were hotter in 2011 than 1936 (although they were similar in extent), the data proves you are wrong. If I look at a table of watermellons and I conclude that all oranges are the same, how far have I advnaced the discussion? You must understand statistical arguments to argue statistics.
    0 0
  39. Michael @88, "I reviewed your prior posts and I am going to remove myself from this discussion. I see no point in discussing data with someone who does not know how to look at data." You are not the only one Michael. Rightly or wrongly, I gave up trying to discuss the science and statistics with Norman a long time ago.
    0 0
  40. Michael & Albatross, although I have long been convinced that Norman's "objections" are not genuinely felt, and only raised to raise doubt, never-the-less visitors to this sight who do not have a background in statistics (which I suspect is most visitors) could be deceived by his claims, particularly if they do not see clear rebuttals. This is the old conundrum. As the purpose of this site is education, if we do not limit the posting of trolling comments, of necessity we must feed the troll by rebutting them. It is tiresome and frustrating, but no amount of moderators typing "DNFTT" will remove the conundrum.
    0 0
  41. Norman#86: "I hope you don't believe I do this. I hate to automatically assume anything." Over the course of multiple threads, that is how your responses read. It appears that if you cannot duplicate in a few minutes work the published results, you dismiss them. An alternate reaction would be to consider that your methods and your data sources are not as complete as those of practicing climate scientists. If you took that approach, you might conclude that there is much to be learned. For example, I referred you to tamino's Extreme Heat post. Have you read it? If so, why are you still wed to the idea that if temperatures aren't normally distributed, we cannot identify an extreme event? With that preconceived notion, one could conclude that all is right with the world. Without that bias, one could conclude as tamino does (with the advantage of far greater understanding and abilities in statistics than both you and I), that there is much to be concerned about.
    0 0
  42. @Tom Curtis #90: Banning Norman from posting on SkS will eliminate the problem. If trolling is not prohibited by current SkS Comment Policy, then the policy should be amended to include such a prohibition.
    0 0
  43. John Hartz @ 92 Would that not make SkS an echo chamber? I do supply data for all may posts (graphs, articles). I do read the articles in posts gradually (lots of data). I do learn a lot from the highly knowledgable individuals on this sight. How does backing up my conclusions (even if somewhat different than the OP's conclusions) with data count as trolling? I am never claiming to be right or correct in my conclusions. Most think they are wrong. I think I was banned from SkS for a period of time. If that is the wish of the those running the website, it is their property and I am a guest poster. If my posts are highly offensive in nature (not sure why they would be) then I guess I should be banned. My goal is not to generate highly offensive posts. I do not insult the intelligence of any posters, I try to raise questions and ideas that come to me and it is an evolving process. I react to what other posters have said about an aspect of my posts. I start to do research on their points to see what I can find. It helps me to learn alot. It may frustrate many, sorry.
    0 0
  44. michael sweet @ 88, You may no longer respond to my posts. Your claim: "It has been pointed out to you previously on this thread that anomalies and standard deviations are different. If you cannot read the graph, accept that Hansen did it correctly and in 2011 there was twice as much "expremely hot" as there was in 1936. The hot areas were hotter in 2011 than 1936 (although they were similar in extent), the data proves you are wrong." This may suprise you but I actually do know the difference between anomalies and standard deviation. I have calcualated various standard deviations of data sets. A meausre of variability away from the mean. Data sets with larger ranges will have larger standard deviations. But generally very high temp anomalies will tend to be far from the mean. You state the data proves me worng. You also claim that the hot areas were hotter in 2011 than 1936. source. source. I went found the square area of the states that display record warmest temperatures. (I will assume that record warmest temp should fit the extremely hot criteria...If you want to compare temperatures from 1936 you can go to the source of the graph I posted in 43, many state records are still standing today from 1936), States that were listed as record warmest in 1936 (Montana, South Dakota, Nebraska, Iowa, Illinois, Indiana, Kentucky): Total Area of these states: 492,761 square miles. States that were listed as record warmest in 2011 (New Mexico, Texas, Oklahoma, Louisiana): Total Area of these states: 511,908 square miles. This is about a 3.7% difference.
    0 0
  45. michael sweet, I did further research on the temperatures above average. Unless you believe that the overall summer temps are much more variable in South Dakota than Texas, then the temp above average will indicate the standard deviations past the mean. (If I can find a long list of summer temps I can actually calculate the standard deviations for the state...The NOAA graphs above list all the states average temps for a given year but I do not have enough time to generate 100 graphs to determine the summer standard deviations for Texas and South Dakota. Using this source. I am able to determine how much above the avearage 1936 and 2011 were for select states. Average South Dakota (this is where the anomaly for 1936 was greatest) summer temp is 69.9 F. In 1936 the average temp was 76.8 F. The departure from the mean was 6.9 F. Texas average summer temp is 81.1 F. In 2011 summer the temperature was 86.7 the departure from the average is 5.6 F (Oklahoma in 2011 was 7.2 F warmer than average while Nebraska was 6.0 F above normal)
    0 0
  46. Norman, the area of the US that was Hot in 1936 was 92%, compared to 75% in 2011. The area that was Very Hot was 32% in 21936, compared to 25% in 2011. The area which was Extremely Hot was 8% in 1936, compared to 22% in 2011. That is the information you claim to have contradicted. However, in "contradicting" that evidence you have: a) Consistently focused on the contiguous states of the United States, whereas the Hansen data is stated as being for the United States (and hence including Alaska and Hawaii). b) You have persistently focused on temperature anomaly instead of the standard deviation. Hot is defined as > 0.43 standard deviations, Very hot is > 2 standard deviations, and Extremely Hot is > 3 standard deviations. Because temperature varies more at high latitudes than at low, an equivalent variation in anomaly in more northerly states will result in a lower increase in terms of standard deviations compared to the same variation in more southerly states. As the heatwave was in more northerly states than southerly in 1936, and the reverse in 2011, it follows that a simple comparison of anomalies cannot test Hansen's claim in any way. Indeed, that fact makes it more likely that Hansen's claim is correct. That is, to the extent you are showing anything, you are confirming rather than contradicting Hansen. c) Whatever confirmation exists is minimal, however, because neither an anomaly nor a record is a variation measured as a standard deviation. Absent evidence of the standard deviation of temperatures of the various sites, the anomaly information cannot contradict or confirm Hansen's claim. Finally, d) the maps you have shown have all employed a mercartor projection which exagerates the size of northern states relative to southern states. It is absurd, therefore, to think a simple eyeball comparison can tell you which area is larger if they are at all close. So, although you claim to know the difference between an anomaly and a standard deviation, you act as though you don't. Either you do not understand what you think you know, or you are being deliberately deceitful.
    0 0
  47. So by #95, you're still failing to distinguish anomalies from extremes, despite claiming to know the difference. Well done Norman. And of course you're diverting attention away from the global analysis by Hansen et al which empirically shows you to be wrong on the increase in extreme events. You haven't produced the statistics to support your assertions about the US, which in this case would need to cover all the US, giving # standard deviations from the mean. That's pretty poor, really.
    0 0
  48. Norman @95: 1) The variability in temperature increases with higher latitude, so yes, "verall summer temps are much more variable in South Dakota than Texas" unless something very unusual is going on in either North Dakota or Texas. As Texas is coastal, and North Dakota is not, that is another reason to expect greater variability in North Dakota. Why is it that when you gain a little piece of knowledge that appears, with your limited information, to contradict an expert in the subject, that you automatically assume the expert is wrong. It would be wiser, and considerably less arrogant to assume the expert may know some other relevant fact that you don't. 2) To compare with Hansen's graph, you need to use the anomaly over the "period of climatology", ie, 1951-1980. Comparing to the mean of some other period makes it an apples and oranges comparison.
    0 0
  49. Well said Tom #94, To add to poor eyecrometer use, the maps presented by Norman in '86 are in equirectangular (geographic) projection, which vastly exxagerates far northern areas and is definitely unsuitable for eyeballing. On a side note, I wish Hansen would not use it as it can be misleading to the eyeball (even though he has the correct statistical analysis).
    0 0
  50. Norman#94: Simply taking the area of a state and assuming all of the state is equally hot or extremely hot is a very flawed methodology. For example, Montana varies in elevation from 1800 ft to 12799 ft ASL; do you think that all of that large state's area was 'record warmest'? Is 'record warmest' the same as 'extremely hot'? Again you have demonstrated the same MO: If you cannot duplicate the work of an expert analysis on the back of an envelope, the experts must be wrong. When was the last time you flew in an airplane - do you try to duplicate the blueprints and schematics before boarding? Do you verify the flight plan? What is there about the possibility that Hansen et al are right that is so disturbing to you?
    0 0

Prev  1  2  

You need to be logged in to post a comment. Login via the left margin or if you're new, register here.


The Consensus Project Website

THE ESCALATOR

(free to republish)


© Copyright 2024 John Cook
Home | Translations | About Us | Privacy | Contact Us