Climate Science Glossary

Term Lookup

Enter a term in the search box to find its definition.

Settings

Use the controls in the far right panel to increase or decrease the number of terms automatically displayed (or to completely turn that feature off).

Term Lookup

Settings


All IPCC definitions taken from Climate Change 2007: The Physical Science Basis. Working Group I Contribution to the Fourth Assessment Report of the Intergovernmental Panel on Climate Change, Annex I, Glossary, pp. 941-954. Cambridge University Press.

Home Arguments Software Resources Comments The Consensus Project Translations About Support

Bluesky Facebook LinkedIn Mastodon MeWe

Twitter YouTube RSS Posts RSS Comments Email Subscribe


Climate's changed before
It's the sun
It's not bad
There is no consensus
It's cooling
Models are unreliable
Temp record is unreliable
Animals and plants can adapt
It hasn't warmed since 1998
Antarctica is gaining ice
View All Arguments...


Username
Password
New? Register here
Forgot your password?

Latest Posts

Archives

Patrick Michaels: Serial Deleter of Inconvenient Data

Posted on 17 January 2012 by dana1981

Patrick Michaels is a research fellow at the Cato Institute think tank, the chief editor of the website World Climate Report, has been given a climate blog at the business magazine Forbes, and his articles are frequently re-posted at climate "skeptic" blogs like Watts Up With That (WUWT).  Despite his clear conflict of interest (Michaels has estimated that 40% of his work is funded by the petroleum industry), many people continue to rely on him as a reliable source of climate information.  This is an unwise choice, because Michaels also has a long history of badly distorting climate scientists' work.  In fact, not only does Michaels misrepresent climate research on a regular basis, but on several occasions he has gone as far as to manipulate other scientists' figures by deleting parts he doesn't like.

Patrick Michaels is a serial deleter of inconvenient data.

Hansen 1988

Skeptical Science has previously documented the most high-profile example of Michaels' serial data deletions, which involved James Hansen's 1988 study projecting future global warming.  James Hansen is a scientist at the NASA Goddard Institute for Space Studies (GISS), and one of the world's foremost climate scientists.

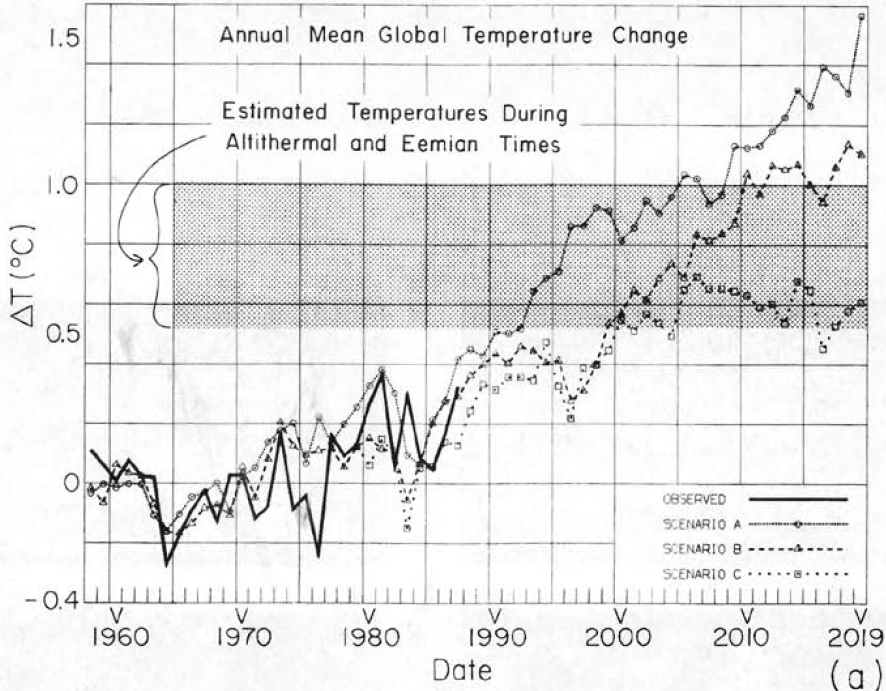
Climate scientists aren't in the business of predicting how human greenhouse gas emissions will change in the future - that is a policy question.  Instead, climate scientists predict how the climate will change in response to a series of possible emissions scenarios (for example, continuing with business-as-usual emissions, dramatically cutting our emissions starting in the year 2020, etc.).  In 1988, Hansen used the NASA GISS climate model to predict how the planet would respond to three possible scenarios.  Scenario A assumed continued exponential (accelerating) greenhouse gas growth.  Scenario B assumed a reduced linear rate of growth, and Scenario C assumed a rapid decline in greenhouse gas emissions around the year 2000.  Hansen believed Scenario B was the most likely to come to fruition, and indeed it has been the closest to reality thus far.  In the summer of 1988, Hansen presented his results in testimony before U.S. Congress.

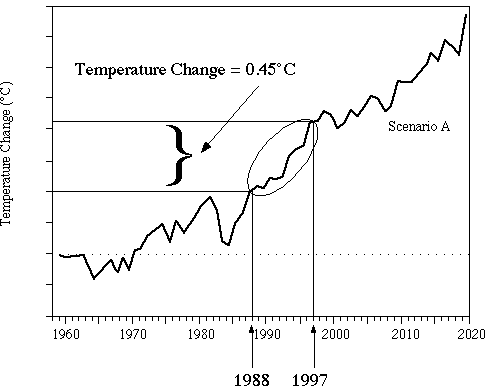
Ten years later, with the Kyoto Protocol international agreement to reduce greenhouse gas emissions in the works, Patrick Michaels was invited to testify before Congress about the state of climate science.  He spoke of Hansen's 1988 study, and in the process, grossly misrepresented its projections and accuracy by deleting Scenarios B and C, wrongly asserting that the planet had warmed "more than four times less than Hansen predicted." 

Original Version

Hansen 88 Figure

Michaels Version

Michaels Hansen Deletion

James Hansen had this to say about Patrick Michaels' distortion of his work:

"Pat Michaels, has taken the graph from our 1988 paper with simulated global temperatures for scenarios A, B and C, erased the results for scenarios B and C, and shown only the curve for scenario A in public presentations, pretending that it was my prediction for climate change. Is this treading close to scientific fraud?"

Michaels certainly didn't mess around with his first known case of data deletion, using it to mislead our policymakers as they decided whether or not to commit to reducing American greenhouse gas emissions (they ultimately refused to ratify the Kyoto Protocol).  Michaels' other data deletions, while being almost as misleading, were not made on nearly as grand of a stage.

Schmittner 2011

Another example of Michaels' serial data deletion involved a paper by Schmittner et al. last year which attempted to estimate the climate sensitivity - how much the planet will warm in response to a continued rise of greenhouse gases.  Schmittner et al. used geologic data to calculate the climate sensitivity based on the transition between the Last Glacial Maximum (LGM) and the current relatively warm interglacial period (approximately 20,000 years ago), and came up with an estimate towards the lower end, but within the likely range listed by the Intergovernmental Panel on Climate Change (IPCC).

However, there are two strong caveats associated with their results.  First, based on their interpretation of the geologic data, they estimated a smaller temperature change from the LGM transition than most previous studies, which was the main reason that their climate sensitivity estimate was relatively low.  Had they used a more widely-accepted global temperature change for the period in question, their climate sensitivity estimate would likely have been very close to the most likely estimate from the IPCC.

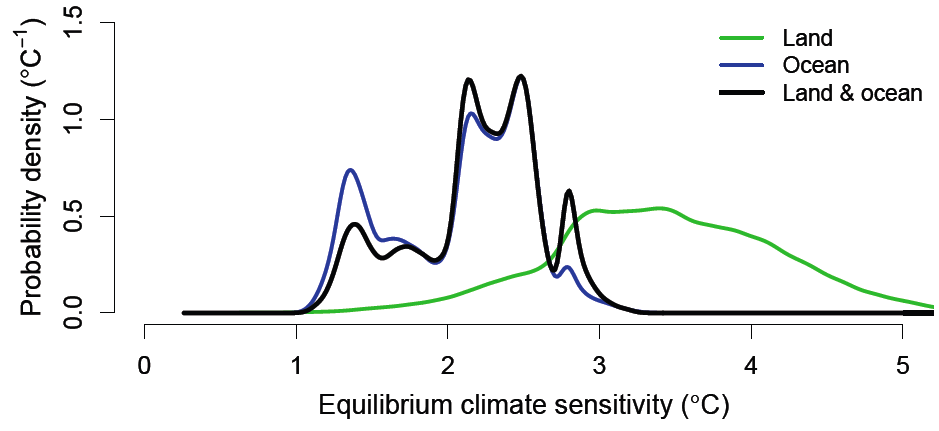
Second, and more relevant here, Schmittner et al. arrived at two fairly different results when they used ocean temperature data as opposed to land temperature data.  Their climate sensitivity estimate based on land-only data was significantly higher than with ocean-only data.  When they combined the two, the result was close to the ocean-only estimate, because the majority of their data came from ocean measurements.

This is an important caveat because climate sensitivity applies to the planet as a whole.  If different results are obtained from ocean and land data, then we can't be sure which is correct, and in fact many climate scientists are skeptical of the small LGM temperature change estimate, which is based heavily on the ocean temperature data.  Thus Schmittner et al. felt it important to include both estimates in the figures in their study.

However, it is very important for climate "skeptics" like Patrick Michaels that climate sensitivity be low.  This would mean that the planet will not warm as much in response to rising greenhouse gases, and we don't have to worry about reducing our emissions as quickly.  Thus as he did with Hansen's figure, Michaels deleted the inconvenient data from the figure in Schmittner et al., leaving only the combined estimate, which as noted above, is heavily weighted by the lower, ocean-based climate sensitivity estimate. 

Original Version

schmittner sensitivity

Michaels Version

Michaels Schmittner Deletion

On Planet 3.0, thingsbreak had an excellent interview with Nathan Urban, co-author of Schmittner et al., in which Michaels' distortion of his results was discussed:

"World Climate Report doctored our paper’s main figure when reporting on our study.  This manipulated version of our figure was copied widely on other blogs....I find this data manipulation problematic.  When I created the real version of that figure, it occurred to me that it would be reproduced in articles, presentations, or blog posts.  Because I find the difference between our land and ocean estimates to be such an important caveat to our work, I made sure to include all three curves in the figure, so that anyone reproducing it would have to acknowledge these caveats....I find the result of their figure manipulation to be very misleading...They intentionally took our figure out of the context in which it was originally presented, a form of “selective quotation” which hides data that does not support their interpretation...I find World Climate Report’s behavior very disappointing and hardly compatible with true skeptical inquiry"

Gillett 2012

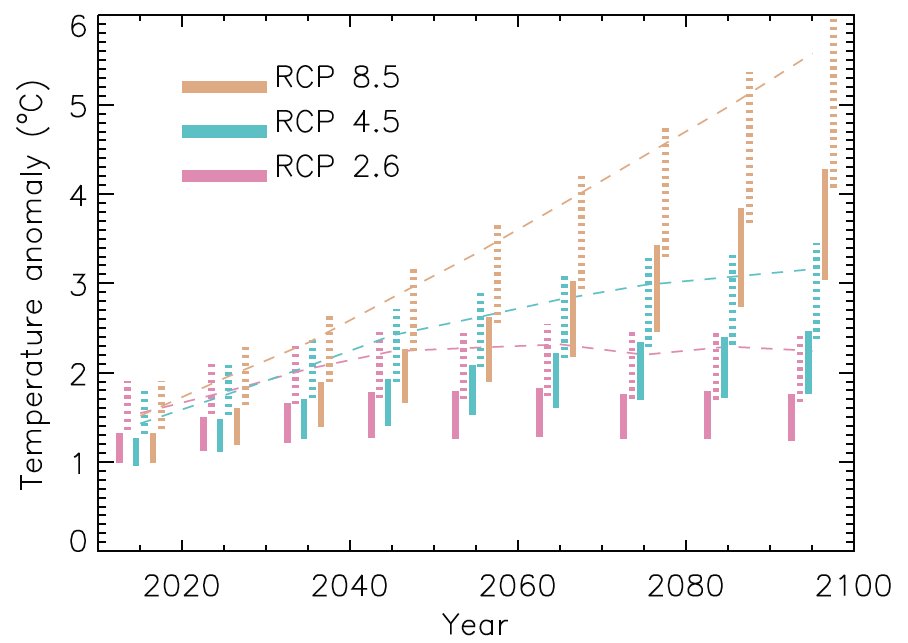
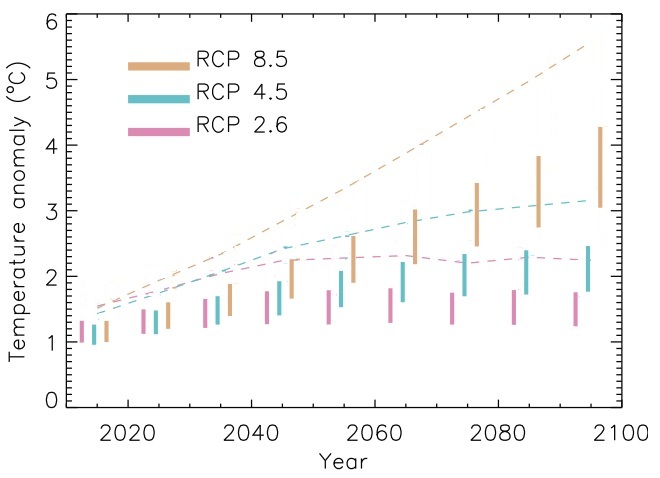
The latest example of Michaels' serial data deletion involves a recent paper by Gillett et al. which like Hansen (1988), projects future global warming in several different emissions scenarios.  However, Gillett et al. made three different projections for each scenario.  For the first projection, they simply ran their climate model to see how much global warming it would predict in each scenario.  For the other two projections, they scaled their climate model run based on observational temperature changes that they estimated from greenhouse gases and other influences over two timeframes, 1851-2010, and 1901-2000.

In their figure showing the results of these projections, they illustrated the results using the two different timeframes, because the results in each were markedly different.  When Gillett et al. constrained their model using the timeframe from 1851 to 2010, the model projected less warming than when they used the timeframe from 1901 to 2000.  

This is a very similar situation to Schmittner et al., in that using two different sets of data produced two fairly different sets of results.  Thus like Schmittner et al.,  Gillett et al. made a point to note the fact that their results were very sensitive to the timeframe they used, and included both results in their figures

But once again, the data projecting larger future global warming was inconvenient for Patrick Michaels' narrative, so he simply deleted it

Original Version

Gillette Projections

Michaels Version

Michaels Gillett Deletion

In these figures, the dashed lines in the horizontal direction are the projections from the unconstrained climate model for the three emissions scenarios (the RCPs).  The solid vertical lines are the model projections using the 1851-2010 data, and the dotted vertical lines (deleted by Michaels) are the model projections using the 1901-2000 data.

Deleters and Enablers

In every case discussed above, Michaels has deleted the data which contradict his constant arguments that the planet will warm less than most climate scientists expect, and thus that global warming is nothing to worry about.  Given his history as a serial data deleter, rather than being given so many platforms from which to spread his misinformation, Patrick Michaels (and certainly the World Climate Report website) should be considered an unreliable source of information.

This is a problematic situation.  There are a large number of people who simply don't want to accept the scientific reality that humans are causing rapid global warming.  However, this reality is accepted by the vast majority of scientific experts, because it is supported by the preponderance of scientific data.  Denial enablers like Anthony Watts, Forbes, and other media outlets have found a way around the first problem by giving fake skeptics like Patrick Michaels a platform to speak to those who are in denial about the science.  Patrick Michaels has found a way around the second problem by simply deleting the data which is inconvenient for his narrative, only presenting his audience with the bits of evidence which seem to support their denial, as long as the inconvenient data are ignored.

0 0

Printable Version  |  Link to this page

Comments

Prev  1  2  3  4  Next

Comments 51 to 100 out of 168:

  1. Graphs are just a way to visualize/present some data. Why are my options for presenting data limited to how someone else has decided to display the data? NCDC is a storehouse for climate data yet nowhere on the site are there rules laid out as to how to graph that data (bar charts, line charts, start dates, end dates, etc.). If I want to show a bet-fit linear regression through the U.S. annual data from 1980 through 2010 I can. If I want to show a quadratic fit to the data from 1910-1995, I can. If I want to plot it as a bar chart, I can. If I want to plot the data as a series of smiley face symbols, I can. If I want to show the results of a climate model fit to observed data from 1901-2000, I can. If I want to show the results of a climate model fit to observed data from 1851-2010, I can. I can do the same thing with data available from the UK Hadley Centre. And I can do the same thing for data that I can find in the literature. Obviously, the authors are free to combine whatever sorts of data into whatever kinds of plots that they want to, subject to the spatial limitations of journal that they have submitted the paper to and the whims of the reviewers. No one else, you all, or I, or anyone else, is bound by those same constraints. If I want to plot the data that corresponds to the paper’s abstract I can. If you only want to display 3 of the 4 panels included by the authors, you can. It is just data! If someone wants to argue that by showing different data, or portraying the data in a different fashion, that the story being told changes, then more power to them…after all, isn’t that why virtually all blogs exist—to tell a different story than someone else? Just because you introduce new data doesn’t mean that you get to set the one and only storyline or determine the one and only way that the data can appear in a plot. At WCR we presented the data in a figure that well-corresponded to the papers’ abstracts. The authors presented data in figures that corresponded to other aspects of their analysis. Someone else may come along and use or present the data for a different analysis. Such is the life of data. Use it as you may. If someone else doesn’t like it, you’ll most likely hear about it. As apparently I am doing now! :^) But to me, it seems a bit strange that we have come under such fire for presenting the data that illustrated the culmination of the research of both the Schmittner et al. and the Gillett et al. papers. So, perhaps, it is the primary findings of those papers that is really the heart of the issue. -Chip Knappenberger World Climate Report
    0 0
  2. Let's be clear here - the deletion of the inconvenient data from the figures in question is a microcosm of the Michaels/WCR posts about them. The posts made no mention that using different data (land temperature data in the Schmittner case and 1901-2000 data in the Gillett case) resulted in very different sensitivities/temperature projections. Omitting those key points makes for an inaccurate representation of the paper, both in the text and in the figures. Compare on contrast the SkS posts on these papers (here and here) to the WCR posts (linked in the OP above). It's clear which of us is trying to give a full and accurate representation of the papers, and which of us is trying to spin the results to support our positions. Coincidentally, I'm working on a follow-up post addressing Michaels' attempts to justify his use of Hansen's Scenario A only in his Congressional testimony. Suffice it to say, Michaels was very, very wrong to do so, and his new attempts to justify this behavior don't hold water.
    0 0
  3. 51 - So you're saying, in effect, that you don't understand science and anyone who mistakes your work as being science based has only themselves to blame. Fair enough.
    0 0
  4. I agree with Dana1981 that misrepresenting Hansen to Congress was very, very bad. So much so that I wandered over to WUWT, where Michaels put up an apologist piece about what he did (responding to this post) to share my opinion directly. A poster there, on the Gillett issue, pointed out that SkS routinely posts a graphic omitting some fairly important parts (the right hand side of the graph in the link - the part that explains how valid various estimates of sensitivity are. side by side graph from SkS and original paper I was at a loss to explain how that was materially different than what Michaels did with Gillett - is this a case of confirmation bias (the kind where it is OK if my guy does it, but not OK if YOUR guy does it?) In my humble opinion, what Michaels did with Gillett is over-reach - the paper itself can easily be spun to support the skeptic view point, but instead he overplayed his hand and deleted data. And what he did in Congress ought to be illegal. I am quite certain it is unethical.
    0 0
  5. Chip -the basic problem is you are presenting your modification of Gillett as Gillett - without the permission of the authors' that is just unethical (best case). And what Michaels did in Congress is way beyond merely unethical. Did you not expect to be held accountable? What do you think will happen when people realize what is really going on and we have reached a climate tipping point? Is your plan simply to be dead by then (natural causes, one hopes/expects)? This isn't going to end pretty for anyone. For those of you actively involved in deceiving those who will be deceived - what is it you expect? You are getting a tiny taste, on this site, where people chose not to be misled by people like you, of how people will react when all the information is on the table.
    0 0
  6. Dana @52, The apologist for Michaels (really, has Michaels lost his tongue?) is now tying himself in knots trying to fabricate a strawman argument and distract everyone from the root problem here-- doctoring someone else's data to further your agenda. I do not see the benefit of directly engaging someone who is so clearly duplicitous and disingenuous. There 'defense' amounts to, "but judge the witness would have not seem me commit the crime had they covered/averted their eyes". This repeated attempts to justify what amounts to, as noted by Hansen, treading close to scientific fraud got tiresome a very long time ago and only enforces Bernard J's excellent summation at all the more.
    0 0
  7. Now, Dana, les, and Albatross, you're coming close to questioning Chip's integrity. The comments policy here at SkS explicitly forbids calling someone's integrity into question even when (and I know this might sound crazy) there is evidence that, for example, someone is engaging in a systematic program to misinform both the representatives and voters of one of the most powerful democracies in the world. I doubt if such a person even exists. After all, what sort of bizarre story could he (or she) be telling himself each day in order to justify such behavior. I guess it could be the sheer joy of finally being employable that overcomes any ethical resistance. Anyway, tsk tsk tsk!
    0 0
  8. actually @54 - the difference is that we didn't delete any data from the Knutti and Hegerl graphic in question. It's a very large figure, and we have image width restrictions, so I presume the right side of the figure was excluded to make it more legible. The various climate sensitivity estimates in that figure are in very close agreement, so I don't see why the 'validity' (whatever the right side discusses, since I can't read it in your link) of each estimate is all that important. Interesting information, sure. Critical to the graphic? I don't think so. And omitting it is certainly not equivalent to deleting data from a figure. The main difference is that SkS always strives to present a full and accurate picture of the peer-reviewed scientific research, whereas WCR only strives to present the portion of the picture that can be interpreted to support their position.
    0 0
  9. Actually Thoughtful @54, I knew this would happen, they will now scour the pages of SkS trying to find examples of where SkS is alleged to have doctored graphics. But as I noted, by doctoring graphs repeatedly Michaels have lost whatever moral high ground they thought they might have held in the past. The example you showed does not support their assertions/accusations. If you look closely, the figure in question has two panels (a) and (b). Panel (a) was shown. The caption also clearly explains the meaning of the various aspects of panel a. The uncertainty associated with each estimate is clearly reflected in the width of the confidence interval shown in panel a. They are desperately grasping at straws and trying to defend the doctoring of key graphs by Michaels and/or distract people fro that inconvenient facts. And yes, I am surprised that Michaels misleading/deceiving Congress is not actionable. And one has to wonder why Upton turned a blind eye to the evidence presented to him by Waxman. There is a very good reason and evidence why Waxman wanted Michaels held accountable for repeatedly misleading Congress and the American people. It is a travesty that Michaels (and his apologists), have until this point at least, avoided being held accountable in the courts.
    0 0
  10. DSL, Knappenberger and Michaels are doing an excellent job of sabotaging their own integrity, without our help. In fact, they seem to do so every time they type or say something.
    0 0
  11. Oh yes, Albatross @59 is right. I didn't see that they were two different panels. Ideally sure, it would be nice to include every single figure and panel from every paper we discuss, but that's simply unrealistic. What we don't do is alter figures that we take from scientific papers to hide inconvenient data, and unlike WCR, we also strive to discuss the important caveats associated with the papers we discuss.
    0 0
  12. >>Graphs are just a way to visualize/present some data. Why are my options for presenting data limited to how someone else has decided to display the data? You are free to create whatever graphs you want, but you attributed your graph to the authors of the paper. That's what makes the graph misleading.
    0 0
  13. actually thoughtful, Let's say, for argument's sake, that in an appendix to the paper, Gillett et al. included the data that were used to produce all their figures in the paper. Would it then have been OK for anyone to use that data for additional analysis or to plot up as they saw fit? Why do you think that Gillett et al.’s decision as to which groups of data to show in which plots is sacred? If it were an obligation that data could only ever be displayed as it appeared in the original publication where it was introduced, the IPCC reports, for example, would look entirely different (as many of their figures are redrafts and/or combinations of figures/data from various sources (I see nothing wrong with that)). While data might be sacred, how it is displayed or used, is not. Sort of like the saying that you are entitled to your own opinions, but not your own facts. -Chip Knappenberger World Climate Report
    0 0
    Moderator Response:
  14. Chip's comment here pretty much gives the game away IMO: WCR isn't interested in presenting the science accurately to the public. Nope, it's about storylines! Misrepresenting Hansen's paper to Congress (was Michaels under oath for that part?) - why that's just presenting a different story!
    0 0
  15. @ Chip Knappenberger @ 51
    "At WCR we presented the data in a figure that well-corresponded to the papers’ abstracts."
    Wrong and undeniably wrong. As shown very clearly in the OP above. Adulterating the graphics provided by the authors of articles and passing them off as that of the author due to a demonstrated lack of the change by you is "being deliberately misleading and deceptive". That you can no longer perceive this truth so obvious to persons of conscience is telling, indeed.
    "So, perhaps, it is the primary findings of those papers that is really the heart of the issue."
    Still wrong. Despite your obvious agenda of handwaving and goal-post moving to the contrary, the issue is Patrick Michaels: Serial Deleter of Inconvenient Data. And also obvious to all but the most obdurate of fake-skeptics is that Pat is apparently unable to mount any defense here personally for his conduct and his publications that eradicate the line between duplicity and outright falsification. @ Chip Knappenberger @ 63
    "While data might be sacred, how it is displayed or used, is not. Sort of like the saying that you are entitled to your own opinions, but not your own facts."
    Very ironic that you end your prosecution of your agenda by testifying against yourself in the same breathe. QED. Suggestion to all: DNFTT
    0 0
  16. Chip @63 - you can take any data and make any graph you desire. Stick around on this site and you will see that both blog posts and comments include figures created, by the authors, with data they thought was relevant. And most would argue this is good and correct. What Michaels did, and you are attempting to defend, is manipulate a graph, and PRESENT it as the work of another, without their permission. In other words you made Gillett look stupid (or maybe you made them look like genius's - but what you didn't do is present your original work as your own - you stole Gillett's name. This is a textbook case of poor ethics. I wouldn't be surprised to FIND it in a textbook - it is that egregious. What part of this don't you get? What if I magically attained Michael's ability to present to Congress and I showed up tomorrow with a graph that Michael's once made, and erased everything on it except the part that would (without the rest of the information) be taken as incontrovertible evidence that the world was warming sharply and man was to blame and said - see, even Michaels knows the world is warming and the world is to blame? And then Congress passed a carbon tax set to take effect on February 1, 2012? That would be on par with what Michaels' did with Hansen's work, and continues with Gillett's. If you don't like the other side of the deal, it probably isn't a fair deal.
    0 0
  17. Composer @64, "Chip's comment here pretty much gives the game away IMO" I agree, as does this most bizarre assertion: "While data might be sacred, how it is displayed or used, is not." You have to be kidding me! But this is also a complete strawman as it does not speak directly tot the issue of deleting data and doctoring graphics already generated and then having the gall to try and attribute the doctored graphics to the authors who generated the originals. How data is presented is incredibly important. Gillett et al. presented their data in a particular way for a reason, they displayed those data on the same graphic together for a reason, reasons discussed in the text, reasons that Michaels chose to ignore. It is not for Michaels to decide to then doctor the graphic delete those inconvenient data that do not fit with his ideology and then attribute thew doctored graphics to the scientists who originally generated them. Drs. Urban and Hansen made it very clear that they objected to their graphics being doctored and that what was done to their graphics was highly misleading and unscientific. Hansen went so far as to say it was "treading close to scientific fraud". In other words the original creators of those graphics vehemently disagree with the lame justifications being made here. I think this recent spate of data fudging by Michaels is good cause to have him hauled before Congress to explain himself (and not have someone there speaking on his behalf as is happening here). Senator Waxman would be very interested in the latest developments.
    0 0
  18. 57 - DSL Not at all. I was making an observation based in the evidence, of which Chip has furnished as even more in 62... Very often one scientist will take the same data analyse in one paper and analyse it another was. The expectation is that they would say so, describe the new methods , give a comparison (with sone measure of significance) and have a discussion of the origin of divergences. That's what a scientist might think os as "having ones own facts" (assuming they didn't do any actual data gathering). They is clearly not what had been shown by the OP. What had been shown and described by Chip himself is, maybe, graphic design? Donno...
    0 0
  19. Dana and Albatross - thank you for clarifying. As a certified member of the choir, I understand why it was done, and don't think it changes the intent from the author's. However, here we are on a post taking Michaels to task for changing a graphic. The other side can point to a graphic SkS provided, and claim equivalence. We will say false equivalence. But the moral high ground has now tilted, and we find ourselves on a slope that, unsurprisingly, is slippery (THAT is a gish-gallop of metaphors right there!) Due to the existence of confirmation bias, the truncated Knutti graphic on this site will be enough to confirm for those who hold the belief that SkS does the same or worst that - SkS does the same. And even to my choirboy ears "we didn't have room" strikes me as somewhat hollow. I suggest SkS have the following policy ANYTIME a graphic is changed from the original 1) get the authors permission and/or 2) have the modified graphic linked to the original unmodified graphic, with an explanation below the graphic. Both 1 and 2 would be the best, and should be the goal every time. Alternatively, SkS could bow out of the "exposing the other guys" game - but I think it fits comfortably in the mission. I think it is an opportunity to step up our game. Full transparency AND the blessing of the original author is irrefutable (and something I strongly suspect Michaels could not achieve).
    0 0
    Response:

    [DB] The Knutti and Hegerl diagram in question is shown as Figure 4 on this SkS thread:

    http://www.skepticalscience.com/climate-sensitivity-advanced.htm

    The link to the source article (Knutti and Hegerl 2008), containing the original graphic showing both Panel A and Panel B (on page 4 of the pdf) is given immediately above Figure 4:

    K&H2008

  20. actually thoughtful@66, The caption associated with our graphic showing the results of Gillett et al. included the following: "(figure adapted from Gillet et al., 2012: note the original figure included additional data not relevant to this discussion)." FWIW, the additional data that we deemed not relevant to our discussion were the data were produced by Gillett et al. when using the incomplete 1901-2000 temperature series. I am not sure how you consider this stealing Gillett’s name? -Chip Knappenberger World Climate Report
    0 0
  21. To be fair, as Chip noted @70, the Gillett and Schmittner graphics were captioned as
    "(figure adapted from Gillet et al., 2012: note the original figure included additional data not relevant to this discussion)"
    and
    "adapted from Schmittner et al., 2011".
    Of course they never explained how the figures had been adapted, other than to say some of the data was "not relevant" in the Gillett case. By "not relevant" they of course meant "not convenient". As shown in our post on the Gillett paper, the results based on the 1901-2000 timeframe are very relevant to the paper and its conclusions (as James Annan also noted). Of course in the Hansen case, Michaels did not even bother to note that he had altered Hansen's figure. That is definitely the worst of the three, but the more recent two examples, while being lesser misrepresentations, are clear misrepresentations nonetheless.
    0 0
  22. actually thoughtful @69, Thank you for your suggestions-- I agree that we should strive to meet those goals that you mentioned. It is not always possible to link to the original (not all journals provide links to individual graphics), but one could cut and past the entire image and saves it as an image file here at SkS and link to that. More work, but best to try and do it right. I think I speak for my colleagues here at SkS when I say that SkS is a work in progress and we will continue to strive to improve, unlike Michaels we do not claim to be perfect or error free. We are only human and make honest mistakes sometimes. I dare say the same is not true for Michaels. I suspect that someone will be exposing more data tampering and twisting/distorting of other scientists' work by Michaels in the not too distant future. They certainly Michaels et al. are of the horribly misguided belief that what they did was perfectly OK and feel no inclination/obligation whatsoever to correct their posts and apologize to the authors and the journals-- despite the authors expressing their unhappiness with what was done.
    0 0
  23. Chip, I remind you that in the Gillett discussion, you agreed that using different timeframes in the Gillett analysis leads to different future warming projections. This is problematic, as James Annan notes:
    "[Gillett et al.] has a worrying discrepancy between the results obtained with 1900-2000, versus 1850-2010 data. Normally one would expect the latter to be broadly a subset of the former - more data means closer convergence to the true value - but the two sets of results are virtually disjoint, which suggests something a bit strange may be going on in the analysis (cf Schmitter et al with the land-only versus land+ocean results). But just a glance at the first figure shows a striking divergence between model and data over the first decade of the 21st century (compared to the close agreement prior to then). Something isn't quite right there."
    This is why Gillett (and Schmittner) included multiple temperature projections/sensitivites in the figures in question. This is why deleting some of those results is a misrepresentation of the research in its totality. Maybe the projections based on 1850-2010 constraints are correct. Maybe they're not (and there are good reasons to think they're not). When you only present the one result, you're ignoring the other possibilities, and thus misrepresenting the scientists' research as a whole. And in the associated posts, you didn't even mention the other results - your discussions were as if these other possible results didn't even exist.
    0 0
  24. More gems from Chip: The caption associated with our graphic showing the results of Gillett et al. included the following: "(figure adapted from Gillet et al., 2012: note the original figure included additional data not relevant to this discussion)." [Excerpt from the WCR blog post reviewing Gillett et al 2012.] FWIW, the additional data that we deemed not relevant to our discussion were the data were produced by Gillett et al. when using the incomplete 1901-2000 temperature series. Apart from the fact that the additional data deemed "not relevant" by the esteemed personages of the WCR was the data that flatly contradicts their comment - Both the Gillett et al. (2012) and the Michaels et al. (2002) studies show that climate models are over-predicting the amount of warming that is a result of human changes to the constituents of the atmosphere, and that when they are constrained to conform to actual observations of the earth’s temperature progression, the models project much less future warming (Figure 1). - because the omitted data contains projections also constrained to actual observations of the Earth's global mean temperature. A swing and a miss by Mr Knappenberger!
    0 0
  25. Composer99 @74, "A swing and a miss by Mr Knappenberger! The apologist who continues to uncritically defend Michaels (who is strangely absent from these deliberations)has hung himself by his own petard several times now. It is becoming embarrassing for him and by extension Michaels. I'm surprised that Pat hasn't urged him to stop posting. The entertaining show by Mr. Knappenberger is increasing traffic to SkS by quite a bit though :) So more and more people seeing the duplicity and disingenuity of WCR, as well as their complete lack of scientific integrity or ethics.
    0 0
  26. Not that you're responsible for Forbes, Chip, but it should be noted that no mention of adapting a figure was made in Michaels' post there. In addition, upthread was mentioned another example, where a figure legend explicitly negated Michaels' claim about it, yet was conveniently deleted from the figure. See comments under the post here for details. I do think this is real evidence of "serial convenient deletions". As I mentioned above, I know Michaels thinks he's "the good guy", but his actions show that he is more than willing to do what he accuses others of doing, "leaving out facts that would dilute the message". Projection is his profession, and he's darn good at it - but we should all be aware, or suffer the consequences for taking his view at face value.
    0 0
  27. As always, John Mashey has some interesting revelations. From Deltoid: "re: 33 See p.6 of Pals and check out the groups (boxes) and other links (lines) among people. Note that Knappenberger was student of Michaels and that U VA was sadly a hot spot, with Singer, Michaels, Davis, Knappenberger. Note orange box (George Marshall Institute) which connects many. If I ever update this, I'll add another box to cover Heartland. Counting only those who have been Contributing Editors/Authors for Heartland's Environment and Climate News, we have: Balling, Baliunas, Davis, Michaels, Singer, Soon. If we add others who've written for or quoted in E&CN, most of the rest of the pals are there. And, for one more graph of connections, see Weird Anti-Science, p.4."
    0 0
  28. Utahn@76, Not sure what the exact issue is regarding Pat’s figure in your linked Forbes article, but it seems to center around the fact that he didn’t include the USGCRP caption which some apparently thought was relevant because it added the caveat to the image that “The data shown include disturbances that occurred on the nation’s large-scale “bulk” electric transmission systems. Most outages occur in local distribution networks and are not included in the graph.” I’ll be the first to admit to not to know what constitutes the “bulk” transmission system, but according to the National Hurricane Center’s review of the impacts of 1995 hurricane Opal, “Opal downed numerous trees, knocking out power to nearly 2 million people in Florida, Alabama, Georgia and the Carolinas.”—that certainly seems like it would qualify as a “bulk” impact to me and it seems that a graphic showing ‘Significant Weather-related U.S. Electric Grid Disturbances’ would have included that event. So I don't think Pat's conclusion would be altered any had he included the caption...in fact, it seems as if it may even have been strengthened. I suppose I could step into Gavin Schmidt’s post-Climategate role and try to answer each inquiry that you all have about Pat’s presentation of figures—but just as Gavin’s effort didn’t do much to change the minds of the “skeptics” I doubt my service would change the minds of the folks here at Skeptical Science (if the current thread is any indication). -Chip Knappenberger World Climate Report
    0 0
  29. Chip, Included in your caption the following: "Both the Gillett et al. (2012) and the Michaels et al. (2002) studies show that climate models are over-predicting the amount of warming that is a result of human changes to the constituents of the atmosphere, and that when they are constrained to conform to actual observations of the earth’s temperature progression, the models project much less future warming (Figure 1)." As already pointed out, that statement could be made only by manipulating the graph to exclude the data inconvenient to that conclusion. Why don't you directly address this issue, as well as the other relevant ones, rather than making oblique comments to Gavin Schmidt and using the old line of "Well, I can't convince you anyway."
    0 0
  30. actually thoughtfull @54, as is quite clear from the figure presented by Daniel Bailey (moderator comment @ 69) it is quite clear that the supposedly elided information by SkS is actually a distinct figure, ie, figure 3 b of Knutti and Hegerl, 2008. That makes teh case quite distinct. There is no convention in science or public discourse that requires presenting all figures grouped together by the authors of an original work. In contrast, there is certainly a convention against doctoring graphs, and in particular a convention against doctoring graphs to remove relevant but inconvenient information has Michaels and Knappenberger have done. It should be noted that if we were to accept a more extended convention as apparently suggested by your interlocutor, then Michaels and Knappenberger are to be doubly condemned. In the cases of both Schmittner et al, and Gillett et al, the figures they doctored appeared as part of a multi-figure cluster (shown below), whose other components where not shown by Michaels. They have not been condemned by SkS for that. If your interlocutor wishes to condemn SkS for the Knuti and Hegerl example, do they also condemn Michaels and Knappenberger for this additional offense? And if so, how does that establish equivalency for SkS' behaviour, in that SkS has not doctored graphs as done by Michaels and Knappenberger? Scmittner et al, figures 3 upper and lower: Gillett et al, figures 3 a, b, c, & d:
    0 0
  31. Along these same lines as discussed by actually thoughtfull @54 and Tom @80, Chip apparently accused me of deception for including Gillett Figures 3b and 3d, but not 3a in my Gillett post. This rather floored me, since WCR did not include Figure 3a (or 3b) in their post. I had included more of the Figure 3 frames, and yet was being accused of deception by the person who included fewer of them. There seem to be a lot of rather desperate efforts to accuse SkS of malfeasance rather than face up to the malfeasance presented on WCR and WUWT. I believe this is described as "deflection" and/or "projection."
    0 0
  32. actually thoughtful, thanks for posting the link to my side-by-side depiction of Knutti and Hegerl 2008 and eliciting replies here. As I said on WUWT, I don't think removing part b (the boxes) is the same category as deleting lines (Hansen scenarios) from a chart without an explanation of what was deleted. But the boxes in part b of K&H08 have provide additional information over what is in the error bars in part a. K&H explain that part b is a qualitative evaluation. It is somewhat important for some threads where the K&H part a has been posted (although not all). I posted part b in the thread that DB linked to above: /argument.php?p=5&t=268&&a=115#63452 and figured that was adequate for raising the issue of what the boxes say about part a in one particular case (paleo). Obviously I can do that at this blog whereas nobody can respond to Michaels in a hearing or in an article so those should have higher standards.
    0 0
  33. dana1981, My intent was to point out the double standard, not deception. As you all should well know by now, I am not opposed to showing whatever data that you feel appropriate. -Chip (my smiley face at the end of my original post over at your other thread was snipped)
    0 0
  34. Chip, it's not a double-standard because I didn't criticize WCR for omitting one of the figure panels, I criticized WCR for deleting data from one of the figure panels. Two very different things.
    0 0
  35. Rob Honeycutt @41 "Chip said... If the figures bother you so much, just put your hands over them when reading the article, the take home message is unaffected. Or perhaps it might be advisable to cover both the graphs and the words at the same time. //sarcasm " Then the take home message truly would be unaffected. That Pat Michaels has no take home message! Interesting comments here from Chris. The voice of someone trying to justify actions that indicate a complete lack of any moral compass. Distorting information by whatever means to downplay AGW to the lay public is morally wrong. As simpe and as black-and-white as that. Chris just doesn't seem to get that this is a discussion about basic morality and the lack of it.
    0 0
  36. Eric @82, As noted earlier, you are grasping at straws, comparing apples with oranges and electing to miss the key point. Michaels doctored the figures, he removed inconvenient information from graphs (and ignored key text) that did not fit with his ideology. Additionally, he (going by your personal guidelines) also excluded certain panels from the Figures as shown by Tom, which you claim is a no, no. I suggest that you read Tom's post @80 very carefully and respond directly to the following: "If your interlocutor wishes to condemn SkS for the Knuti and Hegerl example, do they also condemn Michaels and Knappenberger for this additional offense? And if so, how does that establish equivalency for SkS' behaviour, in that SkS has not doctored graphs as done by Michaels and Knappenberger?" I agree with Dana that "There seem to be a lot of rather desperate efforts to accuse SkS of malfeasance rather than face up to the malfeasance presented on WCR and WUWT. I believe this is described as "deflection" and/or "projection.", and I include your efforts Eric to be amongst them.
    0 0
  37. dana1981, I think we have pretty well established that you see it as two very different things and I don't. So, with that impasse established, I think that we've about exhausted our useful time together in this thread. Thanks for having me here and I'll try to stop in from time to time in the future. Thanks again! -Chip
    0 0
  38. Good, Pat Michaels finally pulled the plug on this farce, saving his loyal administrator from further humiliation. The honourable thing to do here was to admit error, accept personally responsibility for his transgressions and apologize. Michaels failed on all three counts. Instead we have had Michaels admit no error in judgement or actions, take no responsibility or accountability for his misconduct, but instead delegate the administrator from WCR to come here and do damage control and try and justify the indefensible and obfuscate. Not surprisingly the defense effort was weak and transparent from the outset. IMO, and this may break the house rules, Michael's behaviour has been (-snipboth cowardly and immoral, and those of Chip duplicitous and disingenuous-). They make a fine team.
    0 0
    Moderator Response:

    [DB] Inflammatory snipped.

  39. The figure was not adapted from Gillett, et al., it was copied and altered without permission in a [- snip- ] way.
    0 0
    Moderator Response: [Rob P] You're going to have re-phrase your comment here - the snipped portion is a breach of the comments policy.
  40. Dana it's great to see you posting outside of Amazon. :)
    0 0
  41. I thought of taking a figure from a Michaels/Knappenberger paper and doctoring it as an example in order to show the opposite conclusion. I was thinking of a specific figure from Michaels et al 2000, purporting to show Philadelphia's increasing resistance to heat stress. I even got as far as drafting most of the figure, but was disgusted by the lack of source for the figure (I doubt Michaels did his own surveying for that figure!), and the lack of sources, quantitative analysis or justification for many unfounded claims in the surrounding text. It also felt very low deliberately altering someone else's work, even though the work was of a low standard in the first place. Maybe I should not have been surprised, and if anybody wants I'll finish the figure and show it as an example of how figure manipulation, say, to show how dropping a series here and there, or altering the time frame can wholly change the message taken from a figure. This is utterly different to using a whole panel, and individual panels frequently make individual points, or present specific data that is linked to, but distinct from, other panels. Panels may often stand on their own. Michaels and Knappenberger should be ashamed of their conduct; it is telling that they are unrepentant. As an aside, it's really hard to find truly original data in a Michaels paper!
    0 0
  42. Albatross, it all depends on what you omit, how you explain what you omit, and most importantly the context of where the graph is being used. I will repeat that I do not equate Pat Michaels editing within figures with the omission of K&H08 fig 3, part b. But in some cases here part b contained some important information (different base state, etc) that was not in part a but useful to a particular discussion. To mitigate that problem the link to K&H08 is included so people can look up all the details (not just part b of fig 3). That is pretty much standard practice here. One exception is the guide to skepticism http://www.skepticalscience.com/docs/Guide_to_Skepticism.pdf on page 8. There is room for part b, the question is whether it is too detailed for that guide. My only disagreement with Tom's post is that part 3b in K&H08 is not a distinct figure, as it lines up exactly with each sensitivity estimate. Part b would be meaningless without part a, and part a is made more meaningful by including part b. Thus the excerpting of fig 3d from the rest of fig 3 in Gillett et al is not equivalent as those pieces are independent. However, I completely agree with Tom that the alteration of figures, especially without mentioning the impact of the changes is not acceptable. I do not condone it nor equate it. A final note to Albatross, I did not "scour" the pages here. You can see from my link in post 82, I posted the omitted portion last September.
    0 0
  43. Eric @92, "However, I completely agree with Tom that the alteration of figures, especially without mentioning the impact of the changes is not acceptable. I do not condone it nor equate it." OK thanks for clarifying, but I think the words you cannot seem to find are "scientific misconduct". My statement about 'scouring' was a general remark that I made before I knew it was you who had fed the fodder to "skeptics" at WUWT (all I did was follow the link provided to the screen capture images). My point was that I suspect that some of them are doing just that as we speak, they have done so in the past and I assume this will be no different. "Thus the excerpting of fig 3d from the rest of fig 3 in Gillett et al is not equivalent as those pieces are independent" In that particular case you may be right, but as shown by Tom @82, that reasoning does not pass muster for what they did to Schmittner et al's Figure 3. In that figure, the top and bottom panels are intricately related and connected. So will you then at least, following your own standards, condemn Michaels for excluding the lower panel of Fig. 3 in Schmittner et al. (2011)?
    0 0
  44. Eric @82, One more thing. You claim that "I do not condone it nor equate it". Good, yet you somehow still felt compelled to make that post at WUWT in response to an OP in which Michaels tries to defend doctoring other scientists' figures (and removing inconvenient data and ignoring inconvenient text) and in the process makes several defamatory comments about Dana and SkS. Given by your own admission that your example and what Michales did are not equivalent, why for you then try and make the connection in your post at WUWT? The uncritical readers at WUWT no doubt lapped it up-- fodder for the skeptics. It seems that you were only too happy to try and create the impression that SkS routinely engages in deceptive activities when it comes to posting graphics. You have been posting here long enough to know that is not true. Something in your narrative does not add up, and quite frankly I find your actions on this particular issue have not been in good faith. I thought you were better than that.
    0 0
  45. Albatross, I don't consider WCR to be a scientific site. Can Pat Michaels writing in a blog or in an op ed be considered a scientist? I'm not sure how the lower part of Scmittner et al, figure 3 helps people understand the top part. But I can say that omitting land and not explaining the omission is not a "simplification" but a deceptive alteration.
    0 0
  46. I think we have pretty well established that you see it as two very different things and I don't. So, with that impasse established, I think that we've about exhausted our useful time together in this thread.
    Ah, the tu quoque fallacy, followed by the traditional flounce! Unsurprisingly, in the circumstances; few will be taken in by your absurd attempt to establish a false equivalence, and it really doesn't make you look good. You would have done better to face the inevitable and admit simply Michaels' wrongdoing from the start.
    0 0
  47. Albatross, my posts at WUWT were directed specifically at answering KR and Actually Thoughtful. However I did ask "how is that different from Pat Michael’s editing?" regarding the omission of part 3b. I now have my answer, it is different. You are of course welcome to go there and explain that or if you want me to, I will.
    0 0
  48. Eric @97, I do not post at WUWT-- do not like my IP address being tracked etc. I assume that you are referring to Fig. 3b of KH08. If you are prepared to go over there and set the record straight then please by all means do so. As for deciding which panels to inlcude from a figure that is subjective. For example we both have different ideas at to the relevance of panel 3b Schmittner et al. So given that subjectivity I'm not sure one can objectively and consisently apply that criterion/rule. Pleased to read that you agree that doctoring of graphics (and even text) as Michaels has done is deceptive.
    0 0
  49. Albatross I just wrote my followup post at WUWT, it's in moderation as normal.
    0 0
  50. To extend the baseball metaphor a bit further, I think Mr Knappenburger has thrown his glove in the dirt and gone home. Parsing some of his final comments anyway, we have: My intent was to point out the double standard, not deception. Except that in no way can it be shown that, say SkS has engaged in anything of the doctoring that WCR has. Omitting panels from a set of figures is not doctoring data, and WCR has no business suggesting a double standard is in play. As you all should well know by now, I am not opposed to showing whatever data that you feel appropriate. Good! I assume WCR will be accurately representing peer-reviewed literature referred to on its website going forward.
    0 0

Prev  1  2  3  4  Next

You need to be logged in to post a comment. Login via the left margin or if you're new, register here.


The Consensus Project Website

THE ESCALATOR

(free to republish)


© Copyright 2024 John Cook
Home | Translations | About Us | Privacy | Contact Us