Climate Science Glossary

Term Lookup

Enter a term in the search box to find its definition.

Settings

Use the controls in the far right panel to increase or decrease the number of terms automatically displayed (or to completely turn that feature off).

Term Lookup

Settings


All IPCC definitions taken from Climate Change 2007: The Physical Science Basis. Working Group I Contribution to the Fourth Assessment Report of the Intergovernmental Panel on Climate Change, Annex I, Glossary, pp. 941-954. Cambridge University Press.

Home Arguments Software Resources Comments The Consensus Project Translations About Support

Bluesky Facebook LinkedIn Mastodon MeWe

Twitter YouTube RSS Posts RSS Comments Email Subscribe


Climate's changed before
It's the sun
It's not bad
There is no consensus
It's cooling
Models are unreliable
Temp record is unreliable
Animals and plants can adapt
It hasn't warmed since 1998
Antarctica is gaining ice
View All Arguments...


Username
Password
New? Register here
Forgot your password?

Latest Posts

Archives

The role of stratospheric water vapor in global warming

Posted on 1 February 2010 by John Cook

There's been a number of queries regarding a new paper examining the role of stratospheric water vapor in global warming. The paper is Contributions of Stratospheric Water Vapor to Decadal Changes in the Rate of Global Warming (Solomon 2010). There are a few overly excited interpretations of the paper's results circulating around the blogosphere. This is presumably from readings of media clippings, not the actual paper. To accurately determine the significance of Solomon 2010, the best course is to see what the paper actually says.

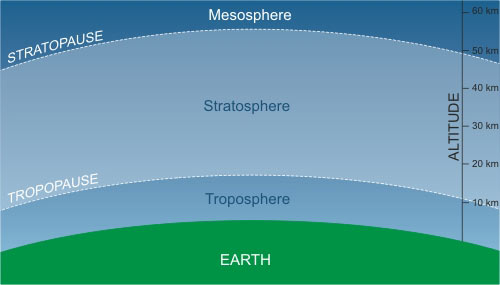
The atmosphere is divided into several layers. The troposphere is the lowest part of the atmosphere. It contains most of the atmosphere's water vapor, predominantly supplied by evaporation from the ocean surface. Through the troposphere, temperature falls as altitude rises. The boundary between the troposphere and stratosphere is called the tropopause. This is known as the "cold point", the coldest point in the lower atmosphere. In the stratosphere, temperature actually rises with altitude. It warms as you get higher - the opposite of the troposphere.
Atmospheric layers: Troposphere, Stratosphere and Mesosphere
Figure 1: Atmospheric layers: Troposphere, Stratosphere and Mesosphere

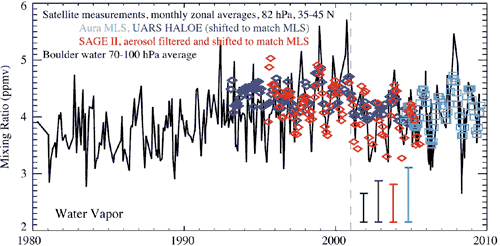
Solomon 2010 looks at the trend of water vapor in the stratosphere. Before 1993, the only observations of stratospheric water vapor were made by weather balloons above Boulder, Colorado (black line in Figure 2). They observed a slight increase from 1980. After 1993, several different satellites also took measurements (coloured circles, squares and diamonds in Figure 2). The various observations all found a significant drop in stratospheric water vapor around 2000. Most of the change in water vapor occurs in the lower stratosphere, just above the tropopause. The greatest changes also occur in the tropics and subtropics.
Water Vapor in stratosphere
Figure 2: Observed changes in stratospheric water vapor. Black line: balloon measurements of water vapor, taken near Boulder Colorado. Blue diamonds: UARS HALOE satellite measurements. Red diamonds: SAGE II instruments. Turquoise squares: Aura MLS satellite measurements. Uncertainties given by colored bars (Solomon 2010).

What effect would this have on climate? Figure 3 shows the change in radiative forcing imposed by changes in stratospheric water vapor. The dotted line is the radiative forcing without the effect of stratospheric water vapor changes. The grey shaded region shows the possible range of contribution from changing stratospheric water vapor. As it's a greenhouse gas, increasing water vapor has a warming effect. Consequently, the steady rise from 1980 to 2000 added some warming to the existing warming from greenhouse gases. The drop in water vapor after 2000 had a cooling effect.
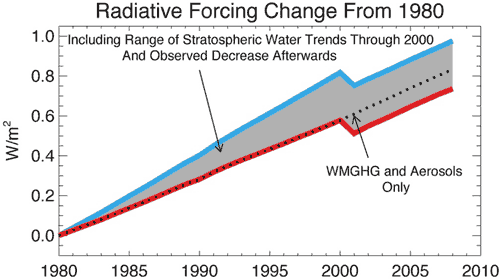
 
Figure 3: Impact of changes in stratospheric water vapor on radiative forcing since 1980 due to well-mixed greenhouse gases (WMGHG), aerosols, and stratospheric water vapor. The shaded region shows the stratospheric water contribution (Solomon 2010).

What caused these changes? Water vapor in the stratosphere has two main sources. One is transport of water vapor from the troposphere which occurs mainly as air rises in the tropics. The other is the oxidation of methane which occurs mostly in the upper stratosphere. Most of the change in water vapor occurs in the lower stratosphere in the vicinity of regions affected by the El Nino Southern Oscillation. This seems to point towards convection and internal variability driving the changes. A comparison between stratospheric water vapor and tropical sea surface temperatures show good correlation which corroborates a link with El Nino. However, the correlation breaks down in some periods suggesting other processes may also be important. Consequently, the authors are cautious in coming to a firm conclusion on the cause.

There seem to be two major misconceptions arising from this paper. The first is that this paper demonstrates that water vapor is the major driver of global temperatures. In fact, what this paper shows is the effect from stratospheric water vapor contributes a fraction of the temperature change imposed from man-made greenhouse gases. While the stratospheric water vapor is not insignificant, it's hardly the dominant driver of climate being portrayed by some blogs.

The other misinterpretation is that this paper proves negative feedback that cancels out global warming. As we've just seen, the magnitude of the effect is small compared to the overall global warming trend. The paper doesn't draw any conclusions regarding cause, stating that it's not clear whether the water vapor changes are caused by a climate feedback or decadal variability (eg - linked to El Nino Southern Oscillation). The radiative forcing changes (Figure 3 above) indicate that the overall effect from stratospheric water vapor is that of warming. The cooling period consists of a stepwise drop around 2000 followed by a resumption of the warming effect. This seems to speak against the possibility of a negative feedback.

0 0

Printable Version  |  Link to this page

Comments

1  2  Next

Comments 1 to 50 out of 78:

  1. The article is hidden behind a pay-wall so I have to rely on the likes of yourself to interpret. Even if I could access the article there is no guarantee I could understand it. It is interesting. Thanks.
    0 0
  2. Hmmm, as I recall, methane levels rose sharply through the 2nd half of the 20th century-but leveled off between 2000-2008. So maybe that's why there's a drop in stratospheric water vapor post-2000. However, as this additional methane was derived from human sources (sewerage, land fill, fossil fuel extraction, land-use change)-then the stratospheric water vapor contribution to global warming-small though it might be-might well still be ultimately of anthropogenic origin. That certainly doesn't let the contrarians off the hook!
    0 0
  3. Methane started to level off in early 1990s so not tight correlation with water vapor. Also, apparently (though I too am limited by article access issue) ∆ in strato-water vapor was in lower stratosphere thus not likely methane. All that said if there was a change in tropo-strato exchange then there might be noticeable change in atm concentrations of methane, SF6, etc. Worth looking into...
    0 0
  4. Thing is, though, that it only *started* to level off-it was still rising right up until 2000-2001, though at a slower rate from 1992-2000 than in 1980-1992. Given that methane has a half-life of 7 years, then I think it's perfectly in line with observed drop in stratospheric water. Lets not also forget that the other by-product of methane oxidation is carbon dioxide-another greenhouse gas.
    0 0
  5. The abstract from Solomon 2010 states: 'More limited data suggest that stratospheric water vapor probably increased between 1980 and 2000, which would have enhanced the decadal rate of surface warming during the 1990s by about 30% compared to estimates neglecting this change.' 30% is pretty substantial by any standard bearing in mind that we have systems that are very sensitive to positive and negative feedbacks. It's all the more interesting considering that 1998 seems to have been an exceptionally warm year (whether because of ENSO or other causes) with evidence of subsequent relative cooling. Marcus, the reported levelling off of methane levels is surely very worthy of note given its reported significance as a greenhouse gas. We are dealing with complex systems which we do not undertsand well. With respect, the gratuitous references to 'contrarians' and 'denialists' that often appear on this site have a quasi-religious flavour which are out of keeping with the spirit of genuine scientific enquiry.
    0 0
    Response: I am making more effort to moderate the labelling and ad hominem comments in order to maintain scientifically constructive dialogue. Consequently, I've been deleting a great number of comments lately (from both sides of the debate). I think we all need to take a deep breath and calm down a little. Not because this isn't an important issue but because this is such an important issue.
  6. Yet from my reading of it, the rise in stratospheric water vapor, irrespective of its radiative forcing potential, seems to have its likely origins in the oxidation of anthropogenic methane. If this is correct, then in my opinion this paper actually *supports* anthropogenic global warming even more.
    0 0
  7. Using the running mean as a guage, measurements of methane show it leveled off from 1999 to 2002, rose again peaking in 2003 followed by a drop returning to roughly 2002 levels. This was followed by a shallow bump in 2006. A point of concern is that in 2007 the rise observed prior to 1999 began to continue. Currently NOAA is reporting that we've exceeded 1800ppmv for methane. You can read NOAA's AGGI report ( updated Sept 09) here http://www.esrl.noaa.gov/gmd/aggi/ You can also read about terrestrial stores of methane here - http://www.nature.com/climate/2009/0904/full/climate.2009.24.html If I am not mistaken Nature Reports Climate Change is free to download.
    0 0
  8. Sorry to be picky, padruig, but I think you mean 1800ppbv. Either way, though, that is much, much higher than pre-industrial levels of barely 700ppbv. Indeed, wheras CO2 levels have "only" increased by 38% above 1750 levels, Methane has increased by almost 70% above 1750 levels!
    0 0
  9. Marcus, if you look at http://www.esrl.noaa.gov/gmd/aggi/ you will read: ‘The growth rate of methane declined from 1983 until 1999, consistent with an approach to steady state. Superimposed on this decline is significant interannual variability in growth rate [Dlugokencky et al., 1998, 2003]. The approach to steady state may have been accelerated by the economic collapse of the former Soviet Union and decreased emissions from the fossil fuel sector. From 1999 to 2006, the CH4 burden was about constant, but in 2007 and 2008, globally averaged CH4 began to increase again.’ At the same time, http://www.nature.com/climate/2009/0904/full/climate.2009.24.html whilst raising the alarm about methane emanating from permafrost in fact also states: ‘Ed Dlugokencky, an atmospheric chemist with the US National Oceanographic and Atmospheric Administration in Boulder, Colorado, who oversees their atmospheric-methane measurement program, says indications are that global methane levels remained high in 2008, but he expects to see a return to previous levels over the long term. "If I had to make a prediction about what's going to happen in the future based on the last three decades of observations, I would say that there's a reasonable chance methane will continue to stay flat or even decrease before we see the effects of a warming climate on methane sources," says Dlugokencky. White agrees and says it's too early to tell whether this is a blip on the radar or a true signal that change is afoot. "I think we're going to need to see two to three years or more with increased methane in order to make a strong statement that we're beginning to see permafrost degradation resulting in methane increase," says White.’ So our moderator’s comment: ‘I think we all need to take a deep breath and calm down a little. Not because this isn't an important issue but because this is such an important issue’ is very apposite. At the same time, those at the cutting edge of ‘the science’ seem to be hedging their bets on the issue acknowledging the complexities involved. Returning to the original subject, stratospheric water vapour, I note that ‘The paper doesn't draw any conclusions regarding cause, stating that it's not clear whether the water vapor changes are caused by a climate feedback or decadal variability....’ Accepting for the time being the proposition that ‘The radiative forcing changes (Figure 3 above) indicate that the overall effect from stratospheric water vapor is that of warming,’ I’d be interested in any comments relating to increased atmospheric water vapour and precipitation. This would be very pertinent in relation to other issues raised in these forums such as glacier growth and the impact on regions dependent on such sources for water supply.
    0 0
  10. John et al, Regarding "....the effect from stratospheric water vapor contributes a fraction of the temperature change imposed from man-made greenhouse gases. Stratospheric water vapor has a significant effect but it's hardly the dominant driver of climate being portrayed by some blogs." These sentences seem to contradict one another. In the first you state that SWV "contributes a fraction of the temperature change imposed by" anthro GHGs. With this I agree, going by the scale provided, the forcing from SWV in 2000 was ~0.2 W m-2, with the drop in forcing from SWV in 2001 a paltry 0.1 W m-2. [To put these numbers in perspective the radiative forcing for CO2 in 2008 was ~1.74 Wm-2 and that of CH4 0.50 W m-2 (thanks for the link padruig @7). So the forcing from SWV is less than 9% of the forcing from CO2 and CH4 combined.] But, in the second sentence you state that "SWV" has a "significant effect". Perhaps once should say that "the while forcing of SWV is not insignificant (i.e, is not too small to ignore), it is hardly...." There is probably a more eloquent way of stating this, but it is late here. In my humble opinion, while this work of Solomon et al. is valuable and interesting, it does not in any way undermine the theory of AGW. A scale analysis shows that the forcing from SWV is currently <9% of that from CO2 and CH4. Not only that but the long term trend in the forcing of SWV shown in Fig 3. above is positive (the slope of the line after 2001 is almost the same as that prior to 2001). The decrease in SWV around 2001 is interesting, and more work needs to be undertaken to determine the cause of the decrease-- it is not b/c of instrumentation issues because is was detected by independent monitoring platforms. Anyhow, this is not the silver bullet that those in denial about AGW are hoping for. They can try and spin it that way, but doing so is does not going to reverse the slope of the line in Figure 3 above, or the reality that the forcing from SWV is already overwhelmed by that of anthro GHGs. In fact, in 2008 the radiative forcing of SWV was on par with that of N20 (NOAA/ESLR).
    0 0
    Response: On the one hand, "is significant" or "is not insignificant" seems a little po-tay-to, po-tah-to, but yes, "is not insignificant" probably does capture the sense of what I was trying to communicate so I've updated the wording :-)
  11. Any idea where the 10% water vapour went? What I mean is, besides change in global temperatures and radiative forcing is there any say...increase in rainfall on average in some areas, or shrinking clouds over the past decade that could be linked to this? Or is 10% of atmospheric concentration of water (0.40%) to small to notice anywhere else?
    0 0
  12. John Cook wrote: "The radiative forcing changes (Figure 3 above) indicate that the overall effect from stratospheric water vapor is that of warming. The cooling period consists of a stepwise drop around 2000 followed by a resumption of the warming effect. This seems to speak against the possibility of a negative feedback." Looking at the overall effect in your Figure 3, it is quite clear that if there is a feedback involved, it is a positive one, not negative.
    0 0
    Response: I thought so too but as the authors didn't explicitly say that and I was presenting the results of the paper, I didn't say so. That's the opinion of Gavin Schmidt at Real Climate also.
  13. I wonder why this drop was not reported earlier. After all it occured almost a decade ago.
    0 0
  14. How well mixed is stratospheric water? Can the Boulder weather balloon readings be taken as representative? Water content is sensitive to temperature. Though I do see the Boulder readings are consistent with the satellites.
    0 0
  15. Any idea where the extra water vapor went from the lower stratosphere in 2000?
    0 0
  16. Arno @16, please cite some reputable and published references to back up your assertions. 0-700 m OHC actually increased significantly circa 2003, a time when there were no super El Nino: http://www.nodc.noaa.gov/OC5/3M_HEAT_CONTENT/ Also, this is what the global surface-air temperatures have been doing: http://data.giss.nasa.gov/gistemp/graphs/Fig.A2.lrg.gif And global tropospheric temperatures: http://www.remss.com/msu/msu_data_description.html#msu_amsu_trend_map_tlt (Look at Fig. 7 Ch TLT) Have you been reading Bob Tisdale's page perhaps?
    0 0
  17. Alabatross, there is a step like increase in NOAA OHC time series in 2003. That much is true. However, it was the year Argo floats were deployed en masse. That is, the measurement system changed radically at that time. It's got much better, at least down to 1000 m, perhaps. It was supposed to do measurements down to 2000 m, but due to instrumental problems that has not worked until recently. No warming detected since then in the upper 700 m, a level well below the thermocline. There is some speculation that heat went to the abyss, but water down there being about as cold and salty as it can get, it is not easy to figure, how substantially warmer water could slip there.
    0 0
  18. I posted this comment on RealClimate - thought I'd post it here as well to see if anyone here has any insights: Re the contribution of the post-2000 decrease in stratospheric water vapor contributing to the ‘flattening’ of the global warming trend – I am struck by the dissimilarity between the observed and modeled temperature curves post-2000 in Figure 3b. It looks like the model’s response it to simply adjust (almost instantaneously) to the drop in water vapor in 2001, and I see no evidence of a ‘flattening’ of the trend. Am I missing something?
    0 0
  19. re #20 Peter, there is certainly evidence that abyssal waters in the world's oceans may be warming (and deoxygenating), especially from Johnson's lab in Seattle (Pacific Marine Environmental Lab) [*] I suspect that considering the problems with the Argo floats, it's too early to say whether there is any discrepency between upper ocean heat content and expectations; after all we've only got a few years of Argo data. It's worth pointing out that the longish term (decadal; bi-decadal) accumulation of upper ocean heat is pretty close to model predictions up through 2008 [**] [*] Johnson GC et al. (2006) Recent western South Atlantic bottom water warming Geophys. Res. Lett. 33, L14614 Johnson GC et al. (2007) Recent bottom water warming in the Pacific Ocean J. Climate 20, 5365-5375 Johnson GC (2008) Warming and Freshening in the Abyssal Southeastern Indian Ocean J. Climate 21, 5351-5363 Ozaki H et al. (2009) Long-term bottom water warming in the north Ross Sea J. Oceanograph. 65, 235-244 Johnson GC et al. (2009) Deep Caribbean Sea warming Deep Sea Research. 1 Oceanograph. Res. 56, 827-834 Johnson GC (2008) Reduced Antarctic meridional overturning circulation reaches the North Atlantic Ocean Geophys. Res. Lett. 35, L22601 [**] S. Levitus et al. (2009) Global ocean heat content 1955-2008 in light of recently revealed instrumentation problems Geophys. Res. Lett. 36, L07608
    0 0
  20. Peter re #21, I for one do not appreciate your unsubstantiated insinuations here. Drawing parallels between climate science and what happened in the financial sector is just wrong. Anyhow, this is a scientific debate about the Solomon paper and SWV, can we please stick to that? PS: Re OHC. The same "spike" ~2003 is also evident in 2003 in the global SST data (Smith et al. 2008, J. Climate, ERSST.v3b), Spencer looked into this and found that the spike in ERSST 3b was real. Can you provide proof that this spike is b/c of the Argo data, a published reference would help. I just perused the Smith et al. paper and there is no mention of the Argo data being included in their analysis. Anyhow, the *long term* trend of 0-700 m OHC is up, see also the papers that Chris provided.
    0 0
  21. Some questions that the abstract doesn't seem to be clear on: Are the authors considering stratospheric water vapor a forcing or feedback, both, or can no conclusion be drawn? Since it doesn't determine the cause of the water vapor changes, it seems the conclusion would be one of the latter two. Could a conclusion from the study be that water vapor is a stronger positive feedback than previously estimated? It mentions stratospheric water vapor increased in the 90's and decreased in the early part of this decade. We also saw a leveling off of methane emissions, reduced solar activity, and a transition towards negative ENSO conditions. If any of these are a cause of the water vapor change, it seems to further support the positive feedback from water vapor. One thing that seems clear is that it might help improve mean climate model estimates at the decadal scale. 1990's warming exceeded the average climate model projection while 2000's warming generally is a little lower. Including the water vapor data seems likely to resolve model/observation discrepancies on short time-scales.
    0 0
  22. I haven't read Solomon et al so I'm not going to make any specific comments. However at face value the paper (as paraphrased here) seems to be yet another reason to be concerned about the massive release of greenhouse gases. Right now there seems to be a number of contributions "piling up" that should be causing significant cooling: (i) 2003-2009 the sun has dropped to the bottom of the solar cycle (this should contribute around -0.1 oC of to the surface temperature over this period). (ii) 1980's to present: a slow (and rather small) negaitve trend in solar output (-0.05 oC?) (iii) Since around 1998; apparently the oceans have switched regimes to one with a cooling influence on the surface temperature (negative phase of the PDO). This might contribute around -0.1 oC relative to the long term ocean regime trend (which is zero). (iv) Stratospheric water vapour effect (see top article) which according to Solomon has reduced warming in the period 2000-2009 by 25% (so around -0.05 oC say). And yet 2009 was tied for the second warmest year on record. So if all of these contributions are real (and we are at least pretty confident about the solar cycle contribution)....they have been unable, colectively, to outweigh the warming contribution from enhanced greenhouse forcing...
    0 0
  23. Yocta at 11. The change is about 10% of +/- 5ppmv of the stratospheric atmosphere. That isn't very much water in absolute terms, compared to the water in the troposphere.
    0 0
  24. Thanks Turboblocke, i'm still learning. If anyone knows of a good text on weather and climate science they could recommend I'd be much obliged? :) I'm slowly rereading my old Sturman & Tapper book from undergraduate days but would like to hear of other ones out there...
    0 0
    Response: All you could want and more is found in the online textbook Principles of Planetary Climate. UPDATE: my mistake, the book is no longer available online, now in press. Well, a good introduction to global warming, not as technical as Principles of Planetary Climate, is The Discover of Global Warming by Spencer Weart.
  25. @19. chris at 06:38 AM on 2 February, 2010: chris, please, please explain how warmer and less saline water can replace denser cold & salty water at the bottom. I am really curious.
    0 0
  26. Answering #24. I have seen that online textbook before, I thought it was promising, but how much longer will it still be under construction? The intro promises much, but it isn't there yet. Answering #21: it has been either strongly suspected or outright know for quite some time now, that _stratospheric_ water vapor is a greenhouse gas. That is why people are worried about contrails, and have already rejected the idea of using hydrogen to power jet planes. So the article was quite right to consider SWV most likely a cause of positive feedback -- which is exactly what we do not want.
    0 0
  27. ChrisCanaris (#5): With respect, the terms 'contrarian' and 'denialist' that appear occasionally on this site are not "out of keeping with the spirit of genuine scientific enquiry". In fact, these terms are needed to distinguish genuine enquiry from disingenuous dogma. The term "denialism" refers not to skepticism, but to the presumption that AGW is wrong. This term would be gratuitous ONLY if used without justification. I would think skeptical scientists would want to erect a high wall between themselves and denialism. I will illustrate this with the following link, which offers a "Denialist" perspective on the significance of stratospheric H2O: http://www.theresilientearth.com/?q=content/its-water-vapor-stupid The article states: "These findings show that stratospheric water vapor represents an important driver of decadal global surface climate change, yet the IPCC crowd continues to focus on CO2." Cleverly written. The first part of the sentence is correct, but the second part is a non sequitur, implying there's no reason to continue to consider CO2 as a driver (three days after the paper was published!). Moreover, it's false. The lead author of the new study served as co-chair of IPCC Working Group 1 (2007) AR4 report. If there were an "IPCC Crowd", she'd be in it. In reality, this refers to the purported conspiracy to promote AGW. The blog states: "Here is a plausible explanation as to why the period from 1980 to 1999 was one of noticeable warming...", but according to the paper itself, this is false. The authors attributed ~30% of warming during the 1990s (sic) to stratospheric H2O, not 100%, as implied. (Gee, yesterday it was the sun!) Admittedly, 30% is a lot, and I agree we have much more to learn. In the meantime, I still need a term to describe an argument that presumes that CO2 plays an insignificant role, and then relies on deception to "prove" it.
    0 0
  28. Well, unless I'm totally wrong, Peter, isn't that the entire basis of Thermohaline circulation? Water warmed at the equator gets pushed towards the poles, then becomes increasingly saline as it cools down (& eventually freezes), pushing the warm water down into the depths & upwelling colder, less saline water from below-rinse & repeat. At least, that's how I always understood it.
    0 0
  29. The other point, CoalGeologist, is that these blog sites conveniently ignore the obvious question-"where did the sudden rise in SWV come from"? The most obvious candidate is the oxidation of rising levels of anthropogenic methane-which still places the blame for global warming clearly in the lap of human activities.
    0 0
    Response: I'm not so sure oxidation of methane is the obvious candidate. This occurs in the upper stratosphere while the change in water vapor has occured in the lower stratosphere just above the tropopause. This would point the finger more towards a change in the convection of water vapor from the troposphere.
  30. Isn't it possible for SWV to travel from the upper to the lower stratosphere though John? Also, what might be the likely cause of the change in convection of water vapor from the troposphere?
    0 0
    Response: "what might be the likely cause of the change in convection of water vapor"

    This is all speculation, the paper doesn't go much into cause as their emphasis is on noting the change and calculating the effect. But it may have something to do with the temperature of the "cold point" which is the boundary where temperature stops falling with altitude and starts to rise. Eg - the tropopause, the boundary between the troposphere and stratosphere. A good discussion on possible mechanisms can be found at the Wunder Blog.
  31. I think the author has removed the link for the actual text book as he says it is getting published, but you can still get to it by looking at the index directory from the site. (It is a public site so I am assuming that what I have done is copyright ok.) Go here: http://geosci.uchicago.edu/~rtp1/ClimateBook/ and open the file "ClimateVol1.pdf"
    0 0
  32. Regarding changes in levels of SWV, did the authors consider tropopause folding as a mechanism for adding or removing WV to/from the stratosphere? For example, analysis of reanalysis data could be used to identify the frequency of these events and see if there is any connection. Have aircraft changed their cruising altitudes for some reason? Just some thoughts. ReJohn's comment at #30. I think Santer has done research which has shown that the height of the tropopause has been increasing in step with the tropospheric warming.
    0 0
  33. typo in fourth paragraph Says Figure 2, should be Figure 3.
    0 0
    Response: Fixed, thanks for the tip.
  34. For me, here, an interesting is idea another scientific outsider: http://climatechange1.wordpress.com/2009/02/04/a-cooling-story-involving-ozone-the-sun-and-the-sea/ P. S. I appeal for failure to use - here; the concept of denialism - comparing a de facto, denial of the Holocaust - is simply unethical.
    0 0
  35. John if you plan to present what the paper actually says you should be careful with your language. "They observed a slight increase from 1980" "a significant drop in stratospheric water vapor around 2000" Now lets see what the paper says. 1980-2000 increase of 1ppm (supported by increase of 0.5ppm during 1990s) After 2000 drop of 0.4ppm How can an increase of 1ppm be slight while a drop of 0.4ppm be significant? "In fact, what this paper shows is the effect from stratospheric water vapor contributes a fraction of the temperature change imposed from man-made greenhouse gases." What is that fraction? Well based on actual satellite data it's ~40% of CO2. Quite significant impact on radiative forcing over the period of measurement. They also modelled the maximum increase over the whole of the stratosphere and effect was "close" to CO2 "This seems to speak against the possibility of a negative feedback." Whether there are negative feedbacks to climate change I'm not sure. This just speaks against this being the mechanism. What it does speak for is the fact that potential natural variation can have a significant impact on radiative forcing (at least on the decadal level). And secondly that there are processes out there for us still to discover. The equation is still not complete. You can complain about some blogs overstating this but please don't understate it either.
    0 0
  36. @30/Response: "A good discussion on possible mechanisms can be found at the Wunder Blog" The discussion there is good indeed. This is why data homogenization is impermissible if metadata are absent. Sudden shifts do occur: http://www.wunderground.com/hurricane/2010/strato_temps_SST.png However, it is routinely done to datasets in mainstream climate science, both to surface temperatures and upper troposphere radiosonde humidity values. Looks like actual climate does have jumps, sometimes even in the downward direction. Time to reconsider automatic pattern recognition based data enhancement. If meaningful structure is removed this way, one may be left with pure noise plus a spurious trend. I am still waiting for references to peer reviewed papers on data homogenization as a legitimate statistical procedure.
    0 0
  37. "I've been deleting a great number of comments lately (from both sides of the debate)." John, this is off the topic in hand, but I'd be interested to know if you've been getting more intemperate posts than usual. If so, I think it's an unfortunate but inevitable accompaniment to the site's success, both in terms of reaching people and in terms of the quality of its content. I fear it is also because an increasing numbers of newspapers and columnists have been weighing on one side or the other. In some cases the polemic has been frightening. One notorious British columnist last week published (on his official newspaper blog) the name, address and phone number of a man who had written to one of his prospective parliamentary candidates, asking him to clarify his position on the climate change issue. The columnist took down the post after 12 hours or so and apologised, but not before the man had been telephoned and visited by people hostile to what he had done. Amazingly, the columnist, who works for the Daily Telegraph, has not been disciplined.
    0 0
    Response: I do seem to be hitting the delete link a lot lately. And what's surprising is I seem to be deleting "pro-warming" comments just as much or more than skeptic comments lately. The debate is intensifying and everyone is getting a little excited. It's at this time more than ever that we need calm voices pointing us back to the science.
  38. It seems that the textbook "Principles of Planetary Climate" is not online any more, and also not available in print until summer.
    0 0
    Response: Whoops, just noticed that and noted it in my response above. Thanks.
  39. @yocta, #11 ++ I think water vapor has a short enough lifetime in the atmosphere that it is better to ask the question as, "What caused the change in balance?", rather than "Where did it go?" Also, I found David Archer's book, Global warming: understanding the forecast to be in the right spot for me from a technical difficulty vs. comprehensibility standpoint. John, just wanted to say thanks for keeping this site up to date and well moderated. I often engage in climate debate in the local paper, and it is so much easier to link and say, Bob #8, Jim #12, than it was to keep repeating the same arguments and counters continually. This site would not be as useful if it were filled with insults.
    0 0
  40. There is some discussion about a "slowdown" in Global Warming after 2000. What slowdown? In surface air temperatures the "slowdown" was an artifact of the 2007-2008-2009 La Niña. Now that it is over, we are back to record-breaking temperatures. In Sea Surface temperatures instead, there IS a flattening of trends after 2000. Also in upper 700 m Oceanic Heat content after 2003. As oceans absorbs most of heat, this indicates a slowdown in Global Warming? The answer seemed to be yes, until the paper of Von Shuckmann(2009) "Global hydrographic variability patterns during 2003-2008". It found a warming trend of 0.77 +- 0.11 W/m^2 in oceans DOWN TO 2000 METERS. Sp for some reason nearly all the heat accumulated below 700 m. Most of deep warming occurred in the North Atlantic, so I guess the reason was a strong Atlantic Meridional Overturning Circulation (AMOC) that subducted nearly all the heat to the Deep Ocean. Another evidence against slowdown in OHC trend is sea level rise. The mean trend for 2000-2009 is 3,3 mm/year. According to the Cazenave et al paper (2008) "Sea level budget over 2003–2008 (A reevaluation from GRACE space gravimetry, satellite altimetry and Argo)" the ocean mass contribution to sea level rise was near 2 mm/year. So, let's calculate the termo-steric SLR rate: Total SLR - Ocean mass SLR contribution = Thermo-steric SLR (3,3 mm/yr)-(2 mm/yr)= 1,3 mm/yr This is the thermo-steric SLR for 2003-2008 period. For 1993-2003 period the thermo-steric SLR was 1,2 mm/yr, according to the J. I. Antonov, S. Levitus, and T. P. Boyer 2005 paper "Thermosteric sea level rise, 1955–2003". So we have for thermo-steric SLR the following: 1993-2003: 1,2 mm/yr 2003-2008: 1,3 mm/yr There is no sign of slowdown. The rates of SLR were almost equal. The conclusion is that the ocean still absorbs heat, with no sign of slowdown. If upper 700 m show no trend, then the heat must have been accumulated below. Any idea why most of warming occurred below 700 meters? AMOC Themo-Haline Circulation?
    0 0
  41. Do we need to re-evaluate CO2s contribution to global warming from 1980 to present? If 30% less came from CO2 then you have to believe that even more heating is "in the pipeline" or reduce CO2s impact. Which one?
    0 0
  42. re #41 Neither I suspect. One doesn't need to attempt to readdress and overhaul our understanding in response to every paper that comes out. The observation is that there have been short term changes in lower stratospheric water vapour, the causes of which are not known. It's not really known whether these changes can be considered forcings or are responses to changes in sea surface temperature or to aerosols, or what. The paper's only been out a few days, It will take some time to address its significance if any. It's worth restating that while the earth surface temperature hasn't warmed since 2005, it hasn't cooled since then either (a very short period for addressing "trends"!). However in the past 7 years the sun has progressed right to the bottom of a prolonged solar minimum, the secular solar irradiance trend has been a slight cooling one for a couple of decades, we're apparently in a cool ocean circulation regime, and now we have apparently had about a decade's worth of stratospheric water vapor "cooling" too. So one conclusion is that as this coincidence of cooling contributions that have oddly coincided during the last 7-10 years, dephases, that we're going to get quite a jump in surface temperature (rather like the analysis of Latif and Keenleyside in Nature the year before last): N. S. Keenlyside et al. (2008); Advancing decadal-scale climate prediction in the North Atlantic sector; Nature 453, 84-88 I think there's no question that we have got some "heat in the pipeline" at least from the solar cycle contribution. Otherwise this is about short term variability, and doesn't have much influence on our basic understanding of the earth surface temperature to rising greenhouse forcing...
    0 0
  43. chris, see my comment elsewhere: http://skepticalscience.com/Understanding-Trenberths-travesty.html#8093 The Solomon paper can also be an onset of a paradigm shift.
    0 0
  44. What matters here is whether increasing SWV is a cause or an effect. The two most logical theories for the increase-increased convection & the oxidation of methane-both seem to be tied in with greenhouse gas emissions &/or the warming they produce. That hardly provides the basis for a "paradigm shift".
    0 0
  45. Chris #42, It's not just the coincidence of cooling for the last 7-10 years but also the coincidence of warming from 1980-2000. From reading past stuff John has posted and comments I've got several impressions. 1)The warming from 1980 to 2000 (or beyond, take your pick) is the most obvious, significant and fastest and has given us projections for the future. 2) Prior to this nothing else has coincided with the warming trend, solar/ENSO etc all breakdown at some point. For this reason CO2 has been blamed for most of the warming over the past 30 years. Thats not to say CO2 doesn't cause warming but you have to conclude that the present discussed process is contributing a not insignificant amount which has to come from warming that was previously attributed to CO2. I agree you can't overturn a whole idea based on one paper (although I didn't see this complaint discussing Mennes 2010) but there's no problem with acknowledging a role and speculating on the implications. While the temp record maybe 150years long, most other processes discussed here and elsewhere have much shorter data runs, take arctic sea ice melting for example. Separating trends from fluctuations is an issue with many climate related topics.
    0 0
  46. @44. Marcus at 13:41 PM on 3 February, 2010 "whether increasing SWV" Marcus, the Solomon paper is not about increase, but an abrupt global drop in lower stratospheric specific humidity. If it occurs every now and then, it can provide an overall negative long term water vapor feedback loop in spite of positive feedback in the short run. Dynamics just like bubbles bursting, both real ones and those created by stock excange. Also, it makes pattern recognition based data homogenization techniques specific to mainstream climate science untenable. Climate does have temporal patterns, even sharp steps. They are not to be removed from data series but to be observed.
    0 0
  47. What is the likelihood of CO2, methane etc playing no part in the processes discussed here? Not very high, I would say - to some extent, SWV content seems to be part of a positive GHG feedback. But this is not a fixed, well defined functional relationship, rather it has a stochastical nature, with considerable variance, and several other factors influencing. In some situations, it may even turn out to be negative.
    0 0
  48. CO2 does play an important part. In tropical lower stratosphere (~15 km), above low level clouds it has a vehement cooling effect. Temperature there can get as low as 190 K. Air becomes absolutely dehydrated (0.2 ppmv dihydrogen monoxide). Up there CO2 is the main agent, capable to radiate heat out to even cooler (2.7 K) space. The more CO2 is in the atmosphere, the more dryfreezed air is produced this way. If subsequently it gets mixed into upper troposphere by whatever process and drifts over a cloudless area, a wide IR window is opened, an effective heatsink to space. http://asd-www.larc.nasa.gov/~tak/wong/images/NationalGeographic/ceres_aqua_olr3d_20030804_s.png
    0 0
  49. The warming period happens to coincide with a period of economic boom (the 90s), while the cooling comes after ten years of economic crisis. It is well known that the affluent heat polluters of the planet have had to curb their spending habits in direct relation to the crisis and increased fuel prices. On the other hand, if the effects of CO2, as the theory goes, has such a prolonged hysteresis (in the order of hundreds of years), changes in life style within this ten year span shouldnt make a dent in temperatures. For this reason, it is unlikely for a non skeptic to look for such a correlation, and that any detectible change would have to be coming from natural forcings. (If this recent cooling is indeed due to a slowed down global economy, it would suggest extra warming is due primarily to industrial waste heat.) Without jumping to conclusions, this touches on the issue of climate response, or what has been referred to in other posts as sensitivity. If an Earth Year was conducted (like Earth Day except for a year, and with participants truely not burning any fossil fuels), and if after that year, global cooling was detected, an index for the Earth's response to human industry could be determined, where a faster response would indicate higher sensitivity, and a slower response, lower sensitivity. Ironically, higher sensitivity would be bad, since it would indicate a need for drastically curbing human industry. On the other hand, low sensitivity would also be bad, because it would indicate that we have little or no control of this situation. More ironic still is that I am supposedly a skeptic.
    0 0
  50. RSVP. First off there has been *no cooling* for the last 10 years, just a slower rate of warming than what we saw between 1980-1999. Secondly, this slower warming rate occurred against a backdrop of a significant drop in Total Solar Irradiance-to levels unseen in over a century. It had little to do with economic activity, given that 2001-2007 marked a large upswing in economic activity in most parts of the world-especially China & India (the GFC is only a very recent event after all). So your theory about warming being potentially due to industrial waste heat doesn't actually bear up to close scrutiny. Even so, turning waste heat from industry into electricity is a good idea because it reduces both thermal pollution (which, IMHO, is a problem we should be tackling) whilst also reducing our dependence on fossil fuels as an immediate source of electricity.
    0 0

1  2  Next

You need to be logged in to post a comment. Login via the left margin or if you're new, register here.


The Consensus Project Website

THE ESCALATOR

(free to republish)


© Copyright 2024 John Cook
Home | Translations | About Us | Privacy | Contact Us