


 Arguments


Gleckler et al Confirm the Human Fingerprint in Global Ocean Warming
Posted on 27 June 2012 by dana1981
Although over 90% of overall global warming goes into heating the oceans, it is often overlooked, particularly by those who try to deny that global warming is still happening. Nature Climate Change has a new paper by some big names in the field of oceanography, including Domingues, Church, Ishii, and also Santer (Gleckler et al. 2012). The paper compares ocean heat content (OHC) simulations in climate models to some of the newest and best OHC observational data sets from Domingues (2008), Ishii (2009), and Levitus (2009) which contain important corrections for systematic instrumental biases in expendable bathythermograph (XBT) data. The paper makes several important points.
- The 0-700 meter layer of the oceans warmed on average 0.022°C to 0.028°C per decade since 1960.
- Climate model simulations which include the most complete set of external forcings – natural (solar and volcanic) and anthropogenic (greenhouse gases and sulphate aerosols) – are consistent with the rate of warming observed over the past 40 years (see the 20th Century multimodel response including volcanic forcings [MMR VOL 20CEN] and multimodel response including volcanic forcings projected forward using the IPCC SRES Scenario A1B [MMR VOL SRESA1B] in Figure 1).
- The ocean warming observed over the past 40 years cannot be explained without anthropogenic greenhouse gas emissions; it is a 'fingerprint' of human-caused global warming (Figure 3).
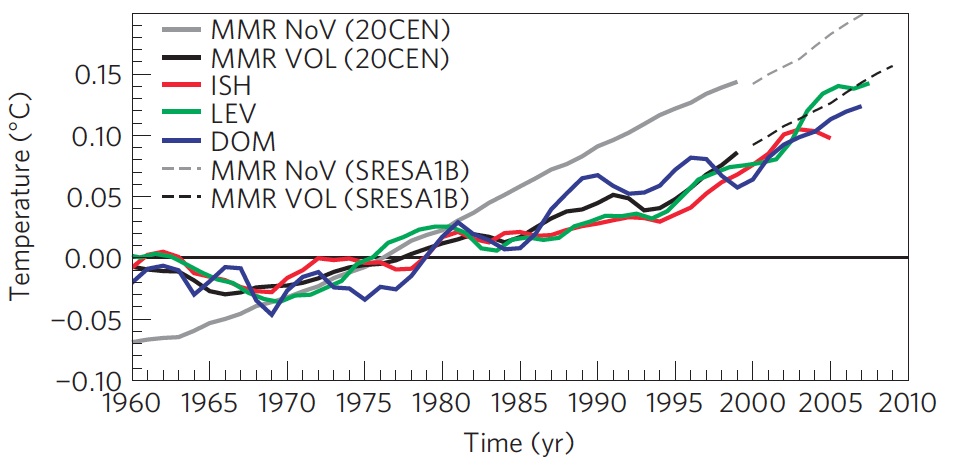
Figure 1: Recent observed ?T estimates from Domingues et al. 2008 (blue), Ishii et al. 2009 (red) and Levitus et al. 2009 (green) compared with the 20th Century (20CEN) multimodel response (MMR) of phase 3 of the Coupled Model Intercomparison Project (CMIP3) for the subsets of models including volcanic (VOL, black) and no volcanic (NoV, gray) forcings. MMR results are also shown for the CMIP3 SRES A1B scenarios (dashed black and gray), constructed from the same VOL and NoV subsets defined by the 20CEN models. Figure 1c from Gleckler et al. 2012.
Previous Human Fingerprint Detections
Gleckler et al. note that several previous studies have identified a human 'fingerprint' in ocean warming; they cite Barnett et al. 2001, Barnett et al. 2005, Pierce et al. 2006, and Palmer et al. 2009. However, the Gleckler et al. results are more robust because it is the first (and by far the most) comprehensive study to provide an in-depth examination of data and modelling uncertainties, and to use three improved data sets with corrections for instrumental biases (e.g., XBTs) along with a large number of model runs made available by 13 leading modelling centres from around the world (CMIP3 model ensemble).
"Several studies have used well-established detection and attribution methods to demonstrate that the observed basin-scale temperature changes are consistent with model responses to anthropogenic forcing and inconsistent with model-based estimates of natural variability. These studies relied on a single observational data set and employed results from only one or two models."
Accounting for Natural Variability
Before looking for a human-induced fingerprint, Gleckler et al. checked that the models have realistic natural variability (“noise”).
"Before conducting our [detection and attribution] analysis, it is important to verify that the models used here do not systematically underestimate natural variability, particularly on 10-year timescales relevant to the detection of a slowly evolving ocean warming signal"
The authors do find some indications that the models underestimate the observed spatio-temporal variability of 5 and 10 year trends; however, this variability underestimate would have to be smaller than observed by a factor of more than two to negate the positive identification of an anthropogenic fingerprint in the observed ocean warming over the past 40 years. Their analysis provides no evidence of a noise error of this magnitude.
The Human Fingerprint
In order to determine the cause of the observed ocean warming during the past 40 years, Gleckler et al. use the leading empirical orthogonal function (EOF), a well-known statistical tool in geophysics, to identify the simulated spatial pattern of response (the fingerprint) to external forcings over the period 1960-1999.
"The leading EOF primarily captures the pronounced change in mean state and exhibits warming in all ocean basins, with consistently larger warming in the Atlantic than in the Pacific."
In the model runs using anthropogenic forcings (VOL and NoV), the leading EOF is positive in all ocean basins, as is the case for the observational data from all three data sets (Figure 2a). Effectively this means the models expect and the data observe warming in all ocean basins. However, in the control runs, without any time-varying external forcings (e.g., no human-induced factors), the sign of the leading EOF flips in the different ocean basins, meaning that the models expect cooling (EOF loading < 0) in some basins and warming (EOF loading > 0) in others (Figure 2b).
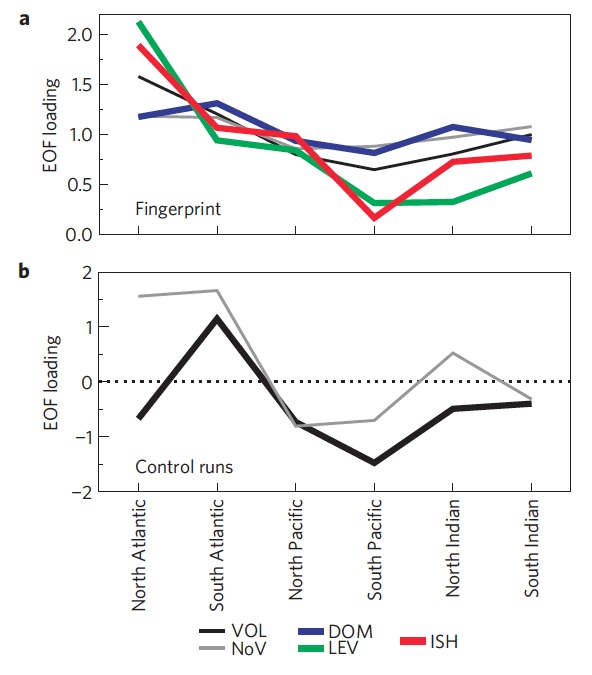
Figure 2: EOF analysis of basin-average upper-ocean temperature changes. Basin-scale structure of externally forced fingerprints from 20CEN runs (a) and leading noise mode from pooled control runs (b). The leading EOF for each of the three different observational ?T estimates is also shown in a. Observational results are for infilled data sets and all model results are for spatially complete data, with removal of model drift based on a cubic fit to control-run data, and the global mean included in all data. Figure 4 from Gleckler et al. 2012.
The authors then project the time series from the observations and model simulations (VOL, NoV, and control runs) to the same externally forced VOL model fingerprint pattern (Figure 2a). By examining successive linear trends calculated from these projected time series (technically known as pseudo-principal component time series), it is possible to detect when the externally forced signal rises above noise, and continues above this statistically significant level (Figure 3).
"Our aim is to search for time-increasing correspondence between the model-predicted ocean warming fingerprint and the observational data sets, and then to determine whether such correspondence could be due to natural variability alone."
"By fitting overlapping trends of various values of L [trend length] to these pseudo-principal component time series, we can examine the behaviour of signal-to-noise (S/N) ratios as a function of timescale and determine the detection time - the time at which S/N rises above (and remains above) a stipulated (1% or 5%) significance level"
Gleckler et al. find that the S/N ratio of the volcanic forcing model is consistent with that in the three observational data sets which have been corrected for XBT biases (Figure 3).
"For all three corrected estimates, the S/N is consistently above a 1% significance level, with ratios greater than four by 2003."
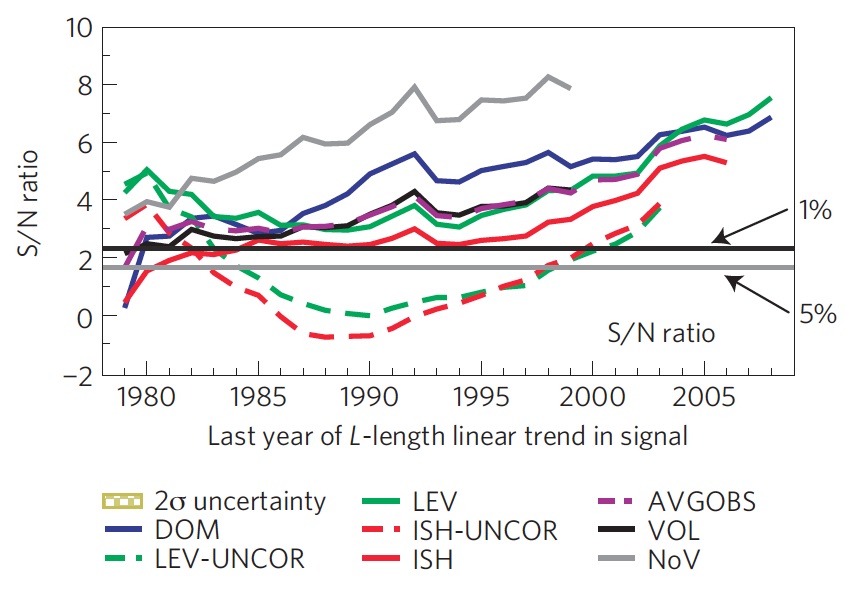
Figure 3: S/N ratio as a function of increasing trend length L. A common VOL model noise estimate was used to calculate S/N. The 1% and 5% significance thresholds are shown (as horizontal black and grey lines respectively) and assume a Gaussian distribution of noise trends in the VOL control-run pseudo-principal components. All observational estimates are infilled, all model data are spatially complete and the global mean is included in all data. Figure 5c from Gleckler et al. 2012.
Summary
Frankly it's not at all surprising that the warming of the oceans can be primarily attributed to human greenhouse gas emissions. A 0-700 meter ocean warming of ~0.025°C per decade may not sound like a lot, but it corresponds to an energy content of about 2.4x10²² Joules per decade, or more than one Little Boy atomic bomb detonation per second, every second over the past 40 years, just accumulating in the uppermost 700 meters of the world's oceans.
Although it's a challenge for climate models to adequately simulate natural variability, that challenge becomes less of a roadblock when considering long timeframes (like 50 years), a large energy accumulation (like 1023 Joules), and a large area (like the global oceans), as in the Gleckler study. That immense amount of energy has to come from somewhere, and as we know, human greenhouse gas emissions are the biggest culprit behind the global energy imbalance. As oceanography expert and one of the coordinating lead authors for the detection and attribution chapter IPCC AR5 Nathan Bindoff said in reaction to Gleckler et al. and the human attribution of ocean warming,
"We did it. No matter how you look at it, we did it. That's it."
In addition to identifying the human 'fingerprint' in ocean warming, it's also interesting that Gleckler et al. demonstrate that, as long as they incorporate volcanic influences, climate models OHC simulations are in overall good agreement with the most up-to-date observational data. This model-data OHC comparison is one which we recently discussed, but just for one NASA GISS model. Gleckler et al. on the other hand examine several different CMIP3 models, and do not identify a notable model-data discrepancy, although it will be interesting to see a comparison using CMIP5 models with updated radiative forcing estimates.
The main takeaway points from Gleckler et al. are:
- The results significantly improve the confidence levels in human-induced global ocean warming, from "likely" in the IPCC AR4 to "virtually certain" in IPCC AR5. One of the main reasons for lower confidence in AR4 was the concern they had about climate models not being able to simulate observed decadal (10-year) variability. We now know that the models never simulated the "observed and significantly large decadal variability" because it was mostly caused by the systematic errors in the XBTs, not known at that time.
- Because temperature increase expands the volume of the ocean and sea level rises, this implies that thermal expansion, which is a major contribution to the observed global mean sea-level rise during the past 40 years, is also largely human-induced.
- Figure 3 shows that when we continue to consider longer and longer trends, the human-induced signal becomes more and more evident (stronger relative to the noise). In previous OHC detection and attribution studies, they have used a different method and were not able to show this time evolution of the signal trend.
Many thanks to Catia Domingues for her feedback on this post and assistance in clarifying the technical points of Gleckler et al.


 0
0  0
0


Comments