Climate Science Glossary

Term Lookup

Enter a term in the search box to find its definition.

Settings

Use the controls in the far right panel to increase or decrease the number of terms automatically displayed (or to completely turn that feature off).

Term Lookup

Settings


All IPCC definitions taken from Climate Change 2007: The Physical Science Basis. Working Group I Contribution to the Fourth Assessment Report of the Intergovernmental Panel on Climate Change, Annex I, Glossary, pp. 941-954. Cambridge University Press.

Home Arguments Software Resources Comments The Consensus Project Translations About Support

Bluesky Facebook LinkedIn Mastodon MeWe

Twitter YouTube RSS Posts RSS Comments Email Subscribe


Climate's changed before
It's the sun
It's not bad
There is no consensus
It's cooling
Models are unreliable
Temp record is unreliable
Animals and plants can adapt
It hasn't warmed since 1998
Antarctica is gaining ice
View All Arguments...


Username
Password
New? Register here
Forgot your password?

Latest Posts

Archives

Does record snowfall disprove global warming?

Posted on 7 March 2010 by John Cook

The 2009/2010 winter saw a number of dramatic, record breaking snowstorms. Early February saw two "once in a 100 years" snowstorms hit Philadelphia, now being dubbed "Snowmageddon". Does record snowfall prove that global warming isn't happening? What do observations say? 2009 was the second hottest year on record. January 2010 was the hottest January in the UAH satellite record. Satellites data indicates last month was the second hottest February in the satellite record. Observations tell us that rumours of global warming's death have been greatly exaggerated. 
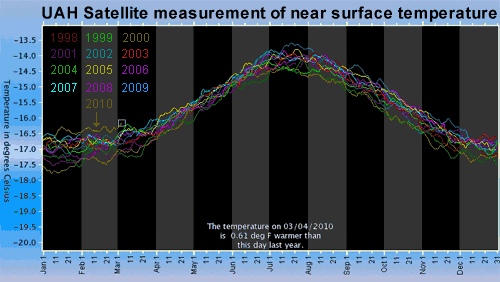
UAH Satellite temperature of near surface layer
Figure 1: UAH satellite measurement of near surface temperature. January 2010 is the hottest January in the satellite record. February 2010 is the second hottest February in the satellite record. Click on the image for larger version.

If global warming is still happening, why are some areas experiencing record snowfall events? As climate warms, evaporation from the ocean increases. This results in more water vapour in the air. Globally, atmospheric water vapour has increased by about 5% over the 20th century. Most of the increase has occurred since 1970 (IPCC AR4 3.4.2.1). This is confirmed by satellites that find the total atmospheric moisture content has been increasing since measurements began in 1988 (Santer 2007).
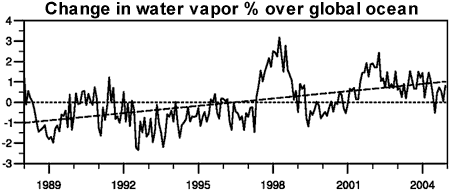
Change in water vapor % over global ocean
Figure 2: Change in water vapor percentage relative to the 1988 to 2004 period over the global ocean plus linear trend, measured by satellite (
IPCC AR4 3.4.2.1).

The extra moisture in the air is expected to produce more precipitation, including more extreme precipitation events. Observations bear this out. A study of precipitation trends over the United States found that heavy precipitation events (over 50mm in a day) have increased 20% over the 20th Century (Groisman 2004). Most of this increase occured after 1970. Various  analyses of precipitation over the globe have similarly found a widespread increase in heavy precipitation days since 1950 (Alexander 2006, Groisman 2006).
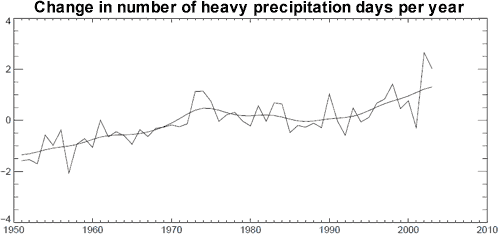

Figure 3: Global number of days per year when precipitation was greater than 10mm per day, expressed as an anomaly from the 1961 tp 1990 reference period (Alexander 2006).

Snowstorms can occur if temperatures are in the range of -10°C to 0°C. Global warming decreases the likeliness of snowstorm conditions in warmer, southern regions. However, in northern, colder regions, temperatures are often too cold for very heavy snow so warming can bring more favourable snowstorm conditions (Kunkel 2008). This is borne out in observations. Over the last century, there has been a downward trend in snowstorms across the lower Midwest, South and West Coast. Conversely, there's been an increase in snowstorms in the upper Midwest East, and Northeast with the overall national trend also upwards (Changnon 2006).

To claim that record snowfall is inconsistent with a warming world betrays a lack of understanding of the link between global warming and extreme precipitation. Global temperatures in the last few months of record snowfall are some of the hottest on record. Warming causes more moisture in the air which leads to more extreme precipitation events. This includes more heavy snowstorms in regions where snowfall conditions are favourable. Far from contradicting global warming, record snowfall is predicted by climate models and consistent with our expectation of more extreme precipitation events.

UPDATE 8 Mar 2010: Based on some of the comments below, a few clarifying points are in order. Global warming cannot be said to cause a specific snowstorm or any extreme weather event for that matter. An appropriate metaphor to explain the difference between weather and climate is the rolling of a die. An extreme precipitation event is like rolling a six. The result is based on random, chaotic processes. However, if you weight the die, this increases the chances of rolling a six. Similarly, global warming increases the chances of extreme precipitation events.

Global warming does not lead to increased snowstorms everywhere. They only increase in colder regions where the temperature still remains below freezing despite warming trends. Snowstorms are currently decreasing in warmer areas. Overall, the total amount of snow cover has shown a long-term decreasing trend.

So to summate, record snowfall neither proves nor disproves global warming. However, the increasing trend in extreme precipitation events is consistent with global warming. And this will lead to increased snowstorms in certain, colder regions.

0 0

Printable Version  |  Link to this page

Comments

1  2  Next

Comments 1 to 50 out of 71:

  1. Any relation to Baltic Sea incident?
    0 0
  2. I agree, someone who claims that, might have either low understanding of climate, or a biased view. According to Dr David Viner, a senior research scientist at the climatic research unit (CRU) of the University of East Anglia,within a few years winter snowfall will become "a very rare and exciting event". "Children just aren't going to know what snow is," he said. http://www.independent.co.uk/environment/snowfalls-are-now-just-a-thing-of-the-past-724017.html
    0 0
  3. Sordnay - It seems Dr. Viner was not that far off. The article you referenced (from 2000), quotes Dr. Viner as saying that heavy snow will return occasionally and that "Snow will probably cause chaos in 20 years time". Coincidentally, a line from a BBC item in January 2010 was: "Heavy snow and icy roads are causing chaos across most of the UK"
    0 0
  4. Hi MikeTheInfidel "Can you provide an example from the peer-reviewed literature where anyone was saying that (i.e., Lack of snow was billed in the past as proof for global warming)?" 1. A 2005 Columbia University study titled “WILL CLIMATE CHANGE AFFECT SNOW COVER OVER NORTH AMERICA?” ran nine climate models used by the IPCC, and all nine predicted that North American winter snow cover would decline significantly, starting in about 1990. See: http://www.eee.columbia.edu/research-projects/water_resources/climate-change-snow-cover/index.html 2. Global warming, the heating of the atmosphere by increased amounts of industrial gases, is now accepted as a reality by the international community. Average temperatures in Britain were nearly 0.6°C higher in the Nineties than in 1960-90, and it is estimated that they will increase by 0.2C every decade over the coming century. Eight of the 10 hottest years on record occurred in the Nineties. However, the warming is so far manifesting itself more in winters which are less cold than in much hotter summers. According to Dr David Viner, a senior research scientist at the climatic research unit (CRU) of the University of East Anglia,within a few years winter snowfall will become "a very rare and exciting event". "Children just aren't going to know what snow is," he said. (see: http://www.independent.co.uk/environment/snowfalls-are-now-just-a-thing-of-the-past-724017.html) Yes, the world is warming, but it appears that AGW claims of the demise of snowfall have been exaggerated. And things are not looking very good for the climate model predictions of declining snowfall in the 21st century. - Cheers, Christopher Skyi http://libertarianromanticideal.com/
    0 0
  5. EOttawa, right, he is saying both, it won't snow and it will, he is betting both on black and red at the same time. The problem is that snow area covered and volume aren't being affected too much, if anything they are both increasing, so telling that snow will become a rare event one year that snows relatively less than normal, and the oposite when is greater than normal, that seems biased.
    0 0
  6. For nearly 60 years I have been seriously involved in some way with snow. I was a skier and a mountain climber when my body allowed it. By the time I was 20 I was interested in avalanches and winter travel and survival and rescue. I kept daily high and low temperature and precipitation records so I would understand the history of the snowpacks in the back country I hoped to visit over the winter. So I understood better than most people the temperatures and other conditions under which snow fell, arranged itself on the ground, and metamorphosed through a series of magical transformations — many of them dangerous to winter travelers. For about ten years I taught snow and avalanche courses for the National Ski Patrol. And I taught that the heaviest snows, those that piled up snow most rapidly, fell at temperatures somewhere between 25 and 35 degrees F. I explained why snow that falls when it is much colder is too fine and powdery to amount to much until redistributed by wind. And on and on. And yet. And yet I have had students who had been skiers for many years who seem never to have noticed this effect, and who would want to argue with me in class that the colder the climate the more snow it got. They would point out that there are glaciers hundreds of feet deep at the poles, and perpetual snows on a lot of mountain tops where it was noticeably and measurably colder than down here in the balmy valley. Explaining that in these special locations any precipitation they get is snow, the small amounts of snow that fall annually can stay (or used to be able to stay) there for centuries upon centuries. I had some students who just never bought it. And there will be a lot of deniers who will simply refuse to buy this. There are a lot of cable TV talk show hosts who will argue that the scientists just made this excuse up after the fact to cover their butts. Wait and see. A harder sell is why have all my tomatoes and strawberries from Florida frozen?
    0 0
  7. Nice chart! It was also unusually cold, and we had higher than recent average levels of snow here in the UK this winter. I have bodged together a quick regional temperature chart sequence on UK (CET) variations and trend. http://www.youtube.com/watch?v=kqIQfD2UKAs I haven't tried to correlate with regional precipitation yet to make it more relevent to this post, but the UK Meteorological Office have excellent records, and may have some graphics somewhere.
    0 0
  8. I recommend the earlier post on this site about glaciers. Some glaciers in the Himalaya region are growing because above about 15,000 feet or so all precipitation is in the form of snow, and the monsoons are being redirected to parts of the mountains so that they will get a lot more precipitation. What happens to the glaciers from which the monsoon is being removed? Well they will shrink. Some may even disappear within 20 years or so. By the way, that posting has about 80 or so of the most absurd trash one can imagine. Don't go there if you aren't prepared to have your head buzz and your ears ring.
    0 0
  9. Hi EOttawa you say: "Dr. Viner was not that far off. The article you referenced (from 2000), quotes Dr. Viner as saying that heavy snow will return occasionally and that "Snow will probably cause chaos in 20 years time"." Are you saying that heavy snow fall did disappear for awhile and now just returned? Rutgers University Global Snow Lab numbers (http://climate.rutgers.edu/snowcover/files/moncov.nhland.txt) doesn't support that. The Snow lab numbers (1967-2010) show that the just completed decade (2001-2010) had the snowiest Northern Hemisphere winters on record. The just completed winter was also the second snowiest on record, exceeded only by 1978. Average winter snow extent during the past decade was greater than 45,500,000 km2, beating out the 1960s by about 70,000 km2, and beating out the 1990s by nearly 1,000,000 km2. - Cheers, Christopher Skyi http://libertarianromanticideal.com/
    0 0
  10. Nickle, # 6: This is entirely likely to occur. The most basic laws of physics expect it to: 1) warmer SSTs = more evaporation 2) warmer air (even if it's -5 instead of -15) carries more moisture Add in a nor-easter, where the air is warmed as it circulates across the Gulf Stream then piles back into the Eastern Seaboard and meets cool arctic Northerlies, and Hey Presto! One big dumping of snow! Until it becomes so warm that snow is not possible, expect bigger & bigger dumpings! Cheers - John
    0 0
  11. Come on, guys. This isn't that hard to understand. If there's more moisture in the air, there's going to be more precipitation. If it is cold enough to snow, that precipitation will be in the form of snow. There hasn't been enough warming to banish winter yet. It may snow less often, but when it snows, it will snow more (on average). That's just the laws of physics. Learn them.
    0 0
  12. The earlier article talks about positive feedback due to methane, but here nothing about negative feedback due to higher albedo produced by snow cover.
    0 0
    Response: This is a good question. While there has been an increase in extreme snowstorm events in some colder regions, this doesn't mean snow cover is showing a long-term increase. In fact, the long-term trend for Northern Hemisphere is a decreasing trend (see Tamino's Cherry Snow for a detailed analysis of snow cover trends). In fact, one paper does examine the question of feedback from changing snow cover: Assessing Snow Albedo Feedback in Simulated Climate Change (Qu 2004). So if there is any feedback from changing snow cover, it's a positive feedback.
  13. The earlier article talks about positive feedback due to methane, but here nothing about negative feedback due to higher albedo produced by snow cover.
    No one said all-year-round global snow cover will increase with global warming. It's clear that during glacial periods, there was more ice globally. It's also clear that during very warm historical periods (e.g. the Eocene-Paleocene Thermal Maximum), there was little ice, and hence the Earth's albedo was lower. It's a positive feedback overall.
    0 0
  14. good article here john, thanks. in my opinion this just shows how compicated weather is and how little we know (or at least I know). in my opinion, and in the opinion of others who have posted here, this increased evaporation which will lead to increased precipitation (and clouds). Correct me if i'm wrong but won't that be a negative feedback (not only from the sun reflection from the clouds but also the snow albedo)? in reading the peer reviewed papers, there seems to be great uncertainty in the models with how to handle clouds. in Ramanathan's paper (http://www-ramanathan.ucsd.edu/RamAmbio.pdf), he outlines very well that a good estimate based on ERBE observations show clouds have a net cooling of around 18 W/m^2 which dwarfs the positive feedback from CO2 which is 2.5 W/m^2 but we don't know how clouds will respond to increased SST. But if the increase in SST causes more evaporation and more clouds wouldn't this cancel out any CO2 effect?
    0 0
    Response: If clouds were imposing a cooling forcing of 18 W/m2, the Earth would be experiencing a dramatic, negative energy imbalance and global temperatures would be plummeting precipitiously. That is not what is happening - the planet has a positive energy imbalance of around 0.8 W/m2.

    However, the change in cloud cover has had a cooling effect - it's estimated the radiative forcing from 1850 to 2000 was a cooling of -0.7 W/m2. I couldn't tell you off the top of my head how much of that is estimated from increased water vapor - my understanding is the main contributor to increased cloud cover is increased aerosols in the atmosphere which enhances cloud formation.

    Since 2000, several different satellite datasets show very little trend in cloud cover  (Loeb 2007a):


    There's a more detailed discussion on albedo at The albedo effect and global warming.
  15. 16.RSVP at 07:03 AM on 8 March, 2010 I'm sure there will be an albedo effect, but it's going to be relatively small in Winter. May be oversimplifying, but extra snow cover in places that normally don't see much is not exactly long lived once the clouds get out of the way and a relatively small extra percentage of the Earths surface is affected. If it got deep enough (or cold enough) to stay until summer in NH, then we'd have an issue, eg Greenland throws back a lot of incoming sunlight in early summer. I'll have a look for papers on this though.
    0 0
  16. garythompson, the 18 W/m^2 is where we are now, i.e. the sum of short and long wavelength effects. What matters for the future is how this number might change with warming. On the cloud feedback there's still a lot to learn, but generally it is considered to be positive.
    0 0
  17. These recent events are merely indicators that the natural climate cycle is about to, or has, entered another cooling cycle which will last several decades. Just as the predictions back in the 70's of a coming ice age were made by projecting from the then ending downward cooling cycle, the more recent doom and gloom global warming scenarios were being made by projecting from a soon to end upward warming cycle. More realistic projections can be made from the trend established by a number of these multi-decadal natural cycles rather than data obtained from the ridiculously short part cycle time frames that have been used merely because new technology has only allowed more accurate data to be collected over such a short period. I often wonder what would have been the case if the current technology for data collection had been available immediately post WW2 and used to make long term predictions. Perhaps it would have given the global cooling predictions the same credibility as the current global warming predictions have. There is no doubt that there is a long term warming trend, but at times the natural cycles may enhance it, and other times overwhelm it, and perhaps we are presently in the transition of moving from a period of the former to the latter.
    0 0
    Response: The best type of climate projection comes from a physical understanding of what's happening in our climate. The 1970s is a good example. Some looked at the cooling trend and projected continued cooling into the future. However, others looked at the rising carbon dioxide in the atmosphere and aware of the greenhouse effect it causes, predicted that temperatures would start to warm. For this reason, the majority of papers in the 1970s that looked at future climate predicted warming due to rising CO2 levels.
  18. The point you make in this post, while it is true in general, does not apply to the so called "snowmageddon" events. Both of those major east coast snow storms were associated with COLDER than average temperatures in those regions. Because of this you can not imply that they were caused by warmer air and hence more water vapor. I think a better way to address snowstorms and global warming is to emphasize that weather is not climate. The 2000's decade set 2X more record high temperatures than record low temperatures (in the United States) but that does not mean that record low temperatures are no longer seen - that is simply weather. http://www.ucar.edu/news/releases/2009/maxmin.jsp In general, great website. Keep up the good work!
    0 0
    Response: Thanks for the comment. I wasn't trying to make the point that "global warming caused snowmageddon" but that "record snowfall does not contradict global warming". Perhaps I could have communicated that more clearly. When I was writing the post, I had a whole bit about weather vs climate with the weighted dice metaphor but cut it for brevity's sake. Maybe I should have left it in but fortunately I can always include it in the Record snowfall disproves global warming skeptic argument.
  19. John #10 The case with -15 to -5 is clear, and I do agree. You also say "Until it becomes so warm that snow is not possible" so it seems obvious to me that where temperature where (at preindustrial times) just close to minimum in order to snow, now after the experienced warming, that it should be harder to see snow, then the more warming the less area covered, right? Is that what it's happening? There is a statistical correlation between global warming anomaly and snow cover anomaly? If there is not, should anyone make any statement at all?
    0 0
  20. Is there any chance of posting a chart comparing the historic % atmospheric water vapour against CO2 levels from the last ice age to present? If the water vapour content of the atmosphere is a direct function of temperature, and CO2 is the primary forcing agent of temperature, such a chart should illustrate how well the CO2/water vapour relationship has been maintained as the planet has warmed.
    0 0
  21. ptbrown31, it isn't just the air temperature; the water temperature plays a big role too. You are right to emphasize that snowstorms are weather events, not climate. But it is also true that storms will tend to be more intense, the warmer the atmosphere and the warmer the oceans.
    0 0
  22. This (northern hemisphere) winter had some unusual weather patterns. It was warmer than average overall, but colder than average over the major population centers known as Europe and the eastern US. So the warmth was mostly over the oceans. It's pretty easy to see what had to happen - the warm air over the Atlantic would get loaded up with moisture, and then, following whatever regional circulation was present, would get swept over colder land and air masses - voila, surprising amounts of snow in the UK and the eastern US.
    0 0
  23. Sordnay, I don't know about globally (I'm sure someone has done it) but for the continental US, Tamino at OpenMind showed quite conclusively that the annual snow cover is decreasing, but that that decrease is entirely attributable to earlier spring melting and "higher" (up mountains) melting through spring and summer. Winter snow cover isn't changing to any statistically significant degree.
    0 0
  24. libertarianromanticideal, The article from the Independent that I was responding to focused primarily on Britain. Several paragraphs in that article (from 2000) did indeed cite anecdotal evidence of less wintery conditions, including snowfalls.
    0 0
  25. hello, happens so the AO broke and the arctic dumped, it happens every few years. thats weather. since i assume differential heating is the cause for most weather i would look at the temp changes near the arctic. this is purely a guess but its something a meteorologist can look at since weather is forecasting the noise and climate science is doing away with the noise. eventually we will get some overlap the two sciences will complement each other.
    0 0
  26. Similarly to some others, I don't see any particular need to discuss 'snowmageddon' in a climate context. Weather will always happen, and will surprise now and then. Now, if we start seeing 'snowmageddon' every year for the next 10 years, then we might take a closer if there is any climate context.
    0 0
  27. #18 - Riccardo - Can you send that link again, it appears to be in error (can't click on it). thanks!
    0 0
  28. johnd # 19 You mention the predictions made in the 1970s. I don't know if John Cook has a pagehere but this site has a good history of what actually was predicted in the 1970s. It doesn't appear to be the clear cut cooling as one might get the impression of. http://laymans-guide.com/new-ice-age/
    0 0
    Response: I do have a page on the subject: Ice age predicted in the 70s. The page you linked to, A New Ice Age, is an outstanding summary of the whole 'ice age in the 1970s' situation. I've added it to the list of links about the 1970s ice age predictions.
  29. "... 2009 was the second hottest year on record." The key phrase here is "on record". Now when you state "the record" doesn't go back very far, and isn't comprehensive to start with, THEN you can go into your snowfall arguments. What you can take away from snowageddon, is that people don't like cold weather or heavy snow. Which is why global warming is a political non-starter. Given a choice folks like warm weather and will do what it takes to adapt.
    0 0
  30. johnd: I think predictions of a coming ice age based on one very cold and snowy winter may be a touch premature. However,if the snow cover proves unusually enduring, you may be onto something because albedo and like mechanisms begin to come into play. jimalakirti: the reference to the earlier postings on Himalayan Glaciers is very much to the point. The survival of these glaciers is very much monsoon dependent. Irrespective of glacier survival, increased water vapour and increased precipitation should predict less dire consequences for population living in areas dependent of Himalayan water run off. Or do they? Satellite data indicating rising sea levels notwithstanding, if increased temperature leads to increased atmospheric water, does most of the increased water vapour stay in the atmosphere thus providing a negative feedback on sea level rise? Or does the water simply cycle faster with no mitigating impact on sea levels? Assuming some rise in precipitation, would increased rainfall provide welcome change to the world's driest areas ranging from the Sahara to the Gobi? Three potentially very different implications flowing from the one phenomenon, the relationship between temperature, water vapour, and precipitation.
    0 0
  31. #30 chirscanaris, in many parts of high mountain Asia, agriculture is dependent on glacier melt because of the timing of the rain. The snowpack melts too quickly in spring, and they need the extended runoff from spring melting of glaciers. They can't afford to wait until the monsoon rains come to plant because the growing season would be too short. The specifics are no doubt place-dependent, but they might need the timing of rain to change in addition to the amount of precip. For your sea level question, I think the mass of water vapor that can stay in the atmosphere is small enough that it's a fairly small affect. As for the Sahara and Gobi, that's a good question and I would like to know the answer as well. If precipitation patterns change, some places will come out better off and some will end up worse off (either getting drier, or getting too soggy). I don't know if the winners and losers of that can be predicted with any confidence (the WG2 report of the IPCC is probably the place to look).
    0 0
  32. This may be off-topic, but it is inspired by Figure 2 in the post. Here's another question that I have been wondering about after seeing Figure 2. There is a big spike in 1998 (maybe 1997-1999) in water vapor over the ocean. 1997-1998 was a whopping El Nino year, and there was some pretty amazing rainfall in some places that year. I experience some of that in Tibet that August, where we were trying to work (but not having much success) because it was the worst flooding in many years due to the heavy rainfall. One of my students was in Ecuador in early 1998, and they were also getting the worst floods in years. The same time period also shows up as an anomalous when you look at the earth's oblateness (deviation from being a sphere). See this paper for example: http://www.sciencemag.org/cgi/content/full/298/5600/1975 What's interesting about this is that the change in oblateness has the look of an event, a short-term change opposite to the usual trend as opposed to a change in trend, which has made the explanation advanced in the paper somewhat controversial. Since that time, as far as I know, oblateness has continued to decrease following the post-glacial rebound trend. I'm posting this question here because I wonder how many other global-averaged quantities had unusual values that year (global temperature was another)? Just fishing for ideas here and looking for replies about climate-related quantities because I can find the solid-earth ones easily enough myself. Here's the abstract of the Dickey et al paper: Earth's dynamic oblateness (J2) has been decreasing due to postglacial rebound (PGR). However, J2 began to increase in 1997, indicating a pronounced global-scale mass redistribution within Earth's system. We have determined that the observed increases in J2 are caused primarily by a recent surge in subpolar glacial melting and by mass shifts in the Southern, Pacific, and Indian oceans. When these effects are removed, the residual trend in J2 (-2.9 x 10⁻¹¹ year-1) becomes consistent with previous estimates of PGR from satellite and eclipse data. The climatic significance of these rapid shifts in glacial and oceanic mass, however, remains to be investigated.
    0 0
  33. I do not know if the snow fall event in England this January was directly linked to climate warming or not, but it is logical. A number of months back I saw a description of the thermohaline circulation (which transports equatorial heat to North-West Europe) and learned that this current is (in part)driven by temperature differences between the equator and poles. As the poles get warmer, the current will deliver less warmth to Europe. Remembering that Moscow and Glasgow are both at the same latitude (55 degrees N), the people in Scotland could end up receiving harder Moscow-like winters.
    0 0
  34. neilrieck: Good point about thermohaline circulation. Jeff: An intriguing post about the earth's oblateness. In relation to both your posts, I assume Tibet would be very much the kind of territory dependent on glacial melt for irrigation. Ecuador would be similar I suspect. Your 1997/1998 experience of torrential rain in Tibet during the great ENSO together with your student's experiences in Ecuador that year is anecdotal evidence of potentially complex hydrological responses to warming in these regions.
    0 0
  35. It pains me to meekly agree with almost everything in this post. The recent record cold in so many places in the USA and Europe proves absolutely nothing about climate trends. Given the current SSTs (highest since 1998) it would not surprise if this winter's snow records will be followed by a very warm summer in many places.
    0 0
  36. gallopingcamel at 15:48 PM on 8 March, 2010 There was no record cold in December or January in the U.S. Just take a look at these reports: http://www.ncdc.noaa.gov/sotc/?report=national&year=2010&month=1&submitted=Get+Report Notice there a no record cold states in Dec. or Jan. Record lows and record highs are a different story because that is just variability in the weather fluctuations. The long-term trend is for record highs to outpace lows as demonstrated by Meehl (2009). The cold weather in Eurasia and in the U.S was due to an extreme negative phase of the Arctic Oscillation. When this happens the surface pressure in the Arctic is relatively high and that allows the jet stream to weaken, and cause outbreaks of arctic air to move into middle latitudes. And the Arctic air being replaced by mid latitude air so the arctic is extremely warm. http://www.cpc.noaa.gov/products/precip/CWlink/daily_ao_index/ao_index.html This similar neg. AO pattern also happend last summer in the midwest U.S. which caused it to be a cool summer. The snowstorms on the east coast are consistent with El Nino bringing more precip up the coast clashing with arctic air which I described with the negative AO. These big precipitation events are consistent with global warming, but you can't say any weather extreme was caused by AGW. The southeast U.S., including Florida, was predicted to have a colder than usual winter this year by NOAA back in October: http://www.noaanews.noaa.gov/stories2009/20091015_winteroutlook.html
    0 0
  37. #34, chriscanaris, "I assume Tibet would be very much the kind of territory dependent on glacial melt for irrigation." Yes, very much so. I recently read a profile in Science that suggested the same was true of the mountainous areas of Nepal. As for Ecuador, it may be true at higher elevation, but not in the lowlands. But it is drier farther south in the Andes, and meltwater from glaciers is quite important in parts of Peru and Bolivia.
    0 0
  38. Jeff Freymueller at 17:45 PM on 8 March 2010 I find it helpful to think of glaciers as reservoirs and their possible disappearance as a simple, easily understood extension of that analogy. Try telling an engineer responsible for maintaining year round flow through a water utility that you're going to remove several of his impoundments and he should not worry because the total precipitation available to his utility will be unchanged or even increased and he'll call you crazy, with good reason.
    0 0
  39. I haven't checked the records here for intensity of precipitation, but it does seem as if when it rains it's heavier than years ago. I have looked at the records for annual and monthly precipitation and, even though this year we've had lots of rain, that's only compared to the last few dry years. Going on longer term averages, the rainfall is still below average where I live - in line with predictions. I'm going to have to get bigger gutters and more drainpipes for our roof, because the current ones can no longer cope with the heavy downpours, even after I've cleaned them out.
    0 0
  40. In Poland, the winter lasts longer than 3 months. On Saturday, I noted the minimum temperature: minus 15 deg C. As long as the current winter (in my meteorological station) I noted in 1983. And the current weather is part of the climate, especially when extreme events shows, if we accept the R. Pielke Seniors definition of climate.
    0 0
  41. How is one to read the curves in Figure 1? I have a little problem with some of the colours. - First, 13 years - 12 curves? - There are 3 yellow curves (incl. 2010) but only 2 yellow years. - There are 3 violet curves and 3 violet years; which is which? - Blue and green curves/years - which is which? - There is a grey year (2002). Where is the curve? - There are 2 red years, but only one red curve. Also, where are these very low temperatures between -14 and -18 to be found, and how relevant are they to ground temperatures?
    0 0
    Response:

    It is a little difficult to read so small. I suggest generating the image yourself via http://discover.itsc.uah.edu/amsutemps/ so you can experiment with different years and different altitudes yourself. The UAH webpage also explains the brightness temperature (to some extent anyway).

  42. Sometimes what is subjectively perceived by humans as a hard winter has nothing to do with cold but everything to do with snowfall (because we need to shovel it). Consider the following hypothetical example: 1) in year "A" we have a winter that is 20C degrees below freezing but only snows once a week (where I live in Canada, there is hardly any snowfall when it is really cold) 2) in year "B" we have a winter that is 5C degrees below freezing but it snows three times a week. People would probably talk about the winter of year "B" unless someone was watching how much wood was burned in the fireplace :-) On a related note, I used to design work for a ground-source heat-pump manufacturer. That company had access to government-provided "degree-day charts" for every major location in the US and Canada going back 50 years (older stats were available). So if we want to compare this winter to others, detailed historical records do exist.
    0 0
  43. Surely the temperature scale on the side of figure 1 is wrong for surface temp. You can play with the UAH data yourself , here This is the official site for the data set?? Any idea why they only provide near surface data back to 2003 (it goes back to 1998 for higher altitudes).
    0 0
  44. Scrap that when you click on near surface on the side of the page you actually get surface temp.
    0 0
  45. Which raises the question what would increase humidity near surface or surface temperature?
    0 0
  46. #18 The key factor in producing more snow via a northeaster type of storm is ocean temperature. It is above normal sst that will drive higher evaporation. It is not the specific air temperature of the event that is the key. Interesting paper by Hirsch (2001) http://ams.allenpress.com/archive/1520-0442/14/5/pdf/i1520-0442-14-5-882.pdf #37 The main range of the Himalaya is unusual in that the wet season is also the melt season. Thus, for Nepal, Bhutan, Sikkim and adjacent areas of India, glacier loss will not be as important. The main accumulation in this area coincides with the main melt season. http://glacierchange.wordpress.com/2010/01/20/gangotri-glacier-retreat-and-hydropower/ and http://www.the-cryosphere.net/4/115/2010/tc-4-115-2010.pdf
    0 0
  47. This year's snow proves nothing. However, snowfall pattern for the last four decades does disprove carbon dioxide generated warming. Anyone can access Rutgers snowfiles and check the claim. Norhern Hemisphere snow cover extent has a strong upward trend for November, December & January, strongest for December and a downward trend for the rest of the year. Here is NH snow cover trend for weeks of year, in km^2/year units (1972-2009). If cooling is hampered (e.g. by carbon dioxide), one would expect snow trend to lag insolation. But it's just the opposite. On the other hand if trend is due to decreasing snow albedo, exactly the pattern observed is to be expected. Snow cover should increase while insolation is at its minimum, decrease otherwise. In fact snow trend even precedes insolation slightly, because dirt on snow has more darkening effect if snow is melting away (spring) than while it gets covered by fresh snow every now and then (fall). Simple. Snow is getting dirty, mainly because of soot. From diesel engine exhaust, tire wear, biomass burning and unfiltered smoke from chinese, russian & US coal fired power plants. Carbon dioxide has no effect on snowcover.
    0 0
  48. I realise John has said that any one record can't be put down to global warming but I wonder whether this even represents an extreme in precipitation. I had a look at NOAA's precipitation records for Philadelphia and Washington Taking John's definition of extreme precipitation as "(over 50mm in a day)" neither of those two records show a single day in Feb 2010 over 50mm. Snow depth is no measure of the actual amount of water that has fallen as density is variable. It worth looking at wikipedia for "snow". There is nothing for or against global climate change here, it isn't even consistent with our expectations, it's weather.
    0 0
  49. Berenyi Peter, your graph seems entirely consistent with CO2 driven AGW. Warmer temperatures are shrinking the amount of land which is snow covered year round and increasing precipitation is causing an increase in short term winter snow coverage. The net impact is a decreased annual average northern hemisphere albedo from snow. I see no basis for your claim that this chart suggests soot to be the primary cause of changes in snow cover. For instance, there is NO way that increasing soot could result in HIGHER snow coverage at any point of the year. Nor does it make any sense that the greatest downward snow cover anomaly would take place just BEFORE the Summer solstice... if anything the ongoing accumulation of soot throughout the year should mean increasing losses until fresh snowfall in Winter. "Carbon dioxide has no effect on snowcover." Without carbon dioxide the entire planet would be covered with snow and ice year round.
    0 0
  50. CBDunkerson at 04:05 AM on 9 March, 2010 Playing devil's advocated in a slightly twisted way, let me point out that soot will help nucleate precipitation. Available moisture for precipitation in the meantime is on the upswing thanks to warming of the oceans. It seems reasonable to hypothesize that the two phenomena in concert could actually lead to greater snowfall.
    0 0

1  2  Next

You need to be logged in to post a comment. Login via the left margin or if you're new, register here.


The Consensus Project Website

THE ESCALATOR

(free to republish)


© Copyright 2024 John Cook
Home | Translations | About Us | Privacy | Contact Us