


 Arguments


Has the greenhouse effect been falsified?
Posted on 19 May 2010 by sylas
Guest post by Chris Ho-Stuart
Most participants in climate debates can agree that the atmosphere's capacity to interact with thermal radiation helps maintain the Earth's surface temperature at a livable level. The Earth's surface is about 33 degrees Celsius warmer than required to radiate back all the absorbed energy from the Sun. This is possible only because most of this radiation is absorbed in the atmosphere, and what actually escapes out into space is mostly emitted from colder atmosphere.
This absorption is due to trace gases which make up only a very small part of the atmosphere. Such gases are opaque to thermal radiation, and are called "greenhouse gases". The most important greenhouse gases on Earth are water vapor and carbon dioxide, with additional contributions from methane, nitrous oxide, ozone, and others. If the atmosphere was simply a dry mix of its major constituents, Oxygen and Nitrogen, the Earth would freeze over completely.
Observing the greenhouse effect in action
The simplest direct observation of the greenhouse effect at work is atmospheric backradiation. Any substance that absorbs thermal radiation will also emit thermal radiation; this is a consequence of Kirchoff's law. The atmosphere absorbs thermal radiation because of the trace greenhouse gases, and also emits thermal radiation, in all directions. This thermal emission can be measured from the surface and also from space. The surface of the Earth actually receives in total more radiation from the atmosphere than it does from the Sun.
The net flow of radiant heat is still upwards from the surface to the atmosphere, because the upwards thermal emission is greater than the downwards atmospheric backradiation. This is a simple consequence of the second law of thermodynamics. The magnitude of the net flow of heat is the difference between the radiant energy flowing in each direction. Because of the backradiation, the surface temperature and the upwards thermal radiation is much larger than if there was no greenhouse effect.
Atmospheric backradiation has been directly measured for over fifty years. The effects of greenhouse gases stand out clearly in modern measurements, which are able to show a complete spectrum.

Figure 1. Coincident measurements of the infrared emission spectrum of the cloudfree atmosphere at (a) 20km looking downward over the Arctic ice sheet and (b) at the surface looking upwards. (Data courtesy of David Tobin, Space Science and Engineering Center, University of Wisconsin-Madison. Diagram courtesy of Grant Petty, from Petty 2006).
When you look down from aircraft at 20km altitude (Fig 1a), what is "seen" is the thermal radiation from Earth that gets out to that height. Some of that radiation comes from the surface. This is the parts of the spectrum that follow a line corresponding in the diagram to about 268K. Some of that radiation comes from high in the atmosphere, where it is much colder. This is the parts of the spectrum that follow a line of something like 225K. The bites taken out of the spectrum are in those bands where greenhouse gases absorb radiation from the surface, and so the radiation that eventually escapes to space is actually emitted high in the atmosphere.
When you look up from the surface (Fig 1b), what is "seen" is thermal backradiation from the atmosphere. In some frequencies, thermal radiation is blocked very efficiently, and the backradiation shows the temperature of the warm air right near the surface. In the "infrared window" of the atmosphere, the atmosphere is transparent. In these frequencies, no radiation is absorbed, no radiation is emitted, and here is where IR telescopes and microwave sounding satellites can look out to space, and down to the surface, respectively.
The smooth dotted lines in the diagram labeled with temperatures are the curves for a simple blackbody radiating at that temperature. Water vapor has complex absorption spectrum, and it is not well mixed in the atmosphere. The emissions seen below 600 cm-1 are due to water vapor appearing at various altitudes. Carbon dioxide is the major contributor for emission seen between between about 600 and 750 cm-1. The patch of emission just above 1000 cm-1 is due to ozone.
The term "greenhouse"
The term "greenhouse" was coined for this atmospheric effect in the nineteenth century. A glass greenhouse and an atmospheric greenhouse both involve a physical barrier that blocks the flow of heat, leading to a warmer temperature below the barrier. The underlying physics is different, however. A glass greenhouse works primarily by blocking convection, and an atmospheric greenhouse works primarily by blocking thermal radiation, and so the comparison is not exact. This difference is well understood and explained in most introductions to the subject. Where confusion arises, it is usually the glasshouse that is improperly described, rather than the atmospheric greenhouse effect.
The enhanced greenhouse effect
The greenhouse effect itself has always been an important effect on Earth's climate, and it is essential for maintaining a livable environment. Without it, the surface would rapidly freeze.
The existence of a greenhouse effect itself should not be confused with changes to the greenhouse effect. Global warming in the modern era is being driven by increasing concentrations of greenhouse gases in the atmosphere, which leads to an enhanced greenhouse effect. This is covered in more detail as a separate argument: How do we know more CO2 is causing warming?
Many thanks to Chris Ho-Stuart for this guest post. Chris is co-author of the recently published paper Comment on "Falsification of the atmospheric CO2 Greenhouse Effects within the frame of physics" (Halpern et al 2010). which is a peer-reviewed response to the paper by Gerlich and Tscheuschner which claims to falsify the greenhouse effect. Chris also runs Climate Physics Forums which is a very high quality forum featuring substantive and courteous discussions of climate science. There is also a discussion thread on the Halpern et al paper.
- Most textbooks on climate or atmospheric physics describe the greenhouse effect, and you can easily find these in a university library. Some examples include:
- Elementary Climate Physics, by F. W. Taylor (Oxford Uni Press 2005). Chapter 7 is about the greenhouse effect.
- Physical Principles of Meteorology and Environmental Physics, by D. Blake and R. Robson (World Scientific 2008). Chapter 1, "The Big Picture", can be freely downloaded and includes a good introduction to the greenhouse effect.
- Principles of Planetary Climate, by R. Pierrehumbert (Cambridge Uni Press 2010). This will be available from December 2010, and goes into considerable detail of the greenhouse effect and the associated physics.
- A First Course in Atmospheric Radiation, by G. W. Petty (Sundog publishing, 2006). Covers the underlying physics of the greenhouse effect.
- The Greenhouse Effect, part of a module on "Cycles of the Earth and Atmosphere" provided for teachers by the University Corporation for Atmospheric Research (UCAR).
- What is the greenhouse effect?, part of a FAQ provided by the European Environment Agency.


 0
0  0
0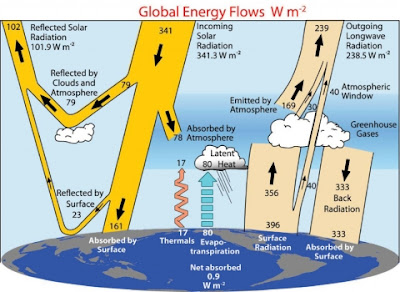 Basically, we are comparing the 184 W/m2 from the Sun which gets to the surface, and the 333 W/m2 which comes to the surface from the atmosphere.
It may also help to do a quick accounting with these numbers:
Total input to the surface (in W/m2):
184 Solar radiation
333 Atmospheric backradiation
---
517 Total
Total out from the surface:
23 Reflected solar radiation at the surface
17 Upwards atmospheric convection
80 Upwards latent heat of evaporation
396 Thermal radiation emitted by the surface
---
516 Total
Imbalance: 1 W/m2.
These numbers are not perfect. In fact, the lead author of the paper has been particularly strident in calling for better measuring systems to nail down the balance much better. There are several good pages here on that matter. See, for instance, Trenberth can't account for the lack of warming, and John's recent blog Tracking the energy from global warming, which explains some of the more direct attempts to measure the imbalance, and obtain values around about 0.6 ± 0.2
But to understand the point you have quoted, a crude estimate will suffice. The Earth's surface is quite warm (fortunately for us) and so it radiates a LOT of heat. On top of that, heat is carried away by sensible heat flows: convection and latent heat.
By conservation of energy, that has to balance what is being received, with any small imbalance being because the planet warming or cooling by absorbing extra energy or shedding it. At present, we have global warming, and the ocean is sucking up some of the available energy as it slowly increases in temperature. But even when there is no warming or cooling, you still have all that energy leaving the surface, which must balance with the energy coming in.
Most of the energy coming to the surface -- about 65% or so -- is atmospheric backradiation. Note that this has the advantage of coming in both night and day. Solar input in the day is larger, but at night it is zero. Without the natural greenhouse effect, nighttime temperature on Earth would plummet as the surface radiated away its energy straight into space.
Basically, we are comparing the 184 W/m2 from the Sun which gets to the surface, and the 333 W/m2 which comes to the surface from the atmosphere.
It may also help to do a quick accounting with these numbers:
Total input to the surface (in W/m2):
184 Solar radiation
333 Atmospheric backradiation
---
517 Total
Total out from the surface:
23 Reflected solar radiation at the surface
17 Upwards atmospheric convection
80 Upwards latent heat of evaporation
396 Thermal radiation emitted by the surface
---
516 Total
Imbalance: 1 W/m2.
These numbers are not perfect. In fact, the lead author of the paper has been particularly strident in calling for better measuring systems to nail down the balance much better. There are several good pages here on that matter. See, for instance, Trenberth can't account for the lack of warming, and John's recent blog Tracking the energy from global warming, which explains some of the more direct attempts to measure the imbalance, and obtain values around about 0.6 ± 0.2
But to understand the point you have quoted, a crude estimate will suffice. The Earth's surface is quite warm (fortunately for us) and so it radiates a LOT of heat. On top of that, heat is carried away by sensible heat flows: convection and latent heat.
By conservation of energy, that has to balance what is being received, with any small imbalance being because the planet warming or cooling by absorbing extra energy or shedding it. At present, we have global warming, and the ocean is sucking up some of the available energy as it slowly increases in temperature. But even when there is no warming or cooling, you still have all that energy leaving the surface, which must balance with the energy coming in.
Most of the energy coming to the surface -- about 65% or so -- is atmospheric backradiation. Note that this has the advantage of coming in both night and day. Solar input in the day is larger, but at night it is zero. Without the natural greenhouse effect, nighttime temperature on Earth would plummet as the surface radiated away its energy straight into space.
 You can easily verify for yourself that whenever I gets tiny compared to I0 ("radiation is blocked very efficiently"), τ should be large.
 Therefore some of the IR window radiation is absorbed on its way up, thermalized on a different local temperature and re-emitted, quite possibly on frequencies outside the window.
This is why determining actual surface temperature of the ice sheet below (near Barrow, Alaska) from IR window radiation can get quite tricky, even if emissivity spectra of ice and snow makes them almost perfect blackbodies in this frequency range.
Anyway, an ice sheet surface temperature of 275 K as claimed is not possible.
Therefore some of the IR window radiation is absorbed on its way up, thermalized on a different local temperature and re-emitted, quite possibly on frequencies outside the window.
This is why determining actual surface temperature of the ice sheet below (near Barrow, Alaska) from IR window radiation can get quite tricky, even if emissivity spectra of ice and snow makes them almost perfect blackbodies in this frequency range.
Anyway, an ice sheet surface temperature of 275 K as claimed is not possible.
 with ν = 100cκ (c is the speed of light, κ is wavenumber in cm-1) at 260 K peak of spectral radiance is found at 510 cm-1 to be 100 mW m-2 sr-1 cm indeed as shown by the second dashed line from above in Fig. 1 (a).
On the other hand, since IR transmittance in window is ~80%, spectral radiance coming from the ice sheet surface and measured at an altitude of 20 km can not be proper blackbody radiation, it must be an attenuated version of it. In other words the surface is seen as a grey body from there with emittance around 0.8 even if the surface itself is a close approximation of a black body in this frequency range. This must be so as in the stopband atmospheric absorptivity is orders of magnitude higher than in the window, therefore according to Kirchoff's law, almost all of the absorbed radiation after having got thermalized, is re-emitted outside the window.
It means the radiance curve in Fig. 1 can not be produced by actual measurement or if it was, what is shown is a scaled up version of values measured. Undocumented tricks like this are not helpful.
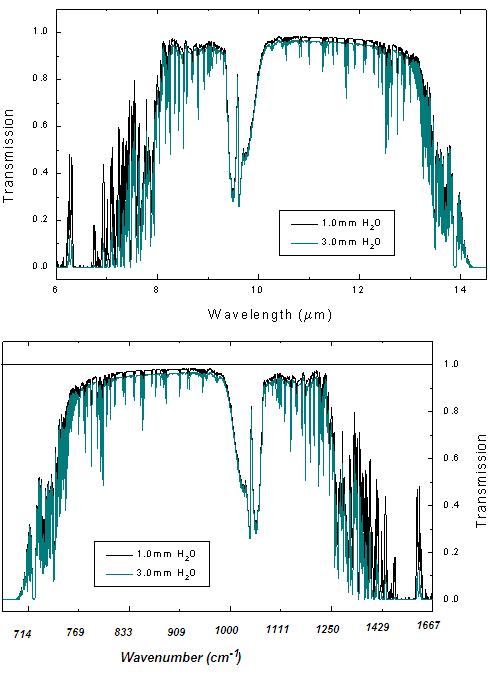
BTW, there are some actual IR transmission data for two observation sites (Cerro Pachon, 2700 m and Mauna Kea, 4200 m). It looks like at high altitudes with low atmospheric moisture IR windows get quite transparent. However, Barrow, Alaska is at sea level (elevation 3 m).
with ν = 100cκ (c is the speed of light, κ is wavenumber in cm-1) at 260 K peak of spectral radiance is found at 510 cm-1 to be 100 mW m-2 sr-1 cm indeed as shown by the second dashed line from above in Fig. 1 (a).
On the other hand, since IR transmittance in window is ~80%, spectral radiance coming from the ice sheet surface and measured at an altitude of 20 km can not be proper blackbody radiation, it must be an attenuated version of it. In other words the surface is seen as a grey body from there with emittance around 0.8 even if the surface itself is a close approximation of a black body in this frequency range. This must be so as in the stopband atmospheric absorptivity is orders of magnitude higher than in the window, therefore according to Kirchoff's law, almost all of the absorbed radiation after having got thermalized, is re-emitted outside the window.
It means the radiance curve in Fig. 1 can not be produced by actual measurement or if it was, what is shown is a scaled up version of values measured. Undocumented tricks like this are not helpful.
BTW, there are some actual IR transmission data for two observation sites (Cerro Pachon, 2700 m and Mauna Kea, 4200 m). It looks like at high altitudes with low atmospheric moisture IR windows get quite transparent. However, Barrow, Alaska is at sea level (elevation 3 m).
 This also shows what is wrong with the specific criticisms made against Figure 1 in the blog. Berényi says:
On the other hand, since IR transmittance in window is ~80%, [...snip...]
It means the radiance curve in Fig. 1 can not be produced by actual measurement or if it was, what is shown is a scaled up version of values measured. Undocumented tricks like this are not helpful.
Figure 1 is produced by actual, unscaled measurement. There are no undocumented tricks. Your problem here is assuming the ~80% IR transmittance. That is simply not valid. You can see clearly that it is not the case in Mauna Kea data either. And while you are right that Mauna Kea is high altitude... why not also note that the Artic is high latitude? It makes a comparable difference.
Mauna Kea is at an altitude of 4200m, which is enough to get about 90% of the water vapour in the atmosphere; quite so! But it is also in a humid climate, where you have a high tropopause and lots of water vapour at low altitude. So sure; at low altitude in Hawaii you would have less IR transmittance (though you cannot assume a globally based mean figure will be a good specific estimate for this or any other location). But the Arctic regions, where the Fig 1 data was collected, have much lower specific humidity than Hawaii.
Even if you don't trust the data I have supplied, you need a much better basis for presuming it is inaccurate and presuming to scold on that basis. Be skeptical by all means. I will try to get hold of the actual data myself if I can and follow up. But please be assured that I am not deliberately distorting things.
You remain the most helpful contributor here for cleaning up errors in the blog post. I'd like to continue a constructive engagement. You are welcome to be skeptical, but without being overly sensitive... I'd really appreciate a bit more credit myself for not trying to be deliberately deceptive. Can we do that?
Cheers -- sylas
This also shows what is wrong with the specific criticisms made against Figure 1 in the blog. Berényi says:
On the other hand, since IR transmittance in window is ~80%, [...snip...]
It means the radiance curve in Fig. 1 can not be produced by actual measurement or if it was, what is shown is a scaled up version of values measured. Undocumented tricks like this are not helpful.
Figure 1 is produced by actual, unscaled measurement. There are no undocumented tricks. Your problem here is assuming the ~80% IR transmittance. That is simply not valid. You can see clearly that it is not the case in Mauna Kea data either. And while you are right that Mauna Kea is high altitude... why not also note that the Artic is high latitude? It makes a comparable difference.
Mauna Kea is at an altitude of 4200m, which is enough to get about 90% of the water vapour in the atmosphere; quite so! But it is also in a humid climate, where you have a high tropopause and lots of water vapour at low altitude. So sure; at low altitude in Hawaii you would have less IR transmittance (though you cannot assume a globally based mean figure will be a good specific estimate for this or any other location). But the Arctic regions, where the Fig 1 data was collected, have much lower specific humidity than Hawaii.
Even if you don't trust the data I have supplied, you need a much better basis for presuming it is inaccurate and presuming to scold on that basis. Be skeptical by all means. I will try to get hold of the actual data myself if I can and follow up. But please be assured that I am not deliberately distorting things.
You remain the most helpful contributor here for cleaning up errors in the blog post. I'd like to continue a constructive engagement. You are welcome to be skeptical, but without being overly sensitive... I'd really appreciate a bit more credit myself for not trying to be deliberately deceptive. Can we do that?
Cheers -- sylas


Comments