Climate Science Glossary

Term Lookup

Enter a term in the search box to find its definition.

Settings

Use the controls in the far right panel to increase or decrease the number of terms automatically displayed (or to completely turn that feature off).

Term Lookup

Settings


All IPCC definitions taken from Climate Change 2007: The Physical Science Basis. Working Group I Contribution to the Fourth Assessment Report of the Intergovernmental Panel on Climate Change, Annex I, Glossary, pp. 941-954. Cambridge University Press.

Home Arguments Software Resources Comments The Consensus Project Translations About Support

Bluesky Facebook LinkedIn Mastodon MeWe

Twitter YouTube RSS Posts RSS Comments Email Subscribe


Climate's changed before
It's the sun
It's not bad
There is no consensus
It's cooling
Models are unreliable
Temp record is unreliable
Animals and plants can adapt
It hasn't warmed since 1998
Antarctica is gaining ice
View All Arguments...


Username
Password
New? Register here
Forgot your password?

Latest Posts

Archives

Is the long-term trend in CO2 caused by warming of the oceans?

Posted on 11 June 2010 by Ned

A new article by Lon Hocker at the website "Watts Up With That?" examines the relationship between global temperature and CO2 over the last three decades.  The article's conclusion is concisely summarised in its title:  The temperature rise has caused the CO2 increase, not the other way around. This conclusion would be rather startling if it were true, since the scientific consensus is that CO2 is currently acting as a "forcing" that warms the climate.  How does Hocker reach this conclusion, and is it reasonable?

The data used in Hocker's analysis are monthly atmospheric CO2 measurements at Mauna Loa (obtained from NOAA) and satellite-measured temperature data for the lower troposphere (from UAH, apparently using a subset of the global data over the oceans only).  The temperature data are recorded as anomalies, or differences between the actual temperature and the long-term mean. 

The Mauna Loa CO2 data show a long-term increase in atmospheric CO2 concentration.  The Mauna Loa data are the longest high-quality CO2 record, dating back to 1958.  While one might think that the side of a volcano might not be the best place to measure CO2, in fact the procedures used at Mauna Loa compensate for any contamination by volcanic gases.  As shown in Figure 1, since 1980 we have had global CO2 data from a network of stations, and these data show that the Mauna Loa trend is very representative of the global trend in CO2.
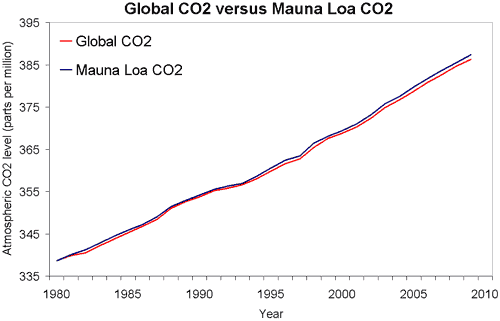
 

 Figure 1: Global atmospheric CO2 (NOAA) versus Mauna Loa CO2 (NOAA).

Hocker begins his analysis by calculating the first derivative of the CO2 data.  He does this using the difference between the CO2 measurement six months after a given month and the measurement six months before.  (Calculating this difference over a 12-month interval effectively removes the seasonal variation in atmospheric CO2 concentration.)

At this point, alert readers may begin to glimpse the flaw in Hocker's methods.  However, let's follow Hocker through to his conclusion. 

He derives a simple model to estimate the temperature anomaly as a function of the derivative of CO2 concentration:

 Temperature Anomaly = (CO2[n+6] – CO2[n-6])/(12*0.22) – 0.58

 Hocker's Figure 2 shows a comparison of the observed and modeled global ocean temperature anomaly:
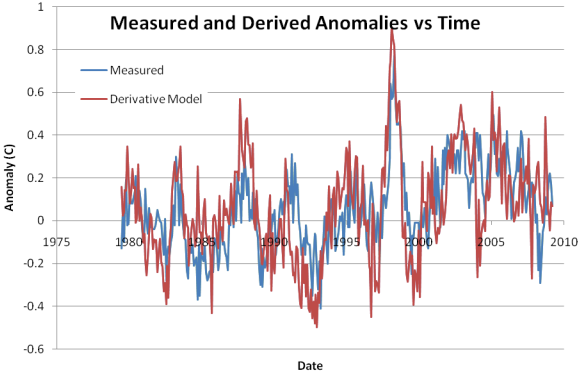

Figure 2.  Comparison of global lower troposphere temperature anomaly over the oceans (blue line) to a model based on the first derivative of atmospheric CO2 concentration at Mauna Loa (red line).  From Hocker 2010.

Looking at this figure, Hocker notes "There is a strong correlation between the measured anomaly and the Derivative model.  It shows the strong El Niño of 1997-1998 very clearly, and also shows the other El Niño events during the plotted time period about as well as the satellite data does."  He does not quantify the correlation between the two, but the squared correlation coefficient (r2) for the two time series is 0.36.

Let's pause here to consider the actual effect of Hocker's methods to this point.  Taking the first derivative of the CO2 data removes the long-term trend in CO2 concentration, and shows the effect of short-term variability around that trend.  Thus, it would be appropriate to conclude from this that short-term fluctuations in the overall upward CO2 trend are moderately well correlated with temperatures in the lower troposphere over oceans.

What Hocker actually concludes is quite different:  "Using two well accepted data sets, a simple model can be used to show that the rise in CO2 is a result of the temperature anomaly, not the other way around.  This is the exact opposite of the IPCC model that claims that rising CO2 causes the temperature anomaly." 

In other words, Hocker is claiming that his model shows that the long-term upward trend in CO2 is explained by temperature, when his methods actually removed the long-term trend.

This is where the previously-mentioned alert readers will be nodding their heads and saying "Yes!  We knew it!"  The error that Hocker makes - taking the derivative of a time series to remove its long-term trend, then correlating a second data set with this derivative, and finally claiming the second data set explains the long-term trend - is exactly the same error that was recently discovered in a prominent "skeptical" paper by McLean 2009.  McLean correlated an index of the El Niño/Southern Oscillation with the first derivative of temperature, while Hocker correlates temperature with the first derivative of CO2 concentration.  Perhaps if Hocker were an avid reader of Skeptical Science, he would have been familiar with this error in McLean's analysis and would have avoided repeating it!

What else can be said about this subject?  Well, it is true that the solubility of CO2 in seawater is a function of temperature, and all else being equal, as the ocean warms it will give off CO2 to the atmosphere.  And in fact this is the mechanism by which a CO2 feedback amplified the temperature swings during the Pleistocene glacial/interglacial cycles.  But in today's world, the greatly increased partial pressure of CO2 from fossil fuel emissions causes a flux of CO2 from the atmosphere to the oceans.  This is known from decades of oceanographic surveys that show the oceans are a "sink" rather than a source of CO2 in the atmosphere (Takahashi 2009, Sabine 2004).

It's also interesting to note that climate scientists have known for at least three decades that short-term fluctuations in temperature (e.g., those associated with the ENSO cycle) are correlated with short-term fluctuations in the rate of increase of atmospheric CO2 (Bacastow and Keeling 1981).  Section 7.3.2.4 of the IPCC AR4 Working Group 1 report discusses this in some detail.

Thanks to commenter Joel Shore at Watts Up With That, who provided a reference to the IPCC AR4 discussion of interannual changes in the CO2 flux and their relationship to the ENSO cycle and other short-term phenomena.

0 0

Printable Version  |  Link to this page

Comments

1  2  Next

Comments 1 to 50 out of 56:

  1. I like where Hocker says 'The two coefficients, (0.22 and 0.58) were chosen to optimize the fit." sounds like a neat trick , Oh dear !! and also how its claimed the computer models only work if the right data is imputed .
    0 0
  2. First off, it is interesting to see that correlation is causation after all. I thought we'd been told it wasn't. This stuff is impressively silly. What jumps right out of the little equation is that for zero temperature anomaly you still have a rise in CO2! It comes out as 0.22 (ppm/month?) which sounds about right (~2ppm/year and rising). So his hypothesis is refuted by his own equation. (BTW, little nitpick: a trend is not removed by differentiation but is turned into a constant offset. That's what we see here).
    0 0
  3. And any similarities to the methods used by McLean, Carter & DeFreitas 2009 in their comparison of El Nino with temperatures is purely coincidence? Derivatives to remove trends and all of that old rot...
    0 0
  4. Glenn Tamblyn writes: And any similarities to the methods used by McLean, Carter & DeFreitas 2009 in their comparison of El Nino with temperatures is purely coincidence? Thus the comment "Perhaps if Hocker were an avid reader of Skeptical Science, he would have been familiar with this error in McLean's analysis and would have avoided repeating it!" :-)
    0 0
  5. How does this theory fit in with the stall in warming in the 60s and 70s? How does it fit with all the proxy data we have for the past 700 000 years? And what would this say about the much higher CO2 levels in the deeper past (Phanerozoic era). It is somewhat 'idiosyncratic' to say the least.
    0 0
  6. This reminds me of argon. It is neither produced nor consumed by either industrial or biological processes, so its mass in hydrosphere and atmosphere combined should be pretty constant. Its atmospheric concentration is said to be 9340 ppmv. However, solubility in water at 0°C is 100 mg/kg, while at 20°C it is 60 mg/kg. In equilibrium conditions there should be 3-4 times more argon dissolved in seawater than in the atmosphere. If average ocean temperature goes up by 0.01°C, argon concentration in air is expected to increase by about 2 ppmv. Therefore it is a rather sensitive global thermometer. Is there anyone out there measuring argon? Any pointer to data?
    0 0
  7. The same "trick" of looking for a correlation between detrended series has already appeared on WUWT at least once, for instance here by Roy Spencer, to make pretty much the same argument. It was wrong then as well. IIRC, the transition between glacial and interglacial periods give a rise in CO2 of about 100 ppm, but that was a 6-10 degree change in global temperatures, as dorlomin suggests (angband player?) one wonders why the carbon cycle is so sensitive now that you get a 100 ppm rise from less than a degree of change in global temperatures. Doubting that the rise in CO2 is anything other than anthropogenic seems to me to be the least supportable skeptic argument by a large margin. The annual rise in atmospheric CO2 is only about half anthropogenic emissions, so the natural environment must be a net sink for the carbon budget to balance. If the oceans are a net source of CO2 the "missing sink" must be way larger than anyone thought! ;o)
    0 0
  8. Nice to see another debunk. I am how ever left wondering what is going on here? Perhaps some one who has studied the climate more than my recent interest can tell me. I'm a commercial scientist (Chemist) and a little light on with climate. My guesses so far are that global increase in temperature might be increasing the rate of CO2 being released by such things as rotting biological matter. Perhaps just the respiration of the land based biomass increased and decreased with heat. The chart is hard to see clearly but it also seems that temperature increase precedes CO2 increase at some of those points so I'm wondering if we are just looking at a positive feedback. It is after all prediced that AGW will cause a positive feedback of more CO2 from such things as arctic tundra, methane hydrates and other carbon sinks. I would have thought that if one was wanting to look for ocean release of CO2 one would looked at pH. Since that is found to be dropping my chemical background would have me doubt Hocker on that ground alone! A release of CO2 from an ocean would, I expect see an increase in pH at that point. As a chemist I'm use to finding multiple causes and in this case I expect that the AGW from CO2 increase from fossil fuels is being added to by a positive feedback from the carbon cycle or carbon sink due to natural variation. Could it be as simple as having reduced the trend to a constant one sees the positive and negative feedback. Perhaps AGW deniers are making a contribution to science by finding ways to quantify positive and possibly negative feedbacks. Interesting that Hocker sees just one effect and claims a cause when there is so much evidence for AGW caused by Fossil fuels.
    0 0
  9. @Paul W take a look at Jones 2001, basically el nino pattern cause a net co2 release from the biosphere particularly over the amazon basin, however the biosphere has been a net absorber over at least the last 2 decades so this is not the cause of long term co2 increase: http://eric.exeter.ac.uk/exeter/bitstream/10036/48597/1/Carbon%20Cycle%20Response%20to%20ENSO.pdf " Climatic changes over land during El Nino events lead to decreased gross primary productivity and increased plant and soil respiration, and hence the terrestrial biosphere becomes a source of CO2 to the atmosphere. Conversely, duringEl Nino events, the ocean becomes a sink of CO 2 because of reduction of equatorial Pacific outgassing a result of decreased upwelling of carbon-rich deep water. During La Nin events the opposite occurs; the land becomes a sink and the ocean a source of CO 2 .
    0 0
  10. I have pulled 1958-2007 atmospheric CO2-curve values (ppmv) derived from flask air samples collected at the South Pole from CDIAC (Carbon Dioxide Information Analysis Center), computed 3 year moving derivative centered at middle year and overlayed the graph on Fig. 2 from Hocker 2010. If anything, it should be noted that temperature actually lags CO2 derivative. Or temporal scale has an offset in the Hocker figure.
    0 0
  11. BP, that's interesting. I would have thought that the CO2 data at South Pole would lag the CO2 data at Mauna Loa and thus your line ought to lag the red line on that graph. But it sure looks like it leads it. Did you use the monthly or annual data? Just curious ....
    0 0
  12. By "first derivative", we mean the slope. Thus, by subtracting the measured CO2 content at 12 month intervals, we're measuring the annual rate of increase of CO2 per year (approximately 1.5 ppm/y). By normalizing this value using the equation, we generate an average anomaly of "0", over the 50 years of data represented. If the rate of change never varied, all the points would plot at "0". It's evident looking at Figure 2, that the majority of points on the right hand side of the graph fall above "0", while the majority of points plot below "0" on the left. This indicates that the annual rate of increase of CO2 is itself increasing, which can also be seen by the slight concave upward shape in Figure 1. (I think the goal is to head in the other direction.) Given the strong correlation between the CO2 anomaly and ocean surface temperature, it seems to me that deviations from this trend are related to temperature of the ocean water. In other word, when sea temperature goes up, CO2 goes up as well. For example, both CO2 and temperature take a slight jump during the warm El Nino year of 1998. Since CO2 solubility decreases with increasing (water) temperature, this would be expected. Thus, it seems to me that these minor deviations are, indeed, driven by temperature. This relationship is also reinforced by temperature changes slightly leading CO2 (as noted by Paul W @#8) If so, the title of Hocker's post would "technically" be correct for describing short-term trends caused by ENSO and other controls, but would be grossly misleading for describing long-term trends. (I don't see why we'd need to appeal to growth rates in the Amazon basin to explain this relationship, but I haven't checked out the magnitudes of the mass balance, so maybe I don't understand it correctly.) In any case, I suspect that many WUWT readers will learn everything they want to know about this topic by reading the title only.
    0 0
  13. CoalGeologist writes: Given the strong correlation between the CO2 anomaly and ocean surface temperature [...] You might be referring to some other place where this correlation has been established ... but just for the sake of extreme clarity, we should note that Hocker actually used lower troposphere temperature over the oceans, rather than actual sea surface temperatures. He wasn't very clear about that, and a lot of people in the thread over at WUWT make that mistake.
    0 0
  14. More from CoalGeologist: This indicates that the annual rate of increase of CO2 is itself increasing, which can also be seen by the slight concave upward shape in Figure 1. (I think the goal is to head in the other direction.) Indeed. The increase is actually faster than an exponential trend.
    0 0
  15. @Coalgeologist Actually the pacific ocean is a net co2 sink during el nino due to reduced upwelling of carbon rich deepwater(and the opposite for la nina), the strong correlation is due to land carbon fluxes; enso and oceanic co2 fluxes are anticorrelated: Jones paper
    0 0
  16. Ned @#13 You are correct that Hocker used troposphere temperatures from satellite data. I should have been more clear. However, tropospheric temperature anomalies are very strongly correlated with SSTs. See: Su and Neelin, Slide #3
    0 0
  17. Humans are emitting ~30bn tons/yr. The amount in the atmosphere is going up about ~15bn tons/yr. The pH of the oceans is falling. It takes truly remarkable mental acrobatics to perform and then believe a bit of mathematical sleight of hand and misinterpretation that in one swoop disproves conservation of particle number and the chemistry of carbon in seawater.
    0 0
  18. Further to my previous post @#12, and in consideration of the comment by MarkR @#17 that the oceans are, in the long run, a net sink for atmospheric CO2. An increase in surface water temperatures will decrease the rate of uptake of atmospheric CO2. If humans keep cranking it out at the same rate, this would be manifested as a net increase in the accumulation rate in the atmosphere, as indicated by a positive anomaly in Fig. 2. This is discussed in the IPCC AR4 WG1 report in the Summary for Policymakers, section on "Projections of Future Climate Change":
        • Warming tends to reduce land and ocean uptake of atmospheric carbon dioxide, increasing the fraction of anthropogenic emissions that remains in the atmosphere. For the A2 scenario, for example, the climate-carbon cycle feedback increases the corresponding global average warming at 2100 by more than 1°C. Assessed upper ranges for temperature projections are larger than in the TAR (see Table SPM.3) mainly because the broader range of models now available suggests stronger climate-carbon cycle feedbacks. {7.3, 10.5}
    0 0
  19. Here's a possible simplification, which might help the WUWT readers who can't follow the ever-so-fancy math (folks here can point out if it's reasonable or too simplistic). Figures here are ballpark. The temperature change during a big el Nino event like 1998 is around 0.2 C. The additional PPM of concentration from such an event is perhaps 1.5-2 ppm. So the 0.8 C of warming would lead to a 6-8 ppm change. But using WUWT's alternate reality, we can also logically conclude there was negligible temperature change between MWP and LIA periods. 0.8 C leads to a change of 100 ppm of CO2, right? So why only about 5 ppm change of CO2 concentration between these periods? http://cdiac.ornl.gov/trends/co2/graphics/lawdome.gif
    0 0
  20. #11 Ned at 03:15 AM on 12 June, 2010 that's interesting Not so interesting, perhaps. Phase relation was messed up. Here is another try, this time against MSU/AMSU Ch. TLT (Lower Troposphere) Brightness Temperature History. No lag. Did you use the monthly or annual data? Annual, last column. ---- What about the global argon thermometer? => #6
    0 0
  21. Unless I'm missing something there's also the matter of carbon isotopes as a means of fingerprinting the source of recently appearing C02, which Hocker does not address. Isotopes as a tracer of anthropogenic C02 are nicely covered in this article at Real Climate.
    0 0
  22. I have read some Russians say this. Inhofe's advised the Russian geographer Andrei Kapitsa reportedly claims: “It is global warming that triggers higher levels of carbon dioxide in the atmosphere, not the other way round.”... http://www.hinduonnet.com/2008/07/10/stories/2008071055521000.htm
    0 0
  23. NewYorkJ, that objection was raised over at WUWT, actually. Several people were upset about the implications for MWP. The response from Hocker's defenders was that the ice core records of CO2 must be unreliable. (Don't blame me, I'm just reporting what they said).
    0 0
  24. BP writes: Not so interesting, perhaps. Phase relation was messed up. Here is another try, this time against MSU/AMSU Ch. TLT (Lower Troposphere) Brightness Temperature History. OK, that looks more like what one would expect. For a moment there I thought you might have discovered some new unknown CO2 source at the South Pole ... but alas, 'tis not to be. What about the global argon thermometer? => #6 I've been looking for that. I can't find anything anywhere. Was it your own idea, or has someone else suggested this? The closest I've come is people using the O2/Ar ratio to study biological processes in seawater (O2 and Ar have similar temperature/solubility functions). But none of the global databases of atmospheric gases seems to have a time series of Ar.
    0 0
  25. "The response from Hocker's defenders was that the ice core records of CO2 must be unreliable." Entirely predictable. "The data is wrong" is kind of a catch-all fallback argument when doctrine is in danger of being shaken. But here's an interesting question I'm throwing out here. Can the amount change in CO2 concentration from temperature feedback be determined precisely? Obviously, almost all of the change is from human activities. Doug's link in #21 indicates the chemical human fingerprint. But perhaps there's a few ppm related to long-term temperature feedbacks as I briefly covered in #19. Can this be determined with reasonable precision, either from observations of the isotope signature, or from short-term temperature-CO2 concentration fluctuations? If so, could that be a reasonable proxy for pre-industrial temperatures? You'd have to account for feedbacks as well.
    0 0
  26. GP2 @15 wrote:
    Actually the pacific ocean is a net co2 sink during el nino due to reduced upwelling of carbon rich deepwater(and the opposite for la nina), the strong correlation is due to land carbon fluxes; enso and oceanic co2 fluxes are anticorrelated:
    Thanks for correcting my simplistic notion of what's occurring. On the other hand, I'm not sure you've got it exactly right either. Assuming (!) I understand correctly, your statement would apply not to the entire Pacific Ocean, but only to the equatorial region, which is generally a zone of upwelling. Colder parts of the ocean remain a CO2 sink at all times, and the ocean as a whole remains a net sink. Actually, the equatorial Pacific region remains a net source of atmospheric CO2 even during El Nino events, although at a substantially reduced rate, owing to the lower pCO2 of the warmer surface waters (See diagram below from Feely et al. (1999), who concluded that the sea to air flux of CO2 from the equatorial oceans is 30-80% lower during El Nino periods.) Jones et al. (2001) begin their paper by noting that atmospheric CO2 is observed to increase during El Nino events, and decrease during La Nina events, and that this relationship has been known since the 1970s. Thus, at minimum, we can conclude that some combination of processes brings about this net result, and as you've noted, it's interpreted (AR4-WG1, Parts 5 & 7) to be dominated by terrestrial processes. I think it's safe to say, however, that we don't have the full picture yet. In any case, while I can barely begin to understand the complexity of the CO2 cycle, it's evident that a simple empirical correlation between tropospheric temperatures and CO2 may be an important observation, but sheds little (direct) light on the underlying climate processes.
    0 0
  27. If Hocker is right the additional CO2 in the atmosphere is coming out of the oceans in which case there should be no detectable change in the atmospheric C12/C14 ratio. If the additional CO2 is coming from burning fossil fuels as the IPCC claims, the amount of C14 in the atmosphere should be falling. My understanding is that this is the case but I can't remember where I read it. Hopefully BP or some other learned gentleman can set me straight.
    0 0
  28. Paul W at 00:18 AM on 12 June, 2010 Nice to see another debunk. Maybe that's over stating it. Even Hocker states "I am not wed to the theory I present" It's fair to say that WUWT also posted a Willis Eschenbach article that firmly states 20th century CO2 rise is caused by burning fossil fuels Some people claim, that there’s a human to blame …
    0 0
  29. gallopingcamel. I'm still searching for the C12/C14 ratio data you're asking for but, in the meantime, another means of detecting the origin of CO2 is via its C13/C12 ratio. According to my reading, terrestrial plants (which form the basis of our fossil fuels) have a lower C13/C12 ratio than what exists in the atmosphere. So if the CO2 were coming from the oceans, then we wouldn't expect a change in the C13/C12 ratio either. According to this previous post by John Cook the C13/C12 ratio has been falling over the last 20-years, which does seem to debunk Hocker's claim that the CO2 is coming from the ocean in response to global warming. Its further debunked, though, by the fact that CO2 levels have been clearly rising since at least 1959 (when Mauna Loa first started measurements) yet temperature measurements show a cooling between the mid-1940's & mid-1950's which, if anything, should have caused a *fall* in CO2 emission (in fact, the delta T was too low to cause any real change-any more than delta T over the last 30-50 years has been greater enough to cause the oceans to release significant amounts of CO2), as well as the fact that-whilst there was no warming trend between 1951 & 1970, there was a highly significant 1ppm rise in CO2 concentrations between 1959-1979. If temperature were truly the cause of the CO2 emissions, then there should have been a rise in temperature *before* the rise in CO2!
    0 0
  30. HumanityRules (#28), Thanks for that WUWT link. However, I think that Willis Eschenbach has got his carbon isotopes confused. C12 and C13 are stable but C14 is not. C14 is created in the atmosphere by incident cosmic rays. Once living creatures die the proportion of C14 in their remains falls as the C14 decays (5,730 year half life). Fossil fuels buried underground are shielded from most cosmic radiation so the C14 is not replaced when it decays. Thus fossil fuels have much less C14 than atmospheric carbon has.
    0 0
  31. Marcus (#29), Ad nauseam, to many of the faithful on this blog I have pointed out that correlation does not imply causality. I have also said that cause should precede effect. Consequently, I am with you when you reject Hocker's hypothesis unless it can be shown that a rise in temperature preceded a rise in CO2 concentration.
    0 0
  32. gallopingcamel, doug_bostrom brings this up and provides a link in the comments above.
    0 0
  33. @Coalgeologist You are right, i should have said that the anomalous fluxes are negative(positive) for el nino(la nina) over the tropical pacific and that this signal dominates the global ocean carbon flux anomalies. However i think that this relationship(correlation between land carbon fluxes/ENSO and anticorrelated oceanic fluxes/ENSO) is not surprising, it is well known that el nino reduces rainfall over tropical land masses, during 2009/2010 el nino for example several countries had severe droughts and drastically reduced hydropower generation so there's no surprise that el nino decrease gross primary productivity and increase plant and soil respiration thus leading to higher atmospheric concentration after some months.
    0 0
  34. Well I'm glad isotopes were brought up. When I read the article I was wondering why this wasn't mentioned. I thought however that C12 was preferred by vegetation in the photosynthesis process and hence why fossil fuels have higher levels of C12? In which case couldn't the seas release CO2 with more C12 as well? Wouldn't this confuse the C13/C12 ratio issue, so that it would be difficult to distinguish fossil fuel CO2 from general vegetation CO2? Feel free to correct me!
    0 0
  35. Wouldn't this confuse the C13/C12 ratio issue, so that it would be difficult to distinguish fossil fuel CO2 from general vegetation CO2? That's where C14 comes in. C14 is radioactive, with a half-life of around 5800 years (approx figure, too lazy to look up the exact number). Fossil-fuel carbon is depleted in C14, while carbon in vegetation isn't. So fossil-fuel carbon is depleted in both C13 and C14, which makes it easy to distinguish from other sources (including vegetation).
    0 0
  36. I think the point, The Ville, is that CO2 released from non-vegetation sources (such as the CO2 stored in oceans) will release CO2 in virtually equal levels of C-12 & C-13. Whereas the CO2 from burning fossil fuels will have a signficantly higher level of C-12 rather than C-13. Not surprisingly, there is strong evidence that, until the mid-20th century, levels of C-12 & C-13 versions of CO2 have remained about equal, but over the last 60 years, the levels of 12-CO2 have risen sharply, whilst levels of 13-CO2 have remained largely unchanged. The only difference is the significant increase in burning of fossil fuels. Either way, though, it definitely shows that the ocean can't be the source of the CO2.
    0 0
  37. Yes but Marcus, is not the CO2 stored in the ocean a mixture of vegetation and non-vegetation sources? That's what is bugging me a bit about the C13/C12 issue.
    0 0
  38. Re caerbannog. Yeah, just looked at the New Scientist myth busting page and fossil fuels are distinguished from veg by the lack of C14. Thanks for that snippet. You would expect a rise in C14 if vegetation was responsible. The reason C14 isn't a reliable indicator now is due to nuclear weapons tests in the 50s/60s. http://www.newscientist.com/article/dn11638-climate-myths-human-co2-emissions-are-too-tiny-to-matter.html
    0 0
  39. You would expect a rise in C14 if vegetation was responsible. The reason C14 isn't a reliable indicator now is due to nuclear weapons tests in the 50s/60s. As a method for distinguishing fossil-fuel carbon from carbon taken up by living (or recently living) vegetation, the C14 method is still useful. It is true that atmospheric nuclear tests added C14 to the atmosphere -- but that means the amount of C14 present in living vegetation has been boosted, making it even easier to differentiate living sources of carbon from (completely C14-depleted) fossil sources. The boosted C14 background level, if anything, might make it *easier* to detect the introduction of C14-depleted carbon. Furthermore, the impact of nuclear testing on atmospheric C14 concentrations has been well-studied, allowing scientists to make the necessary calibrations/adjustments for C14 dating. But in the case of fossil fuels vs living vegetation, we don't need to do any fine-grained dating calculations, because we know that fossil-fuel carbon is completely C14 depleted (no need for hair-splitting calculations re: C14 concentrations). That is, either the material has C14 or it doesn't. Furthermore, the last atmospheric nuclear test was conducted over 35 years ago, so there haven't been any really recent nuclear perturbations of atmospheric C14 concentrations.
    0 0
  40. caerbannog (#39), As you point out there was a huge spike in C14 in the 1960s which swamps any changes due to increased burning of fossil fuels. I guess that idea won't fly. doug_bostrom (#21), That article you linked is the one I must have read earlier. I forgot that it concerned C13/C12 ratio. As that article is six years old I tried to find something more recent: http://wattsupwiththat.com/2008/01/28/spencer-pt2-more-co2-peculiarities-the-c13c12-isotope-ratio/ Now I am really confused.
    0 0
  41. gallopingcamel #40, there are 3 different articles on RC, including that one, that explain how we know that the increase in CO2 is due to fossil fuel burning. Isotope ratios are just part of it. From direct measurements, the amount of CO2 in the oceans is increasing.
    0 0
  42. Gallopingcamel, give it up, for the following reasons: 1) We know how much carbon has been burned by human activity over the past few decades, and if all the carbon-dioxide produced had remained in the atmosphere, atmospheric CO2 levels would be much higher than they are now. So we *know* that the external environment (oceans, soils, etc) have acted as a net carbon *sink*, not a source. This is straightforward middle-school arithmetic. 2) The falling pH of the oceans indicates that the oceans have been *absorbing*, not releasing, CO2. This is straightforward freshman chemistry. Consult almost any freshman college chemistry textbook for more details about this. 3) Atmospheric O2 concentrations have been falling (not enough to cause any problems, but enough to measure), and they have fallen in a manner completely consistent with the amount of fossil-fuels burned by humans. 4) C14/C12 ratios up to 1950 (beginning of atmospheric testing) track human fossil-fuel use up to that date very nicely. Even with C14 contamination due to nuclear testing, the C14/C12 ratio over time gives us plenty of evidence that humans have put lots of fossil-fuel carbon into the atmosphere. After atmospheric nuclear testing ceased, the C14/C12 ratio began declining from the "nuclear testing spike" in a manner consistent with fossil-fuel combustion. We have plenty of C14/C12 data preceding and following atmospheric nuclear testing to show that humans were dumping lots of fossil-fuel carbon into the atmosphere. So like I said, gallopingcamel, just give it up. Or better yet, sign up for an introductory Earth-science course at your local community college instead of wasting your time (and your brain cells) on Anthony Watts idiocy.
    0 0
  43. I'm thinking that it might be useful to grade 'fingerprints' into primary and secondary (or more) classes? So that a secondary fingerprint is dependent on a primary fingerprint for its validity? eg. on it's own a secondary fingerprint may not indicate a specific scenario, but in a broader sense does in this case indicate increasing CO2 emissions from a source.
    0 0
  44. The Ville. In answer to your above question. Its true that a decline in the C13/C12 ratio could be attributed to either vegetation or fossil fuel use-but that's not what is being claimed here. The claim is that warming has caused the oceans to liberate the CO2 stored as HCO3 (even though the CO2 *precedes* the warming by a good couple of decades!) CO2 liberated from a purely inorganic source like this should not impact the long-term ratio of C13/C12, yet Mauno Loa data shows that the C13/C12 ratio is definitely declining-so ocean sinks *cannot* be the source! Its also unlikely to see how modern vegetation can be the source, as plants are a net CO2 sink-even in warmer climates. Its only in periods of extended droughts when trees become a net releaser of CO2. Even then all available evidence suggests that, even under these conditions, the trees don't release enough CO2 to account for such a significant rise in CO2 (to levels unseen since before the Quaternary Era!)
    0 0
  45. #24 Ned at 08:19 AM on 12 June, 2010 I've been looking for that [i.e. argon]. I can't find anything anywhere. Was it your own idea, or has someone else suggested this? It was my idea. It happens sometimes. However, it might not be as bright as I thought, for a two order of magnitude error has slipped into my back-of-the-envelope calculation somehow. With a closer look it turns out mass of argon dissolved in water is only about 2.4% of all the argon in atmosphere+hydrosphere. Therefore the global argon thermometer is not terribly sensitive to changes of ocean temperature. However, if measured with high enough precision, can still lend information on OHC.
    0 0
  46. caerbannog (#39), It seems that we have a "failure to communicate". My fault probably. I did not buy the Hocker hypothesis for a minute and if you read what is posted on WUWT you will see that Anthony Watts does not buy it either. I got the idea that carbon isotope ratios would provide an unequivocal debunk of Hocker. Thank you for doing such a good job on that using quite different arguments.
    0 0
  47. caerbannog, At the risk of compromising the serious tone of this fine blog, can I assume that you are a fan of Monty Python? Cymru am bith.
    0 0
  48. 1. I disagree with Hocker (and agree with Paul W) - only the solubility of CO2 in the waters of the oceans - it's too simple. The increase of CO2 in the atmosphere is far more closely related to temperature over the lands than the temperature of the oceans. Compare the size of annual increments of CO2 in the atmosphere from land and ocean temperatures. For example: http://www.nature.com/nature/journal/v451/n7176/images/nature06591-f1.2.jpg (CO2 annual - ENSO); with http://global-warming.accuweather.com/julyall-thumb.gif (temperatures in July - the oceans and land). Here we see indeed a significant correlation with El Nino, but ... after each major volcanic explosion (1963, 1982, 1991) is a sharp drop in the number accumulated in the atmosphere of CO2. Moreover, as the temperature drops and the (parallel) accumulation of CO2. Cooling of the ocean? In the years 1982-4 ocean SST (July) - as opposed to the land - almost did not fall. Responded only to strong cooling of the land. The largest difference concerned the year 1984 / 5. Conclusion: The land temperatures are much better (than the oceans) correlated with the increase of CO2 in the atmosphere. 2. "This conclusion would be rather startling if it were true, since the scientific CONSENSUS is that CO2 is currently acting as a "forcing" that warms the climate." Terrestrial ecosystem carbon dynamics and climate feedbacks, Heimann & Reichstein, Nature, 2008: - "There is ample empirical evidence that the terrestrial component of the carbon cycle is responding to climate variations and trends on a global scale. This is exemplified by the strong interannual variations in the globally averaged growth rate of atmospheric CO2, which is tightly correlated with El Niño–Southern Oscillation climate variations. Many lines of evidence show that the variations in the CO2 growth rate are mainly caused by terrestrial effects, in particular the impacts of heat and drought on the vegetation of western Amazonia and southeastern Asia, leading to ecosystem carbon losses through decreased vegetation productivity and/or increased respiration. These interannual variations reflect short-term responses of the carbon cycle to climate perturbations, however, and cannot be expected to hold over longer timescales." However, ... The temperature dependence of organic-matter decomposition—still a topic of debate - Miko Uwe, Franz Kirschbaum, 2006: "Despite the continuation of much further experimental work and repeated publication of summary articles, there is STILL NO SCIENTIFIC CONSENSUS [!!!] on the temperature dependence of ORGANIC MATTER DECOMPOSITION. It is likely that this lack of consensus is largely due to different studies referring to different experimental conditions where confounding factors play a greater or lesser role." In my opinion: ENSO significantly only through its impact on the system: heterotrophic bacteria breathable - phytoplankton; influence of CO2. Conclusion: (Reference No. 7 of the official - rather skeptic - position of the Polish scientists: Attitude of the Committee of Geological Sciences of the Polish Academy of Sciences to the question of impending of global warming): "Warming of the oceans reduces their capacity to absorb carbon dioxide whereas a smaller area occupied by permafrost INTENSIFIES DECOMPOSITION OF ORGANIC MATTER IN SOIL and therefore, stimulates increased emission of greenhouse gases." I remember: Temperature-associated increases in the global soil respiration record. Bond-Lamberty B, Thomson A, Nature. 2010: "The scientists also calculated the total amount of carbon dioxide flowing from soils, which is about 10-15 percent higher than previous measurements [...]."
    0 0
  49. Arkadiusz, thanks for the long comment. However, everything you discuss under your point (2) above is about carbon cycle climate feedbacks (involving the biosphere, soils, etc). The sentence that you quote ("This conclusion would be rather startling ...") refers to anthropogenic CO2 added directly to the atmosphere acting as a climate forcing not a feedback. It's important not to confuse these two quite different processes.
    0 0
  50. "It's important not to confuse these two quite different processes." Consent ..., - but the problem of CO2 sources, strongly associated with real RF CO2 - and it is difficult to speak of even a partial consensus - that is unacceptable. - "Volcano" in 1992 / 3, shows us that this "first" RF process - caused by anthropogenic CO2 excess - may be very insignificant, as in 1992 / 3, a small amount of added CO2 to the atmosphere (circa 0, 5 -1 ppmv), and the second process - a continuous rise in temperature of land in the last decades of the twentieth century - by affecting the breathing of the biosphere - can be decisive. Simply put: 0.5-1 ppm may not result in average growth average of 2.5 ppm. They must be natural causes. My "long comment" is to show that: - Natural warming came first and is responsible for most of the increase of CO2 and start a positive feedback of "living" CO2 in the atmosphere, - Next to the ocean have a much more powerful natural sources of CO2 - which react (warming) more strongly than the ocean.
    0 0

1  2  Next

You need to be logged in to post a comment. Login via the left margin or if you're new, register here.


The Consensus Project Website

THE ESCALATOR

(free to republish)


© Copyright 2024 John Cook
Home | Translations | About Us | Privacy | Contact Us