Climate Science Glossary

Term Lookup

Enter a term in the search box to find its definition.

Settings

Use the controls in the far right panel to increase or decrease the number of terms automatically displayed (or to completely turn that feature off).

Term Lookup

Settings


All IPCC definitions taken from Climate Change 2007: The Physical Science Basis. Working Group I Contribution to the Fourth Assessment Report of the Intergovernmental Panel on Climate Change, Annex I, Glossary, pp. 941-954. Cambridge University Press.

Home Arguments Software Resources Comments The Consensus Project Translations About Support

Bluesky Facebook LinkedIn Mastodon MeWe

Twitter YouTube RSS Posts RSS Comments Email Subscribe


Climate's changed before
It's the sun
It's not bad
There is no consensus
It's cooling
Models are unreliable
Temp record is unreliable
Animals and plants can adapt
It hasn't warmed since 1998
Antarctica is gaining ice
View All Arguments...


Username
Password
New? Register here
Forgot your password?

Latest Posts

Archives

Is the long-term trend in CO2 caused by warming of the oceans?

Posted on 11 June 2010 by Ned

A new article by Lon Hocker at the website "Watts Up With That?" examines the relationship between global temperature and CO2 over the last three decades.  The article's conclusion is concisely summarised in its title:  The temperature rise has caused the CO2 increase, not the other way around. This conclusion would be rather startling if it were true, since the scientific consensus is that CO2 is currently acting as a "forcing" that warms the climate.  How does Hocker reach this conclusion, and is it reasonable?

The data used in Hocker's analysis are monthly atmospheric CO2 measurements at Mauna Loa (obtained from NOAA) and satellite-measured temperature data for the lower troposphere (from UAH, apparently using a subset of the global data over the oceans only).  The temperature data are recorded as anomalies, or differences between the actual temperature and the long-term mean. 

The Mauna Loa CO2 data show a long-term increase in atmospheric CO2 concentration.  The Mauna Loa data are the longest high-quality CO2 record, dating back to 1958.  While one might think that the side of a volcano might not be the best place to measure CO2, in fact the procedures used at Mauna Loa compensate for any contamination by volcanic gases.  As shown in Figure 1, since 1980 we have had global CO2 data from a network of stations, and these data show that the Mauna Loa trend is very representative of the global trend in CO2.
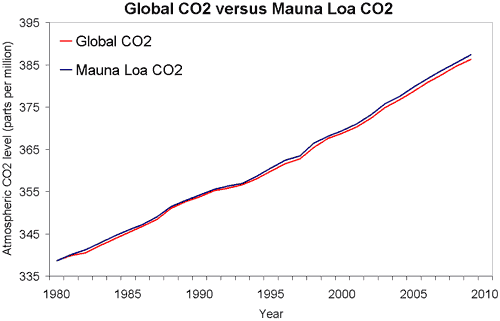
 

 Figure 1: Global atmospheric CO2 (NOAA) versus Mauna Loa CO2 (NOAA).

Hocker begins his analysis by calculating the first derivative of the CO2 data.  He does this using the difference between the CO2 measurement six months after a given month and the measurement six months before.  (Calculating this difference over a 12-month interval effectively removes the seasonal variation in atmospheric CO2 concentration.)

At this point, alert readers may begin to glimpse the flaw in Hocker's methods.  However, let's follow Hocker through to his conclusion. 

He derives a simple model to estimate the temperature anomaly as a function of the derivative of CO2 concentration:

 Temperature Anomaly = (CO2[n+6] – CO2[n-6])/(12*0.22) – 0.58

 Hocker's Figure 2 shows a comparison of the observed and modeled global ocean temperature anomaly:
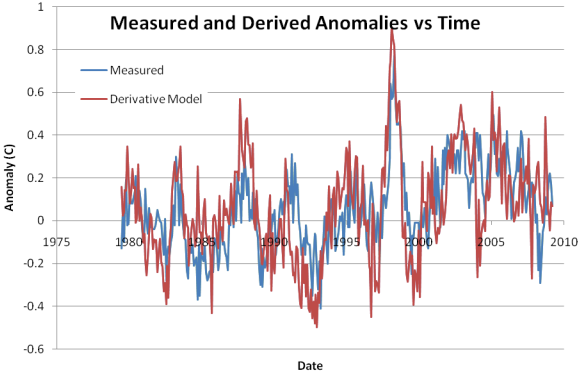

Figure 2.  Comparison of global lower troposphere temperature anomaly over the oceans (blue line) to a model based on the first derivative of atmospheric CO2 concentration at Mauna Loa (red line).  From Hocker 2010.

Looking at this figure, Hocker notes "There is a strong correlation between the measured anomaly and the Derivative model.  It shows the strong El Niño of 1997-1998 very clearly, and also shows the other El Niño events during the plotted time period about as well as the satellite data does."  He does not quantify the correlation between the two, but the squared correlation coefficient (r2) for the two time series is 0.36.

Let's pause here to consider the actual effect of Hocker's methods to this point.  Taking the first derivative of the CO2 data removes the long-term trend in CO2 concentration, and shows the effect of short-term variability around that trend.  Thus, it would be appropriate to conclude from this that short-term fluctuations in the overall upward CO2 trend are moderately well correlated with temperatures in the lower troposphere over oceans.

What Hocker actually concludes is quite different:  "Using two well accepted data sets, a simple model can be used to show that the rise in CO2 is a result of the temperature anomaly, not the other way around.  This is the exact opposite of the IPCC model that claims that rising CO2 causes the temperature anomaly." 

In other words, Hocker is claiming that his model shows that the long-term upward trend in CO2 is explained by temperature, when his methods actually removed the long-term trend.

This is where the previously-mentioned alert readers will be nodding their heads and saying "Yes!  We knew it!"  The error that Hocker makes - taking the derivative of a time series to remove its long-term trend, then correlating a second data set with this derivative, and finally claiming the second data set explains the long-term trend - is exactly the same error that was recently discovered in a prominent "skeptical" paper by McLean 2009.  McLean correlated an index of the El Niño/Southern Oscillation with the first derivative of temperature, while Hocker correlates temperature with the first derivative of CO2 concentration.  Perhaps if Hocker were an avid reader of Skeptical Science, he would have been familiar with this error in McLean's analysis and would have avoided repeating it!

What else can be said about this subject?  Well, it is true that the solubility of CO2 in seawater is a function of temperature, and all else being equal, as the ocean warms it will give off CO2 to the atmosphere.  And in fact this is the mechanism by which a CO2 feedback amplified the temperature swings during the Pleistocene glacial/interglacial cycles.  But in today's world, the greatly increased partial pressure of CO2 from fossil fuel emissions causes a flux of CO2 from the atmosphere to the oceans.  This is known from decades of oceanographic surveys that show the oceans are a "sink" rather than a source of CO2 in the atmosphere (Takahashi 2009, Sabine 2004).

It's also interesting to note that climate scientists have known for at least three decades that short-term fluctuations in temperature (e.g., those associated with the ENSO cycle) are correlated with short-term fluctuations in the rate of increase of atmospheric CO2 (Bacastow and Keeling 1981).  Section 7.3.2.4 of the IPCC AR4 Working Group 1 report discusses this in some detail.

Thanks to commenter Joel Shore at Watts Up With That, who provided a reference to the IPCC AR4 discussion of interannual changes in the CO2 flux and their relationship to the ENSO cycle and other short-term phenomena.

0 0

Printable Version  |  Link to this page

Comments

Prev  1  2  3  

Comments 101 to 107 out of 107:

  1. Lon: No it wouldn't rise forever, it would asymptotically head for a saturation value. According to your model, it would. It doesn't matter what other speculation you included in your post. Any conclusions you draw that do not come directly from your model are completely irrelevant. Your model is what it is. If you are going to claim that your model has physical relevance, then you need to explain the specific conclusions of that model. Perhaps you can explain the relevance of an anomaly of -.58, and why your model shows no CO2 change for temperatures stabilizing at that point, yet shows a constant change for all other temperatures. Why does the ocean cease to absorb or release CO2 at that precise temperature? Your last comment also highlights a key issue with your original post: your conclusions and discussion of physicality do not logically follow from what your math shows. What it is is blind speculation with a dash of numerology. You've shown you are capable of performing the math, but not in interpreting the meaning behind what you have calculated. I suggest you swallow your pride and take some time to understand what Ned and others are trying to tell you.
    0 0
  2. Ned: I guess you didn't read it either: "The second free parameter used to match the CO2 concentration and temperature anomaly, 0.22 ppm per month per degree C of temperature anomaly, has a clear physical basis. A warmer ocean can hold less CO2, so increasing temperatures will release CO2 from the ocean to the atmosphere. This releases about 1440 billion tons of CO2 to the atmosphere. This release would roughly triple the CO2 concentration in the atmosphere. We have seen what appears to be about a 0.8 degree temperature rise of the atmosphere in the last century and a half, but nowhere near the factor of three temperature rise (should have been CO2 rise). There is a delay due to the rate of heat transfer to the ocean and the mixing of the ocean. This has been studied in detail by NOAA, http://www.oco.noaa.gov/index.jsp?show_page=page_roc.jsp&nav=universal, and they estimate that it would take 230 years for an atmospheric temperature change to cause a 63% temperature change if the ocean were rapidly mixed." Sorry, maybe you got tripped up by the typo. That was caught in one of the comments.
    0 0
  3. Lon, I have no idea why you are quoting that passage. If you think it's a response to something from my comment, you'll need to be more explicit about what part of the comment it's a reply to. I would appreciate a straightforward response from you on the following points. Do you now accept that: (1) Almost all the explanatory power of your model is contributed by a constant representing the mean monthly linear increase in CO2 independent of variation in temperature. Temperature contributes very little to your model, and can be dropped or replaced by other variables with almost no change in the results. This is clear from the structure of the model itself, and was also shown visually here and here. (2) As a result of (1), the statement that "[this] simple model can be used to show that the rise in CO2 is a result of the temperature anomaly" is an incorrect interpretation of your model. This was the central claim of your post at WUWT, and it's quite clearly wrong. If you agree that it is wrong, just say so (it would be nice to update or retract the post over at WUWT too). If you do not agree, you have a Herculean job of explaining to do. But in either case, please stop avoiding the issue and just address it!
    0 0
  4. Fun with illogical formulae; Month(n) CO2 = Month(n-1) CO2 + 0.22*(Month(n) Anomaly + 0.58) Ergo, if the temperature Anomaly were fixed at -0.58, atmospheric CO2 would remain unchanged. Month(n) CO2 = Month(n-1) CO2 + 0.22*(-0.58 + 0.58) Month(n) CO2 = Month(n-1) CO2 Note that this is anomaly, rather than actual temperature. So, as the temperature climbs during Summer the atmospheric CO2 level would remain constant so long as the temperature was always 0.58 below the baseline used in the satellite temperature record. Thus, per the formula, rising temperatures do NOT cause atmospheric CO2 to increase... only rising temperature ANOMALIES do that. Somehow, incredibly, the flux of atmospheric CO2 is PERFECTLY correlated to the variation from average monthly temperature over an arbitrarily determined period. If a point 0.58 below that satellite record baseline is followed then atmospheric CO2 never changes... meaning that the satellite temperature baseline is somehow directly tied to atmospheric CO2. Thank goodness UAH picked the years they did to compute the baseline. Had they used a different time period we'd never have uncovered this magical correlation.
    0 0
  5. Lon, You can make guesses all day long as to what the parameters in your model represent, but it does nothing to change the conclusions that you can logically draw from your model in and of itself. You've made some very dramatic conclusions in your WUWT post, and suggested that these conclusions can be drawn directly from the results of your model. Now, without inserting information that is not directly included in your model or it's results, please explain why this is the case.
    0 0
  6. Ned: You are right. Lots of things have linear increases, however, most of them don't fit the details of the data when satellite temperatures became available. The derivative plot has the advantage of exposing the details. Clearly temperature has an influence on the rate of increase of CO2. Why do you conclude that it is only important over a short time period? What is the limiting time scale and why is it limited? CBDunkerson: The 0.58C makes the anomaly an absolute reference to temperatures around 1850. If the temperature drops below the "magical" 0.58, CO2 would have a negative slope. I hope that helps, because I'm afraid I really can't figure out your logic. e: Obviously I didn't explain it well enough, though many others were able to follow the logic anyway. Time for me to write something up with greater detail, so that it will be easier for everyone to follow. Keep an eye on WUWT. Thanks for your input.
    0 0
  7. Lon, >Clearly temperature has an influence on the rate of increase of CO2. You're just not getting it: this conclusion is accurate, but it is the only conclusion you can draw from the math you performed. Any conclusion that does not directly follow from this is irrelevant to your calculations. A correlation with rate CANNOT be interchanged with a correlation of level. I don't follow your logic because it is invalid. Unless you retract your illogical conclusions, no amount of blog posts can change that. Do you seriously not understand the difference between these two statements?: 1) A is correlated with the velocity of B 2) A is correlated with the position of B Your math supports statement 1, but the idea that temperature changes are the root cause of CO2 rise can only follow from statement 2. In order to demonstrate statement 2, you need to show a correlation between temperature and CO2 level directly, as soon as you switch to a derivative you are changing your conclusions to statement 1. You cannot then just move terms around in your equation, toss in some vague speculation, and suddenly claim to have established statement 2. Here is a brief summary of the IPCC position, what part of this do you think your analysis disproves?: CO2 accumulating in our atmosphere over the past century comes primarily from humans burning fossil fuels - evidence for this includes the tight correlation between the amount of anthropogenic CO2 released and the level of CO2 in the atmosphere. The rate at which this CO2 accumulates in the atmosphere is influenced by temperature - evidence for this includes the tight correlation between global temperatures and the rate of CO2 accumulation in the atmosphere (this is the piece of the puzzle your analysis supports).
    0 0
  8. To clarify my post above, Your conclusion that temperature has an influence on the rate of CO2 accumulation is valid, i.e. it follows logically from your math. Your conclusion that the root cause of CO2 accumulation is due to temperature changes is invalid, i.e. it does not logically follow from your math. Did you read my post using a skydiver as an analogy? Do you understand how something can correlate with rate but not be the root cause of change in position?
    0 0
  9. e: If I know my starting point, and all accelerations (derivative of position) thereafter, I can determine my position in the future uniquely. This is the calculus I was referring to in earlier posts. If you don't understand that, we have no common ground. Your post 108 seems to negate 107. Maybe we're part way there. You seem to agree that a temperature change causes a change in the rate of change of CO2. Temperature change relative to what? I say 1850 or thereabouts. You say??? Thanks for your interest in the WUWT post.
    0 0
  10. Lon >You seem to agree that a temperature change causes a change in the rate of change of CO2. Yes, it changes the rate of change of CO2, nobody here has disputed that, you misunderstood if you thought so. However, the question of where that rate comes from to begin with cannot be answered by the correlation you found. That can only be evidenced by a direct correlation to level, no derivatives. > If I know my starting point, and all accelerations (derivative of position) thereafter, I can determine my position in the future uniquely. Ah yes, but the key here is "if you know your starting point". This is a great illustration of the problem with your conclusions re: causation. If temperature was directly causative of CO2 accumulation, you would not need to know your starting point, and you would not need to feed the results of a previous step of the model into the next (the CO2 Month(n-1) term). If such a causation existed, then you would have a direct correlation between CO2 level and temperature, and therefore you would be able to come up with an equation that directly estimates CO2 level based on temperature alone, no "starting point" necessary. It would look something like this: CO2_level_month(n) = a*(anomaly_month(n) + b) Without a strong direct correlation between temperature and CO2 level, you cannot do this. In contrast, global CO2 level and human CO2 emissions do show this correlation. In other words, based on nothing but anthropogenic CO2 emission totals, we can directly estimate the global CO2 level - no "starting point" necessary, no need to feed the results of previous steps to the following. Your model is not capable of doing this because it is not derived from the correlation that is necessary to provide evidence of direct causation. It is derived rather from a correlation to rate, not a direct correlation to level. Are you really trying to say that those two things are the same? Again, did you read my post with the skydiver analogy? It's meant as an example of how a correlation to rate cannot be used to assume a correlation to position. A skydivers surface area is tightly correlated to his terminal velocity, but should that lead you to conclude that surface area is what causes him to fall? This silly conclusion follows directly from the same logic you are trying to apply to CO2 and temperatures (in fact, you could construct a model in this scenario that calculates the skydivers position based only on his previous position and his current surface area). >Your post 108 seems to negate 107. No, post 108 clarified my point. Your conclusion about correlation of rate is fine, in 107 I am specifically critizing your conclusion about causation. To summarize: your raw calculations seem fine, your statements about correlation of rate are fine, but your conclusions about causation do not follow logically from your math. This is what everyone here has been trying to explain to you.
    0 0
  11. e: Sorry, but you clearly don't understand my post despite my best efforts. I give up, and am content to leave you with your misconceptions. Thank you for your interest.
    0 0
  12. Pride is expensive.
    0 0
  13. Lon #106: "I hope that helps, because I'm afraid I really can't figure out your logic." Let me simplify. Let's say the average global temperature in the UAH satellite record for January is 12 C and for July it is 14.3 C. I haven't checked to see what the actual figures they came up with are, but those are likely in the ballpark and the specifics don't matter for this explanation. A January temp of 11.42 C and a July temp of 13.72 C would then both have anomaly values of -0.58. Thus, even though the TEMPERATURE had increased 2.30 C from January to July the ANOMALY would be unchanged... and per your formula there would therefor be no change in CO2 levels. The temperature increasing 2.30 C has absolutely no impact. Only change in the ANOMALY impacts CO2 levels. Which is, of course, ridiculous... because the anomaly values are completely arbitrary. If they took a different set of years to compute the baseline average temperatures for each month you'd get different anomalies... but somehow this particular arbitrary set of anomalies is perfectly correlated to atmospheric CO2 fluxes? The formula is inherently illogical.
    0 0
  14. Lon I understand your post just fine, in summary: a) Rate of CO2 accumulation correlates to temperature anomaly. (I don't dispute this) b) Temperature anomaly correlates with el ninos. (no dispute here either) c) Transitively, rate of CO2 accumulation correlates with el ninos. (still no dispute here) d) El Ninos are not caused by CO2. (again no dispute here) e) You conclude from the above that the effects of temperature change are the direct source of CO2 in the atmosphere. It is the final step where you have made an illogical leap. The proposition in e) simply does not follow logically from the statements above it. You cannot conclude from a correlation to rate that there exists a direct causation. Only a correlation to level can suggest that. Statements b-c are direct transitive extensions of statement a, they do not magically turn your correlation of rate to a correlation of level. The model you provided is just a quantitative restatement of your correlation to rate, it too does not magically transform your data into a correlation of level (and it also makes some ridiculous predictions). Honestly I don't have much hope left that you will understand any of this, but I can't help feeling like there exists some combination of words that will make this clear to you.
    0 0
  15. As a side note Lon, from your post: ...it seems unavoidable that the causality is opposite from that which has been offered by the IPCC. The temperature increase is causing the change in the increase of CO2. As others have pointed out, including John in his original post, this statement is factually incorrect. The IPCC in fact does conclude that temperature changes cause changes in the rate of CO2 accumulation (they even reference El Niños/La Niñas specifically), the topic is discussed in the IPCC AR4 Working Group 1 report, section 7.3.2.4.1. If nothing else, can you at least address this simple factual error?
    0 0
  16. e: The satellite measured anomaly is not the same as El Niños/La Niñas. CBDunkerson: Thank you for your strangely illogical comment. I found it amusing. As with e, I see little hope in helping you. Doug: Stop picking on e and CBDunkerson!
    0 0
  17. Lifted from Michael Tobis' blog: "The system of scholastic disputations encouraged in the Universities of the middle ages had unfortunately trained men to habits of indefinite argumentation, and they often preferred absurd and extravagant propositions, because greater still was required to maintain them; the end and object of such intellectual combats being victory and not truth. "No theory could be too farfetched or fantastical not to attract some followers, provided it fell in with popular notions..." --Charles Lyell in "Principles of Geology" (1830) Except, Lon, we're not in the Middle Ages. Most of us, anyway. For that matter you're not even arguing.
    0 0
  18. Lon Hocker #116: "CBDunkerson: Thank you for your strangely illogical comment. I found it amusing. As with e, I see little hope in helping you. Doug: Stop picking on e and CBDunkerson!" Ah. Trolling. Ok, you've officially passed the point of being worth bothering with.
    0 0
  19. Lon Hocker at 17:37 PM on 24 June, 2010 Thank you for commenting here, and the effort at reasoned discussion. I’m late to this conversation, and just posted these images on another thread on “acidification”. They are pertinent to this one also, so I hope all will forgive the repetition. This image is from here which shows gridded annual average air/sea carbon flux. By measurement and best estimates the ocean is a net CO2 sink and is changing pH most rapidly in areas of highest uptake. If we accept what NOAA and other Oceanographic Institutes etc are telling us, then your premise is suspect without invoking any maths. How can you account for a trend of more measured CO2 in the ocean over time (and with overall warming in the same period), rather than less? The ocean is absorbing a large proportion of the extra emitted anthropogenic CO2, which also explains the difference between increasing measured atmospheric concentration and estimated anthropogenic output, ie the extra emissions not residing in the atmosphere are going somewhere (split between Ocean and other sinks such as increased vegetative biomass in NH). These strands of evidence are consistent. From R. Feely, Pacific Marine Environmental Laboratory, NOAA, with atmospheric data from Pieter Tans and seawater data from David Karl. Adapted from Feely (2008) in Levinson and Lawrimore (eds), Bull. Am. Meteorol. Soc, 89(7): S58. Enough instrumental evidence has now accumulated so that this trend in overall pCO2 increase and reduction in alkalinity is now accepted as measured fact rather than possible emerging trend, model or theory. As such, your proposed mechanism needs revision. However the correlation between temperature and CO2 derivatives is interesting, and would go some way to explain the variations superimposed on the rising trend. To counter this however, I would suggest you check Southern Hemisphere CO2 seasonal variations (relatively much more Ocean), which are considerably less than NH variations (relatively more land). Just a thought.
    0 0
  20. Peter: Thank you for the excellent comment. I agree with pretty much everything you wrote. The carbon ratios support the emission of CO2 from the equator and absorption near the poles with a half time of about 5 years, regardless of model, as long as you accept the 100GtC flow. No question that there is a net flow of CO2 into the ocean from anthropological sources. The higher atmospheric CO2 due to anthropogenic sources reduces the amount that would have been emitted by the ocean for the same temperature increase (and decreases the uptake), and that would have been a clearer description than my stating that it came from the oceans. With a 5-year tome constant, the anthropogenic contributions to the CO2 increase would be about 25% of the observed increase, leaving the rest for the temperature change. I realize that this is an emotional subject for all, and I likely would have been more politic to not have written such a aggressive headline! In any event the science is far from settled, and I wanted to present a contrasting argument to that usually accepted. I greatly value postings, such as yours, that provide information and opinion dispassionately . I know that my understanding of this is far from complete, and I am open to changing my mind on pretty much everything, except for the Mauna Loa and satellite data, and my understanding of math and calculus! Again, thank you, and I would enjoy hearing more of your perspectives.
    0 0
  21. Oops, should have been "increases the uptake" instead of "reduces the uptake"
    0 0
  22. Lon Hocker writes: With a 5-year tome constant, the anthropogenic contributions to the CO2 increase would be about 25% of the observed increase, leaving the rest for the temperature change. This is still just plain nonsense. The anthropogenic contribution is larger than the observed CO2 increase, meaning it accounts for more than 100% of the increase, not "25%". The excess is taken up by the oceans and biosphere. I realize that this is an emotional subject for all, and I likely would have been more politic to not have written such a aggressive headline! In any event the science is far from settled, and I wanted to present a contrasting argument to that usually accepted. It's not a problem of "emotions", "politics", or your headline. You did not understand the meaning of the statistical methods used in your post, and drew completely erroneous conclusions. Some aspects of science are not "settled" but one thing that definitely is settled is the anthropogenic origin of the observed atmospheric increase in CO2, and the fact that the ocean is currently acting as a sink for (part of) that increase. This is not a speculative or uncertain point; the evidence is overwhelming.
    0 0

Prev  1  2  3  

You need to be logged in to post a comment. Login via the left margin or if you're new, register here.


The Consensus Project Website

THE ESCALATOR

(free to republish)


© Copyright 2024 John Cook
Home | Translations | About Us | Privacy | Contact Us