


 Arguments


10 key climate indicators all point to the same finding: global warming is unmistakable
Posted on 29 July 2010 by John Cook
A common theme expressed at Skeptical Science is that to understand climate, you need to look at the full body of evidence. To help people assess the evidence, NOAA have just published State of the Climate 2009. The report defines 10 measurable planet-wide features used to gauge global temperature changes. All of these indicators are moving in the direction of a warming planet.
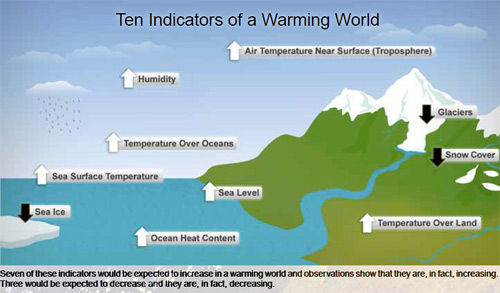
Seven indicators are rising: air temperature over land, sea-surface temperature, air temperature over oceans, sea level, ocean heat, humidity and tropospheric temperature in the “active-weather” layer of the atmosphere closest to the Earth’s surface. Three indicators are declining: Arctic sea ice, glaciers and spring snow cover in the Northern hemisphere. Jane Lubchenco sums it up well:
"For the first time, and in a single compelling comparison, the analysis brings together multiple observational records from the top of the atmosphere to the depths of the ocean. The records come from many institutions worldwide. They use data collected from diverse sources, including satellites, weather balloons, weather stations, ships, buoys and field surveys. These independently produced lines of evidence all point to the same conclusion: our planet is warming."
I suggest checking out the site as it has some great resources. There's a short video introducing the report. My favourite line from this is Deke Arndt's line, "Climate trains the boxer but weather throws the punches". If you want a quick summary, jump to the press release. There's DIY Climate Indicators with interactive displays and access to data set. And of course there's the full report (6.6Mb PDF).


 0
0  0
0 Fig. 7. Modeled configuration of the Greenland Ice Sheet today (left) and in MIS 5e (right), from Otto-Bliesner et al. (2006).

 What bothered me in this 'geocraft.com' plot was the conspicuous absence of the CO2 lows mentioned by Kouwenberg etal in the 2005 paper, as shown below in their Figure 3.
 The geocraft.com plot cites Kouwenberg and Ria (?) from the same year; did anyone check for other work by Kouwenberg's group? So my statement was simply that whoever put together 'The Plot' used only a portion of the available data. And that the conclusion reached by Kouwenberg etal. is the polar opposite of that reached by geocraft.
"studies exist that have conclusions that conflict with one another - that is a part of science"
I couldn't agree more. But it is also a part of science to follow all available data trails.
Unfortunately, this stomata business was picked up by the usual suspects, notably WUWT; I've already found 5 others that I won't give free publicity. And of course, WUWT gives a link back to the article at geocraft.com.
This is a great illustration of the denial machine at work.
The geocraft.com plot cites Kouwenberg and Ria (?) from the same year; did anyone check for other work by Kouwenberg's group? So my statement was simply that whoever put together 'The Plot' used only a portion of the available data. And that the conclusion reached by Kouwenberg etal. is the polar opposite of that reached by geocraft.
"studies exist that have conclusions that conflict with one another - that is a part of science"
I couldn't agree more. But it is also a part of science to follow all available data trails.
Unfortunately, this stomata business was picked up by the usual suspects, notably WUWT; I've already found 5 others that I won't give free publicity. And of course, WUWT gives a link back to the article at geocraft.com.
This is a great illustration of the denial machine at work.
 Not all "forcings" are born equal. They act on different parts of the climate system, therefore their strength expressed in W/m2 units does not fully determine their effects.
The NH snow cover annual trend graph has a sharp minimum at week 23.5 (summer solstice is week 24.5), while its maximum is at week 52 (winter solstice is week 51). What we can see here is that snow cover trends are almost exactly in phase with insolation. As surface temperatures lag insolation by almost two months due to high heat capacity of the climate system (mostly oceans), the trend observed is not caused by temperature (that is, by trapping outgoing longwave radiation), but by increased absorption of incoming shortwave radiation.
It is a big difference. One might even call it the smoking gun of climate science. It is all the more important because unlike most other climate indicators it is not lost in noise, but stands out very clearly.
Snow cover is increasing through mid October to January, when Northern Hemisphere insolation is low, decreasing otherwise. Therefore it is some immediate effect of sunshine, not a delayed one like the alleged thermal radiation trapping effect of carbon dioxide. For thermal radiation getting available to be trapped, surface temperatures have to be increased first. But that does not happen until later in the year.
The most probable candidate for increased SW absorption is decreasing snow albedo due to black carbon (i.e. soot). There is also a positive albedo feedbeck at work here. The more snow is melting, the more bare soil is exposed to the sun. This very albedo change can explain glacier and ice sheet phenomena as well.
The good news is that residence time of soot in the atmosphere is very low (around 1 week), so as soon as emissions are decreased, the effect vanishes. It is also much cheaper to reduce soot emissions than carbon dioxide, as the technology is already available and is mostly installed throughout developed countries.
What about a soot duty on Chinese products? And a ban on small Diesel engines perhaps (like those in cars). Or help to replace heavy soot generating biofuels (like dung) as cooking materials in India and Africa by natural gas or electricity? Or to introduce reasonable woods maintenance practice in North America by making removal of dead wood from managed forests compulsory (as it is done in Europe)?
Not all "forcings" are born equal. They act on different parts of the climate system, therefore their strength expressed in W/m2 units does not fully determine their effects.
The NH snow cover annual trend graph has a sharp minimum at week 23.5 (summer solstice is week 24.5), while its maximum is at week 52 (winter solstice is week 51). What we can see here is that snow cover trends are almost exactly in phase with insolation. As surface temperatures lag insolation by almost two months due to high heat capacity of the climate system (mostly oceans), the trend observed is not caused by temperature (that is, by trapping outgoing longwave radiation), but by increased absorption of incoming shortwave radiation.
It is a big difference. One might even call it the smoking gun of climate science. It is all the more important because unlike most other climate indicators it is not lost in noise, but stands out very clearly.
Snow cover is increasing through mid October to January, when Northern Hemisphere insolation is low, decreasing otherwise. Therefore it is some immediate effect of sunshine, not a delayed one like the alleged thermal radiation trapping effect of carbon dioxide. For thermal radiation getting available to be trapped, surface temperatures have to be increased first. But that does not happen until later in the year.
The most probable candidate for increased SW absorption is decreasing snow albedo due to black carbon (i.e. soot). There is also a positive albedo feedbeck at work here. The more snow is melting, the more bare soil is exposed to the sun. This very albedo change can explain glacier and ice sheet phenomena as well.
The good news is that residence time of soot in the atmosphere is very low (around 1 week), so as soon as emissions are decreased, the effect vanishes. It is also much cheaper to reduce soot emissions than carbon dioxide, as the technology is already available and is mostly installed throughout developed countries.
What about a soot duty on Chinese products? And a ban on small Diesel engines perhaps (like those in cars). Or help to replace heavy soot generating biofuels (like dung) as cooking materials in India and Africa by natural gas or electricity? Or to introduce reasonable woods maintenance practice in North America by making removal of dead wood from managed forests compulsory (as it is done in Europe)?


Comments