


 Arguments


The Past and Future of the Greenland Ice Sheet
Posted on 31 July 2010 by Ned
Guest post by Ned
The Greenland ice sheet has a negative mass balance, meaning that it is losing ice (Velicogna 2009, Jiang 2010). This loss occurs because the gain of new ice (in the form of snowfall within the ice sheet's interior zone of accumulation) cannot keep up with the rapid loss of ice through melting and the discharge of ice by marine terminating outlet glaciers (van den Broeke 2009). Figure 1 shows the overall downward trend in the ice sheet's mass:
Figure 1: Greenland ice mass anomaly (black). Orange line is quadratic fit (John Wahr).
As recently as the 1980s Greenland's ice was probably more or less in equilibrium (Rignot 2008, Jiang 2010). But by the late 1990s and early 2000s this ice began to retreat, and the rate of retreat may be accelerating (Velicogna 2009, van den Broeke 2009). Some claim that there's no need to worry about this, since only a tiny fraction of the total ice mass is being lost each year. Others point out that the accelerating rate of loss means that there may be trouble ahead.
Who is right, and how can we tell? There are two ways of answering this question - we can look at the history of the Greenland ice sheet to see whether past episodes of warmth have led to extensive loss of ice, and we can use physical ice sheet models to predict the future behavior of Greenland's ice in a warming climate.
Pleistocene history of the Greenland ice sheet
A new paper published this month in Quaternary Science Reviews (Alley et al. 2010) provides a very comprehensive overview of the history of the Greenland ice sheet over the past half-million years. In general, the further back we look in time, the less certainty there is about the condition and extent of Greenland's ice.
Paleoclimate scientists divide the Quaternary cycles of glacial cooling and interglacial warmth into a series of Marine Isotope Stages (MIS). The Holocene, the current warm stage in which our civilization has arisen and flourished, is MIS-1. The most recent glacial episode (from approximately 110,000 to 14,000 years ago) is divided into MIS-2, -3, and -4. The last previous interglacial, from 130,000 to 110,000 years ago, is referred to as MIS-5e. Looking back further in time, glacial and interglacial episodes alternate, with MIS-6, -8, and -10 being glacial and MIS-7, -9, and -11 being interglacial.
Note that the earliest of these interglacial episodes (MIS-11, around 400,000 years before present) is believed to be the best analog to our current MIS-1 interglacial climate, based on the geometry of the Earth's orbit (Berger and Loutre, 1991).
History of the Greenland ice sheet prior to the last interglacial: Greenland's ice is believed to have shrunk during warm interglacial episodes MIS-11, -9, and -7. During MIS-11, the most similar to our current interglacial, sea levels were much higher, probably enough to necessitate the near-total loss of Greenland's ice (Alley 2010), and ancient DNA found at the bottom of ice cores likewise suggests an ice-free Greenland at this time (Willerslev 2010). Likewise, during glacial advances MIS-10, -8, and -6, Greenland's ice expanded and global sea levels dropped. The greatest expansion of ice may have occurred during MIS-6, just prior to the last interglacial (Alley 2010).
Greenland during the last interglacial (120,000 years before present): The Greenland ice sheet did not entirely disappear during MIS-5e, though it was smaller and steeper. There is no ice predating MIS-5e at the bottom of cores from south, northwest, and east Greenland, but older ice is present in central and north-central Greenland ice cores, where (based on the gas content of bubbles in the ice) it appears to have been close to or slightly thinner than today's ice sheet (Alley 2010). Figure 2 shows a model comparison of today's ice sheet with the ice sheet during MIS-5e.
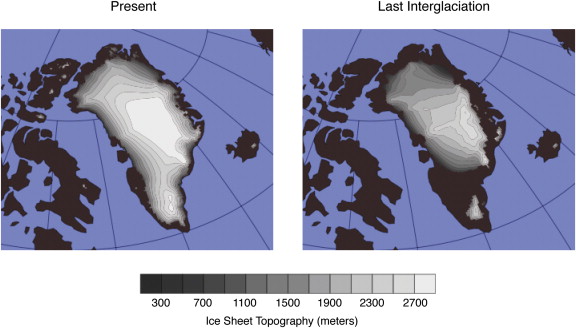
Figure 2: Modeled configuration of the Greenland Ice Sheet today (left) and in MIS 5e (right), from Otto-Bliesner (2006).
Alley (2010) conclude that it is probable that the loss of ice from Greenland during this time period contributed approximately 3–4 m to global sea levels, in response to a local warming of around 3°–4 °C in Greenland. This nicely fits with our understanding that sea levels were at least 6 m higher that today; the remainder of that rise would have come from the loss of ice in West Antarctica, mountain glaciers, and thermal expansion of seawater.
The last 100,000 years: The Greenland ice sheet expanded during the final Pleistocene glacial advance (MIS-4, -3, and -2), until around 24,000 years before present, when it covered an area 40% larger than its current extent. With the end of this last glacial episode the world warmed, the other large continental ice sheets in North America and Eurasia retreated, sea levels rose by tens of meters, and Greenland's ice sheet shrunk significantly. However, superimposed on this broad pattern of expansion and contraction were a large number of shorter-duration (millennial-scale) increases and decreases in ice mass, generally associated with changes in North Atlantic circulation and other regional climate transitions.
The future of the Greenland ice sheet
Stone (2010) have used models to simulate the likely future loss of ice from Greenland in response to anticipated future warming. The loss of most of the ice sheet would likely occur at atmospheric CO2 concentrations somewhere between 400 and 560 ppm, a rather disturbing finding given that we are currently at 392 ppm and will probably exceed 560 ppm later this century, as shown in Figure 3.
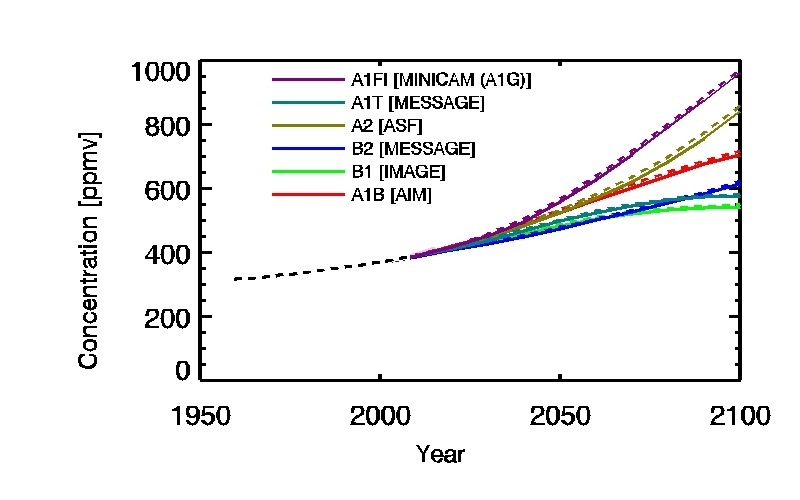
Figure 3: Atmospheric CO2 concentrations as observed at Mauna Loa from 1958 to 2008 (black dashed line) and projected under the 6 SRES marker and illustrative scenarios. From IPCC.
This loss of ice from Greenland alone would be enough to raise sea levels by roughly six meters. This process would probably take centuries or millennia. The fact that Greenland was largely free of ice during the previous interglacial episode MIS-11 (Alley 2010) confirms that this is not an unrealistic scenario.
Some people find the subject of post-2100 climate changes rather abstract. In contrast, 2100 itself is not that distant -- based on life expectancy data, the average girl born in Japan in 2015 will still be living in 2100. So what are the likely outcomes for Greenland (and global sea level) over the remainder of this century?
An accurate answer to this question requires consideration of the physical constraints on the discharge of ice from Greenland into the surrounding ocean. Figure 4 shows some of these constraints, including the locations of marine terminating glaciers and the fraction of Greenland's bed that is below sea level. Realistic modeling of the kinetics of glaciers suggests that a total increase in sea level of 0.8 m from all sources is likely by 2100, with increases of up to 2 m possible but increasingly unlikely (Pfeffer 2008). This matches closely the results of another semi-empirical study (Vermeer and Rahmstorf 2009) of the relationship between temperature and sea level.
The uncertainty in this range mostly relates to the rate at which ice is lost through calving by Greenland's marine-terminating outlet glaciers; the surface mass balance (between precipitation and melting/runoff) is much more predictable. The 0.8 to 2 m range of global sea level rise by 2100 would imply 7.1 cm of sea level rise from Greenland's surface mass balance, plus 9.3 to 46.7 cm from ice discharged into the ocean by Greenland's outlet glaciers (Pfeffer 2008).
Figure 4: Map showing Greenland and outlet glacier gates; marine-based gates are shown as dark green and nonmarine as black. Regions below sea level are colored blue. Ice velocities at  2000 m elevation shown by red dots (Pfeffer 2008).
In conclusion, a pessimistic but reasonable scenario would produce the melting of somewhere around 5% of the Greenland ice sheet by 2100, contributing 16 to 54 cm to global sea level rise (which in turn would then total 80 cm to 2 m from all sources). However, at that point the collapse of Greenland's ice sheet would just be getting started - failure to constrain CO2 concentrations below 400-560 ppm would almost certainly lead to the near-total loss of the ice sheet, as we have seen from both model results and comparison to the MIS-11 interglacial climate of 400,000 years ago.


 0
0  0
0 Figure 1: Comparison of Current Greenland Temperatures with Previous Temperatures (Chylek et al, 2006)
Perhaps we should wait until definitive records over a longer timescale are available before we reach unwarranted conclusions about AGW causing melting of the Greenland icecap?
Figure 1: Comparison of Current Greenland Temperatures with Previous Temperatures (Chylek et al, 2006)
Perhaps we should wait until definitive records over a longer timescale are available before we reach unwarranted conclusions about AGW causing melting of the Greenland icecap?


 Surface Mass Balance (blue) and its components precipitation (red), runoff (orange) and sublimation (green).
 The match between the ice core proxy and the instrumental record is reasonably good for the overlapping period. Part of the difference may be due to the distance between the two sites (up to 1000 km).
We can see temperatures over Greenland in the 1930s were a bit higher than today. They were even higher around 1140.
If we have a broader look, to the entire holocene, we can see temperatures were up to 3°C warmer than today several times, with somewhat less snow accumulation.
The match between the ice core proxy and the instrumental record is reasonably good for the overlapping period. Part of the difference may be due to the distance between the two sites (up to 1000 km).
We can see temperatures over Greenland in the 1930s were a bit higher than today. They were even higher around 1140.
If we have a broader look, to the entire holocene, we can see temperatures were up to 3°C warmer than today several times, with somewhat less snow accumulation.
 Still, the Greenland ice sheet has not collapsed and the sea never flooded London.
 One of the sites is at the eastern edge of the Greenland sea, south of Svalbard, the other one is in the Norwegian sea.
GEOPHYSICAL RESEARCH LETTERS, VOL. 30, NO. 6, 1280,
doi:10.1029/2002GL016570, 2003
Arctic/North Atlantic Oscillation signature in Holocene sea surface temperature trends as obtained from alkenone data
N. Rimbu, G. Lohmann, J.-H. Kim, H. W. Arz, and R. Schneider
Department of Geosciences, Bremen University, Bremen, Germany
Received 6 November 2002; revised 23 December 2002; accepted 10 January 2003; published 19 March 2003.
One of the sites is at the eastern edge of the Greenland sea, south of Svalbard, the other one is in the Norwegian sea.
GEOPHYSICAL RESEARCH LETTERS, VOL. 30, NO. 6, 1280,
doi:10.1029/2002GL016570, 2003
Arctic/North Atlantic Oscillation signature in Holocene sea surface temperature trends as obtained from alkenone data
N. Rimbu, G. Lohmann, J.-H. Kim, H. W. Arz, and R. Schneider
Department of Geosciences, Bremen University, Bremen, Germany
Received 6 November 2002; revised 23 December 2002; accepted 10 January 2003; published 19 March 2003.
 ARCTIC
VOL. 43, NO. 1 (MARCH 1990) P. 50-54
An Early Holocene Bowhead Whale (Buluena mysticetus) in Nansen Sound, Canadian Arctic Archipelago
JAN BEDNARSKI
(Received 20 March 1989; accepted in revised form 23 June 1989)
ARCTIC
VOL. 43, NO. 1 (MARCH 1990) P. 50-54
An Early Holocene Bowhead Whale (Buluena mysticetus) in Nansen Sound, Canadian Arctic Archipelago
JAN BEDNARSKI
(Received 20 March 1989; accepted in revised form 23 June 1989)
 The site of the skeleton is 500 km away from the present day margin of their habitat, only accessible through heavily ice laden narrow channels.
They do like it cold, but being mammals they also need breathing. They can break through 20 cm thick ice with their heads, but not thicker.
The site of the skeleton is 500 km away from the present day margin of their habitat, only accessible through heavily ice laden narrow channels.
They do like it cold, but being mammals they also need breathing. They can break through 20 cm thick ice with their heads, but not thicker.
 it appears (black trace is the average reconstruction) that the Holocene peak roughly matched 2004 temperatures. Other references I've run across indicate that if temps rise another 1°C, it'll be the hottest it's been in the last 1.35 million years.


Comments