Climate Science Glossary

Term Lookup

Enter a term in the search box to find its definition.

Settings

Use the controls in the far right panel to increase or decrease the number of terms automatically displayed (or to completely turn that feature off).

Term Lookup

Settings


All IPCC definitions taken from Climate Change 2007: The Physical Science Basis. Working Group I Contribution to the Fourth Assessment Report of the Intergovernmental Panel on Climate Change, Annex I, Glossary, pp. 941-954. Cambridge University Press.

Home Arguments Software Resources Comments The Consensus Project Translations About Support

Bluesky Facebook LinkedIn Mastodon MeWe

Twitter YouTube RSS Posts RSS Comments Email Subscribe


Climate's changed before
It's the sun
It's not bad
There is no consensus
It's cooling
Models are unreliable
Temp record is unreliable
Animals and plants can adapt
It hasn't warmed since 1998
Antarctica is gaining ice
View All Arguments...


Username
Password
New? Register here
Forgot your password?

Latest Posts

Archives

The human fingerprint in the seasons

Posted on 3 December 2010 by John Cook

In 1896, Svante Arrhenius mentioned that greenhouse warming should cause winters to warm faster than summers (Arrhenius 1896), citing an earlier prediction by John Tyndall (Tyndall 1865). During summer, a region receives more sunlight and warms. During winter, the region receives less sunlight and cools by radiating heat to space. Greenhouse gases stop some of this heat from escaping to space so an increased greenhouse effect slows down the winter cooling. Consequently, if greenhouse gases are causing global warming, we expect to see winters warming faster than summer.

A pair of studies (Braganza et al 2003, Braganza et al 2004) recognise that within the temperature record are a number of climate indices that can tell us more about what's causing temperature change than mere global temperature. The difference in trend between summer and winter, between land and ocean warming, between the equator and the poles - these all hold vital clues into what has caused climate change since the instrumental record began in the 1800s.

They found that winters have been warming faster than summers. What's interesting is how the seasons have changed over time. In the early 20th century, they find the warming is a combination of man-made and natural forcing (eg - from the sun) as well as some internal variability (eg - ocean cycles). In the latter 20th century, man-made forcing accounts for nearly all the observed temperature changes (Braganza et al 2004).

To check this out for myself, I tried plotting the winter vs summer trend using the CRUTemp Northern Hemisphere land temperature record. Robert Way kindly helped out by working out the winter and summer temperature anomalies and plotting them  (here's the Excel file for the curious climate tragic).
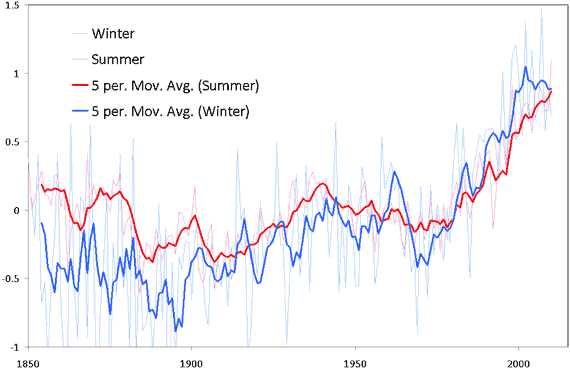
 

Figure 1: Yearly temperature anomaly for Northern Hemisphere winter (light blue) and summer (light red) plus five year moving average for winter (thick blue) and summer (thick red). Data comes from CRUTemp, base period is 1961 to 1990.

Not only does the faster warming winter provide evidence for greenhouse warming (on top of many other lines of evidence for man-made global warming), it also provides evidence that the sun isn't the cause of recent global warming. If global warming was driven by the sun, we should see summer warming faster than winter. This is just one of the "solar fingerprints" that we would expect to see from solar warming, that we don't see. Interestingly, many of the solar fingerprints are quite different to the patterns expected from greenhouse warming

For example, greenhouse warming predicts nights should warm faster than days while solar warming is the other way around. Observations are consistent with greenhouse warming. Similarly, if global warming was driven by the sun, we should see the stratosphere warming as well as the troposphere. Greenhouse warming, on the other hand, warms the troposphere but cools the stratosphere. Again, observations match greenhouse warming.

Solar warming should result in the tropics warming faster than the poles. What we observe instead is the poles warming around 3 times faster than the equator. All these pieces of evidence paint a consistent picture - greenhouse gases, not the sun, are driving global warming.

UPDATE 10 Dec 2010: In the original posting of this blog post, I mistakenly posted a graph of global temperature, not northern hemisphere temperature (which is a bit annoying - back when I was preparing this post, Robert and I looked at both NH and global trends then I mistakenly used the wrong Excel file when exporting the final graph). I've updated the post with the NH temps.

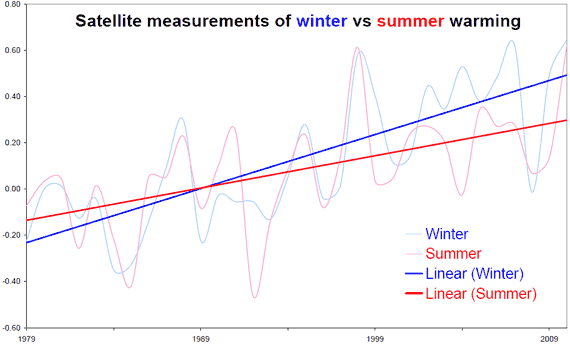
UPDATE 11 Dec 2010: Many thanks to muoncounter who went to the trouble to compare Northern Hemisphere winter vs summer temperatures in the satellite record - a handy way to independently confirm the surface measurements (here's the Excel file):
 

0 0

Printable Version  |  Link to this page

Comments

Prev  1  2  

Comments 51 to 59 out of 59:

  1. Sphaerica @49, you are in fact quite correct, which is why I said only to a "first approximation". Having said that, if we (following the IPCC) use 1.2 degrees for in initial forcing for a doubling of CO2, and 2.8 for the equilibrium responce, then the ratio of expected signal from GH warming to that from solar warming is 8.4 to one. Larger sensitivities reduce this ratio, but larger sensitivities make denying significant threat from anthropogenic CO2 indefensible. Further, as my third point indicates, responce the water vapour responce to different forcings is not quite identical, giving us a clear signal even with relatively strong feedbacks.
    0 0
  2. Chris G @50, stratospheric cooling because of increased CO2 is largely related to improved efficiency of radiating away heat in the stratosphere. As the stratosphere is very dry, H2O does not contribute signficantly to that cooling. In fact, stratospheric H2O is increasing slightly which would contribute as a minor effect to the cooling, but that is because of H2O from jet exhausts, not because of the warming surface. The tropopause is not the location of radiative balance but the point of balance between energy brought from the lower atmosphere by convection and that introduced to the upper atmosphere by absorption of UV light. That is why the tropopause is very high in the tropics and very low at the poles.
    0 0
  3. 44 Albatross So fingerprint = correlation? Is that all? Wow. Anyway I managed to get side tracked onto solar variance. There's a huge review of it here. http://www.agci.org/dB/PDFs/10S1_LGray_SolarInfluencesCLimate.pdf There are numerous references to a link between solar variance and winter warming trends which seem to contradict "If global warming was driven by the sun, we should see summer warming faster than winter.". It looks like observational based correlations of solar cycle variance are better at identifying a winter warming trend than one in summer. There's plenty of interesting points in that review to get both sides of the argument excited.
    0 0
  4. HumanityRules #55 Very well spotted. All that's needed now is to find a solar variation that would justify quantitatively the observed recent warming. Any links on this one? OTOH, I think there's plenty of evidence about another known forcing that has risen during the last half a century.
    0 0
  5. HumanityRules the two warming trends are both real and shown in the figure above. It's not clear to me why you say that the solar forcing influence on winter temperatures contradicts that the influence is larger in summer.
    0 0
  6. Alexandre to quote from the review linked by HumanityRules:
    There have been suggestions that 20th century global and hemispheric mean surface temperature variations are correlated to longer-term solar variations. Advanced statistical detection and attribution methodologies confirm that solar forcing contributed to the increase in global temperatures in the early part of the century but for the latter part of the 20th century they consistently find that using realistic variations, solar forcing played only a minor role in global warming, in agreement with the practically constant mean solar forcing since 1980.
    The passing of time doesn't apper to help the "it's the sun" supporters.
    0 0
  7. 55 (Humanity Rules), I don't see what you see. I went through the review, and while there are frequent references to the terms "winter", "summer" and "season", they almost all have to do with data studied being limited to a particular season (e.g. MWP winters), not comparisons between the two. The only reference to a specific difference in the seasons has to do with stratospheric wind patterns, and even these were inferred from model runs, not observations. I find nothing at all in the review to support your claim. Alternately, the review also says this:
    ...many of these solar-climate associations also seemed highly improbable simply on the basis of quantitative energetic considerations.
    and
    Recent estimates suggest a radiative forcing drift associated with solar irradiance changes of 0.017 Wm-2 per decade (see section 2). In comparison, the current rate of increase in trace greenhouse gas radiative forcing is about 0.30 Wm-2 per decade (Hofmann et al., 2008).
    So I'm not sure how anyone could make any observations on seasonal impacts of solar variations when there haven't been any.
    0 0
  8. HR @55, "So fingerprint = correlation? Is that all? Wow." Umm, not quite. Read some more of Santer's seminal works. Earlier you said "The problem I have is that those two options aren't the only possibilities." Referring to options other than solar and volcanic forcing. But then @ 55 you misrepresent the findings form a study to try and support the “it’s the sun” argument. Also, I asked you to present a model here which does not include solar or volcanoes and that explains the nature of the observed long-term warming trend.
    0 0
  9. #52: Chris G, nice approach! Hope you don't mind, I tweaked it a bit and came up with a similar plot. I started in 1900.05 (January 15) and used a 3 sample average (hoping this would give a seasonal winter, ie DJF average). Then picked every 12 (should now be each winter) and then applied a smaller mean (since the dataset should now be sampled in years). Similarly for summers (JJA) beginnning in 1900.6. I hope I'm not reading too much into WFT's ability to resample monthly data into annual. Indeed winter rises faster than summer, although not by as much as NH rises faster than SH.
    0 0
  10. Humanity Rules introduces a new, high bar for a fingerprint. Let's apply it to a different milieu and see what happens. I go out and get drunk. I drive home, hit another car with a woman and 2 kids. They all die. One would expect that I would be charged and convicted with vehicular manslaughter, DUI and a few other crimes. Enter HRlogic! As I myself did not hit the other vehicle (it was rather my vehicle that hit their vehicle; indeed those poor unfortunates did not die from *my* car - it was instead various objects within their own vehicle that led to their untimely death. No fingerprint here). But it gets worse! My actual fingerprints are on the glass that contained the alcohol - 1) I didn't touch the alcohol 2)Even if you ignore the HRlogic in (1) - yes, I drank the alcohol - the fact that this alcohol interacted in predictable, knowable ways with my own biochemistry is not my fault - my only fingerprints are on the glass! The jury, following HRlogic, finds me innocent! I am back in the bars now. HR - care to drive in my town around 2am (when said bars close and me and my HRlogic fingers are driving home again)?
    0 0
  11. actually thoughtful, I think you missed HR's point. The fact is that either a solar or CO2 initial forcing will be accompanied by a strong H2O GHG positive feedback. That strong positive feedback will have the same GHG signature, and that will obscure the fact that in the case of solar forcing the initial forcing does not have such a signature. In your analogy, a better example would be for two different drivers, one who drank a lot of alcohol, and another who drank a little bit of alcohol, but combined it with prescription medicine. Both test positive for a blood alcohol content over the limit, and both caused horrific car crashes, and in that way the two are difficult to distinguish, but the prescription medicine distinction is lost without further evidence to support it.
    0 0
  12. The prescription medicine would still be detectable through multiple methods. Historical solar irradiance changes are also detectable.
    0 0
  13. Sphaerica - we KNOW there is no notable solar input to the current warming - from direct measurements of insolation, not from the seasonal patterns this post discusses (although the data here re-confirms the fact of no solar fingerprint). It seems my analogy stands.
    0 0
  14. #63: "either a solar or CO2 initial forcing will be accompanied by a strong H2O GHG positive feedback" The cause and effect of this mechanism seems a trifle thin and the story quickly becomes quite convoluted. a. If we postulate that once the initial solar or CO2 forcing gets a warming cycle started, do we then suggest that H2O feedback alone is sufficient to keep it going? Is H2O feedback sufficient to restart the warming system after a transient cooldown, such as a Pintatubo type event? b. If solar alone is the initial forcing, where is the record of that solar event? Have they happened in the past? Where are those records? c. How can CO2 be an 'initial forcing', when CO2 forcing continuously increases with the log of the CO2 concentration relative to 'pre-industrial'? Initially the ratio of CO2 to pre-industrial would be close to 1 and its log close to 0. d. If it is accepted that CO2 is the initial forcing, why is the same mechanism (CO2 forcing) not continuously doing the forcing? How does it get switched on and off? As I said, convoluted. It is stunning that some folks will accept these complicated schema when there is a far simpler answer at hand.
    0 0
  15. So Tom (#54), Convection is a result of lower air holding more energy (or being warmer, and thus relatively less dense on a curve described by atmospheric density driven by gravity and PV=nRT) than the air above it; where does this energy come from if not radiated or conducted from the surface? Convection is a movement of matter, not really a transfer of energy from some matter to some other matter. Flippancy aside, I see your point that the stratosphere will radiate more with more CO2, but it is also true that the troposphere will absorb more with more of any GHG. If it absorbs more, it will also be warmer and radiate more. What I've read leads me to believe that stratospheric cooling has more to do with the radiative imbalance that the earth is currently in. Mouncounter, Thanks! Don't mind at all, wouldn't have posted what I had if I wasn't looking for some other ways of doing it. Thinking more on the difference between the degree of warming of the NH compared to the SH. I would hazard a guess that it has something to do with the NH having a lot more land surface than the SH. Heat at the surface of the ocean gets distributed downward a lot more readily than heat at the surface of land. So, you'd want to look more at heat content down to some depth than surface temperatures.
    0 0
  16. actually thoughtfull @65 I still think you are missing HR's point. If you need to invoke TSI measurements then this work does not supply new independent evidence for an increased GHE, because you are reliant on the TSI measurements to interpret the results "correctly". I'm no expert in this field but it seems to me that Michael Sweet @24 had a good point: Given the short lifetime of Water Vapour in the atmosphere then surely it responds to the changing local solar irradiance, but not to heat "trapped" by CO2. Given that, it seems that this work is more convincing the Nighttime/Daytime argument when WV has less time to respond.
    0 0
  17. I don't know enough geology to produce heat content measurements for land, though I have seen heat content papers of the oceans. However, it struck me that NH versus SH should be similar if I were right about the heat content at depth. So, I tweaked my graph. No disrespect to Muoncounter, but I'm not sure which three samples 'mean:3' is applied to at WoodForTrees; so, I stuck with my first method for now. Besides, as much data is being aggregated already, I doubt that the additional months will change the shape much. Sea Surface Temperature Anamolies 2x2 of NH-SH, January-July It isn't exactly what I was expecting. Instead of NH and SH being very similar, instead, the SH is showing more disparity between winter and summer warming than the NH is. I wonder if I'm just seeing a random correlation or if there is a physical reason for this difference. I'd hazard a guess that it might have something to do with the north pole being in the middle of an ocean and the south pole being in the middle of a continent. Tom Curtis, Continuing... To use a loose analogy, if there is a body being heated by some relatively constant energy source, and you cover it with a blanket, until a new equilibrium temperature is reached, the blanket will be cooler and radiate less energy than the body used to. But, after a new equilibrium is reached, it will radiate exactly the same. Of course, the body will be warmer.
    0 0
  18. Chris G #67, you may be failing to consider that the troposphere is optically thick in the 15 micron (CO2) band, while the stratosphere is optically thin. Because the troposphere is optically thick, if you increase CO2 the net outgoing radiation will stay relatively constant but originate slightly higher in the atmosphere. (The increased altitude will mean the source CO2 will be slightly cooler, resulting in a slight reduction in outgoing CO2.) In contrast, because the stratosphere is optically thin, absorption will approximate to the Beer-Lambert law, so doubling CO2 will approximately double absorption and emission. The effect of this depends on the difference between tropospheric and stratospheric temperatures. If the stratosphere were cooler than the upper troposphere by an amount greater than the change in temperature at the effective altitude of radiation for the troposphere, then the effect would be to warm the stratosphere. Otherwise the effect is to cool it. More importantly, doubling CO2 concentration will double the amount of energy absorbed by CO2 in collisions; and double the amount of that collisional energy radiated away by CO2. A significant source of that energy is UV radiation absorbed by ozone. Because, with higher concentration, the CO2 would be radiating away that energy more efficiently, the stratospheric temperature will drop to reestablish a steady state. I believe this to be a larger effect than the first one. I have discussed this in more detail on the Stratospheric Cooling post on this site, particularly at comment 83 and comment 120.
    0 0
  19. @69, I don't particularly like that analogy because blankets work by limiting convection. As such they can have very low emissivity and their final radiant energy can still be much less than the initial radiant energy of the body covered. However, going with the analogy, it is more accurate to consider a blanket partially covering a cold blooded animal. Once a steady state is reached, there will be less energy released per unit surface from the blanket than there is from the exposed body, or there was from the exposed body before being covered.
    0 0
  20. #69: "It isn't exactly what I was expecting." When you do mean:66 after doing every:12, aren't you averaging 66 years? Cutting back even to a 30 year mean gives a cleaner break between NH summer and winter; SH summer and winter are overlain.
    0 0
  21. Muon, Yes, my graph is essentially a running mean with a 66-year window. (I think this is less than clear on the graph because the curve is justified on the left edge of the aggregation window rather than centered.) The data are noisy and if you can't explain the noise, the best thing to do is average it out. I like to use multiples of 11 because I surmise that the solar cycle will have some effect, and it is about 11 years long on average, and using a window over one complete wave, or multiples of the wave, is the best way to smooth out the noise induced by that wave. As a matter of preference, when I am making a picture depicting the larger effects, I like to average, or otherwise smooth out, the smaller ones. Tom, I read your posts and I hunted up some other material, and I agree it is true that the stratosphere will be cooler than it was even after a new equilibrium is reached largely because of the blockage from below and increased radiative energy loss from above, but I don't believe it is the only game in town. I do have some quibbles: I don't think it is very accurate to categorize the whole troposphere as optically thick. The mean altitude of emission is 5-6km, and that is about half the average altitude of the tropopause. So, the troposphere is getting optically thin at some point below the stratosphere. Optically, I don't think there is a clear cut-off between thick and thin; so, this is somewhat a matter of how they are defined. In a state of equilibrium, a body emits the same amount of energy as it receives. If slightly more insulation is added to the body, then the emission will be less than it was until a new, higher equilibrium temperature is reached. You can't raise the energy level within a body while keeping the inflow the same unless you reduce the outflow. In the case of the earth, the reduction of outflow would be observed as stratospheric cooling. The pattern of a warmer surface and a cooler stratosphere this effect causes would be be hard to distinguish between H2O and CO2. I think you are taking the blanket analogy a bit too literally. If it makes you like it any better, you can say that it is a body in space (like the earth is a body in space) that is tightly covered in a thin insulating layer that does not appreciably change its surface area. I mean, if you define the surface area by using the optical TOA, what is the difference in surface area between an earth with 287 ppm CO2 and one with 385 ppm CO2, and what is this difference in comparison to the total surface area? Without doing the math, I can ballpark it as pretty dang negligible. So, it doesn't make a great deal of sense to introduce the idea that adding more insulation to the body appreciably changes the surface area from which it emits. Convection doesn't transfer energy in space. A cold-blooded animal is a poorer analogy than some generic body of matter receiving energy because said animals in time achieve the same temperature as their surroundings. In contrast, of course, the earth is continually receiving energy from the sun and stays considerably warmer than the surrounding space, if you could say that space has a temperature. Blankets also limit radiative energy loss.
    0 0
  22. Phil @ 68, I think I completely understand HR's point - which is why I can show the fallacy of the argument. Read my comment again - I point out that you DON'T need TSI to understand the current post, but it does, INDEPENDENTLY verify that TSI hasn't increased. As to your closing paragraph (perhaps I don't understand your point 100%) - the visual picture that paints is each excited water vapor molecule (heat) interviewing the molecule that bumped into it: "Excuse me - are you excited from TSI?" "Why yes, how did you know?!" [excited molecule jumps up and down, exhibits clear additional excitement] OR "Excuse me - are you excited by a glancing blow from CO2?" "Why yes, how did you know?!" [excited molecule visibly slumps, clearly showing less exitement] Then, of course, your last sentence seems to say the opposite. Can you clarify what you are trying to say?
    0 0
  23. Daniel Bailey #25 "if you feel you have something to add that shows waste heat amounts to more than 1% of GHG forcings, go back to that thread and comment on it there. " This comment (feel free to correct me if I am mistaken) implies that GHG's increases net heat (i.e. raising the energy level). Heat as opposed to a redistrubution of temperature are very different things. Even Arrhenius did not intend this. At the bottom of page 268 (the paper cited), it says, "The geographical annual and diurnal ranges of temperature would be partly smoothed away, if the quantity of carbonic acid was augmented." In the paper, the author is very specific about how the GHG affect latitudes differently, and especially poles and glaciers. Using these arguments to explain global warming is a distortion. The entire point of Arrheniu's paper is to explain a theory of how Nature modulates the coming and going of ice ages (not global warming), and in fact alludes to northern civilizations emerging as a consequence of naturally receding ice and not the other way around.
    0 0
  24. #75: "Heat as opposed to a redistrubution of temperature are very different things." Presumably you exclude heat that would otherwise be radiated to space from your 'redistribution' concept. But the 300-comments-and-still-growing 2nd Law thread has hashed that out.
    0 0
  25. 65 (Actually thoughtful)
    we KNOW there is no notable solar input
    This is very true, but beside the point. The question is whether or not this particular argument is further evidence of a lack of solar input, and it's not. Any warming, of any sort, will be accompanied by roughly 2C of GHG positive feedback in addition to the initial forcing. That means that any warming will have these same signatures (although to differing degrees). The fact that part of the warming could come from a non-GHG forcing will only be evident in relative degrees of these effects, and there's no way to break it down (without a few hundred earths on which to experiment). HR's point is valid. It doesn't disprove AGW, but this particular argument for proving GHG forced warming fails.
    0 0
  26. #77: "HR's point is... " If this: "either a solar or CO2 initial forcing will be accompanied by a strong H2O GHG positive feedback" was HR's point, it remains irrelevant until someone can explain the objections raised in #66. You cannot claim a point is valid if that point depends on a mechanism that is nonsensical.
    0 0
  27. muoncounter #76 "Presumably you exclude heat that would otherwise be radiated " CO2 at best translates (skyward) the location of heat departure, but does not "retain" any more heat than its specific heat capacity allows. Here, two links to compare these values. http://www.engineeringtoolbox.com/carbon-dioxide-d_974.html http://www.engineeringtoolbox.com/water-thermal-properties-d_162.html Given that water vapor has double the heat capacity of CO2, and abounds in excess of 100 times the anthropogenic contribution in CO2, this retained "energy" you are talking about represents at most 0.5% of the total ambient. I suppose that is energy, but it doesnt seem like much.
    0 0
  28. 66 (muoncounter), You seem to have tangled everything in knots as artfully as the most adept "skeptic." I suspect I introduced some of the confusion by using the phrase "initial forcing," which is redundant, and implies that a forcing is like a quick push. It's not. My intent was merely to distinguish the forcing from the feedback. A forcing is any change that alters the steady state of the system, changing (in this case raising) the equilibrium temperature. A feedback is a change to the system which results from the change in equilibrium temperature, but itself changes the temperature. A positive feedback is a feedback which enhances the initial change (i.e. changes the temperature in the same direction as the forcing). A negative feedback is a feedback which counteracts the initial change (i.e. changes the temperature in the opposite direction of the forcing). Our understanding of the climate system is that regardless of the forcing, there will be positive albedo, CO2 and H2O feedbacks. There may or may not also be cloud feedbacks, which could be positive or negative (we don't know yet). For a solar forcing to raise temperatures, TSI from the sun would need to have increased, and remain increased, just as CO2 levels must increase and remain increased. In no situation is there an "event" or "switch" or "restart" involved. The problem is merely, given a forcing, any forcing which is continuous and as such elevates temperatures, that forcing will be accompanied by strong GHG feedbacks (CO2, H2O) which will carry with them the same signature as a GHG forcing, and those feedbacks are roughly double the size of the initial forcing. This makes the statement that "a TSI forcing would not exhibit warmer winters and nights" false. That's all I'm saying. It doesn't prove or disprove anything. It's just not a valid argument.
    0 0
  29. @RSVP: By their percentage contribution to the greenhouse effect on Earth the four major gases are: water vapor, 36–70% carbon dioxide, 9–26% methane, 4–9% ozone, 3–7% Sources: Earth’s Annual Global Mean Energy Budget Water vapour: feedback or forcing?
    0 0
  30. Oops. Here is the working link to the Kiehl/Trenberth paper.
    0 0
  31. Sphaerica @77, Thanks for presenting these points. You said "Any warming, of any sort, will be accompanied by roughly 2C of GHG positive feedback in addition to the initial forcing. That means that any warming will have these same signatures (although to differing degrees)." And then @ 80 "This makes the statement that "a TSI forcing would not exhibit warmer winters and nights" false." These are very interesting points, if true. Elsewhere on this site, based on published papers, the following point is made, which seems to completely contradict your point: "If an increased greenhouse effect was causing warming, we would expect nights to warm faster than days. This is because the greenhouse effect operates day and night. Conversely, if global warming was caused by the sun, we would expect the warming trend to be greatest in daytime temperatures. What we observe is a decrease in cold nights greater than the decrease in cold days, and an increase in warm nights greater than the increase in warm days (Alexander 2006, Fan 2010). This is consistent with greenhouse warming." http://www.skepticalscience.com/its-not-us-intermediate.htm If you can counter that argument, would you post it there, but leave a bread trail here that you did so?
    0 0
  32. #80: "tangled everything in knots as artfully as the most adept "skeptic."" Ouch. Hardly my intent; most definitely not my meaning. "This makes the statement that "a TSI forcing would not exhibit warmer winters and nights" false." Let's test this idea. Here is a well-known TSI reconstruction: Surely we can agree that this graph shows the period of 1910-1945 or so had a fairly consistent run-up in TSI, what one might call a 'solar forcing'. Now for a temperature anomaly graph, attempting to show summer (green) and winter (red) in the NH, with a sunspot curve (blue) filtered to mimic the shape of the TSI graph. The sunspot curve is normalized to fit on the page and shifted down for clarity. The temp anomalies during this early 20th century TSI forcing have summers (green) warming faster than winters (red). The temp anomalies during the recent warming (which some feel is due to increased GHG concentration) have winters (red) warming faster than summers (green). Hence, a TSI forcing does not exhibit the same signature as a GHG warming.
    0 0
  33. archiesteel #81 It is my understanding that anthropogenic CO2 comprises 100 ppm of the 380 ppm, which is 26 percent of the 26% you have cited (taking the larger value)... .26 x .26 = 0.068. If greenhouse gases in sum have raised temperatures 30 degrees C, it would appear that the Earth has warmed 30 x .068 = 2.028 C since 1850 or so. Is this the case?
    0 0
  34. @RSVP: there are some issues with your math. First, most of the anthropogenic CO2 rise happened in the last few decades. Second, warming due to CO2 doesn't take place immediately, unlike what your reasoning implies. Combine the two point, and it becomes clear we haven't experienced the full impact of the warming for the *current* CO2 concentration (nevermind from increased CO2 in the future). Add to this the fact that oceans are apparently soaking up more heat than we previously thought (even in the deeper layers of the ocean), and you've got a pretty good explanation why temperatures have only risen by 1C so far. Nice try, though.
    0 0
  35. I'd also like to point out that *you* picked the higher value for the relative participation of CO2 to the greenhouse effect...
    0 0
  36. @muoncounter wins the thread, IMHO.
    0 0
  37. archiesteel - OHC is the last great unknown regarding AGW - do you have recent data or papers which inform your comment "Add to this the fact that oceans are apparently soaking up more heat than we previously thought (even in the deeper layers of the ocean)." I read last week that deep lakes were showing warming (sorry to say I don't have a link).
    0 0
  38. @AT: I was referring to the study that showed increased heat where it wasn't expected, i.e. the deep oceans. The story about deep lake showing warming is another example of this. I don't have links handy, but I'm sure a quick search on this site would bring the study up.
    0 0
  39. archisteel #87 "I'd also like to point out that *you* picked the higher value for the relative participation of CO2 to the greenhouse effect... " So taking the low value instead, "we" get 0.09 x 0.25 = 0.0225 x 30 = .68 degree"s" C, which apparently accounts for all the world's glaciers to be receding and observed ice melt acceleration in Greenland. Do you believe this?
    0 0
  40. @RSVP: why don't you tell me right away where you're trying to go with this, so we save some tiem? The resl question is, why not take the middle value, i.e. 17.5%? That gives us 1.365C. So, what about it? You seem to be missing the point I already demonstrated how your "equation" was wrong. The fact you avoided responding to my counter-arguments is all we really need to know. Thanks for playing.
    0 0
  41. actually thoughfull (way back @74 on molecules being interviewed) No this was not what I was suggesting :-) The point was that if there was a solar forcing causing increased WV in the atmosphere, then wouldn't the concentration of WV in the atmosphere (and hence the feedback) follow the forcing as it moved from hemisphere to hemisphere because of the differing temperatures of the atmosphere over the summer and winter locations. In contrast a CO2 forcing would not have a seasonal fluctuation and so the seasonal feedback (WV) variation would be less. If this were true then HR's objection to the original article is invalid: even with WV feedback, a Solar forcing would still result in summers warming faster than winters. Any clearer ?
    0 0
  42. 84 (muoncounter), I'm not sure you can do that. It's bootstrapping. More specifically, you are trying to prove that there is a unique GHG signature to warming by adopting the premise that warming prior to 1979 was a result of increased TSI (an unsupported premise, but lets skip that), and warming after 1979 was a result of CO2 (GHG). Having thus proved that GHG warming has a different signature (using the premise that warming after 1979 was a result of CO2), you then want to prove that warming after 1979 was a result of CO2, because it has a different signature. That said, I would be interested to hear a climate scientist's take on the fact that all warming of any sort should include substantial GHG feedbacks, and yet the signature warmer winters for GHG are only present after CO2 warming kicked in. This would seem to me to argue against a strong H2O/CO2 feedback. It implies that there was no GHG component at all to warming prior to 1979, and you can't have it both ways, you can't have a climate sensitivity with positive feedbacks that only kick in for CO2 but not for other forcings. Given this, it therefore implies a lower climate sensitivity across the board (which hardly seems to be the case, given the preponderance of other evidence to the contrary).
    0 0
  43. RSVP @85, the most important flaw with your caclulation is that forcing does not rise linearly with increased concentration, but rather with the log of increased concentration. By best current scientific estimate, the change in forcing in watts per square meter is expected to be 5.35 x the natural log of the current concentration divided by the initial concentration. Doing the maths, we then expect a no feedback temperature rise of 0.5 degrees c with an increase of CO2 from 280 to 380 ppm, and a rise of 1.25 degrees c after fast feebacks, once equilibrium is achieved. Given that it takes up to 30 years to achieve the equilibrium responce, the 0.9 degree rise in temperature since 1850 shown in the graph directly above your post seems well within expectations.
    0 0
  44. RSVP @79, the effect of CO2 is to increase the altitude at which part of the outgoing IR radiation from Earth is emitted. Because it is emitted at a higher altitude, it is emitted at a lower temperature, and hence emits less energy than is emitted at the surface in the same part of the spectrum. Heat capacity has nothing to do with it. You should also note that CO2 is well mixed, while H2O is concentrated in lower altitudes. Lower altitude means warmer, and hence a lesser reduction in the outgoing IR when compared to the surface. Therefore, the GH effect of CO2 relative to water vapour is larger than we would expect simply by comparing their ability to absorb IR radiation, and their relative abundance. Finally, in your comment @75 you completely misinterpret Arrhenius' paper. In particular, you will note on Table 7 he shows an increase in temperature at all latitudes for an increase in CO2, and likewise a decrease at all latitudes with a decrease. Yes, CO2 does moderate temperature differences due to diurnal and seasonal cycles, but because of its moderation of heat flows between the Earth and space, not because of its heat capacity.
    0 0
  45. Phil @ 93 - I kind of liked the WV molecules with the clipboard, interviewing all the molecules bumping into them. As to solar forcing having a different footprint - I think this is true. This is what the article says, and also what muoncounter traces out a different way in 84. But your own point remains muddy. Do you expect solar forcing to have a warmer summer? That is what the data shows? Do you expect a GHG forcing to have a warmer winter? That is what the data shows. I am glad we both agree that HRs original point does not hold - that is what got me into the conversation (after I got out of jail using HR logic). I'll tell the WV molecules to put the clipboards away. They will exhibit less excitement....
    0 0
  46. #94: Do I detect a goalpost shift? In #80, you claimed "any forcing which is continuous and as such elevates temperatures ... will be accompanied by strong GHG feedbacks (CO2, H2O) which will carry with them the same signature as a GHG forcing". If seasonal warming differences are such signatures (as per the point of this post), it appears they are not the same. I suppose we can debate why the signatures are different. As to cause of one warming episode vs. the other (a critical point), here is Meehl et al 2004: The late-twentieth-century warming can only be reproduced in the model if anthropogenic forcing (dominated by GHGs) is included, while the early twentieth-century warming requires the inclusion of natural forcings in the model (mostly solar). "It implies that there was no GHG component at all to warming prior to 1979," Not so. Merely that the solar forcing dominates. And that fits the idea that GHG forcings build slowly, as the forcing due GHG concentration is relative to pre-industrial concentration. Compare ln(300/280)= .07 vs. ln(380/280) = .305, a factor of more than 4 to 1.
    0 0
  47. Haven't had time to read the whole thread; justa adding onto 36 Sphaerica 39 Tom Curtis Actually, an increase in tropospheric H2O would tend to cool the stratosphere; it's a question of how much (H2O partially absorbs radiation from below in some bands, although not as extensively as tropospheric H2O; still, H2O is also at relatively small concentrations in the upper troposphere, and so it should be possible for H2O increase to reduce upward LW radiation at the tropopause in some of the same wavelengths that it can be absorbed in the stratosphere. Of course, if H2O increases in the stratopshere (from climate change? from CH4?), then ...) The seasonal and latitudinal fingerprints are also affected by feedbacks; in particular the surface albedo feedback. The most obvious fingerprint for greenhouse-forced warming (from well-mixed gases at least) in general is upper-atmospheric (above tropopause) cooling and the reduction in the diurnal temperature cycle absent feedbacks (regionally this can be complicated from changes in clouds and humidity and soil moisture and maybe the effect of CO2 itself on evapotranspiration?); others so far as I know require some fine points (finer-scale structures), differences) or more numerical specifications...
    0 0
  48. RSVP, I'm not sure you properly understand the concept of heat capacity. You said, "...but does not "retain" any more heat than its specific heat capacity allows.", which I take to mean that you think there is a limit to how hot CO2 can get. Your own link covers a temperature range of 175K to 6000K and I'm pretty sure the range you'll find in our atmosphere is within this range. Heat capacity does not limit how much energy a substance can hold, it describes how much energy is required to raise a unit mass's temperature one degree. Tom (#96), I've another nit with something you said, "Because it is emitted at a higher altitude, it is emitted at a lower temperature,..." In time, energy in always equals energy out. The mean point of emission does rise to a higher altitude at that time, but its temperature is the same as what it used to be. You get a warming at the surface by following the lapse rate down. Although, if you mean at a time prior to some new equilibrium being reached, then you are entirely correct. Otherwise, I concur with what you said, and I take back what I said about it would be hard to tell a H2O signature from a CO2. This is mostly because I remembered that H2O concentration varies not only with altitude, but also with latitude. There is a lot less of it in high latitudes; so, I think the polar amplification would not be as much. Which leads me to a thought on Sphaerica's comment, "...you can't have a climate sensitivity with positive feedbacks that only kick in for CO2 but not for other forcings." Certainly true, but it strikes me now that feedbacks might come into play at different rates or different degrees dependent on what the driver is. For instance, with a more uniformly distributed GHG like CO2, you might expect more polar amplification than you would with a solar forcing driving up H2O first, which will be less well distributed. There are interesting things going on now with polar albedo, melting permafrost, and methane release that would be delayed with less of a polar amplification effect. Really curious if I'm on to something with this; though, it's mostly academic.
    0 0
  49. Patrick 027 (#99), I think you'll find we've hashed this out already. My take-away points are that H2O will yield a stratospheric cooling by restricting outbound flow, and CO2 will yield a cooling by not only restricting the outbound flow, but also enhancing the stratosphere's ability to radiate energy.
    0 0
  50. Patrick 027 @99, an increase in tropospheric water will not significantly cool the stratosphere. Although the increase in tropospheric water will decrease the outgoing radiation in wavelengths where water vapour absorbs, in those wave lengths there are no significant absorbers in the stratosphere. Therefore the reduction in radiation in those wavelengths will not result in a reduction in energy being absorbed by the stratosphere. Chris G @100, when adding CO2 to the troposphere, it will initially reduce outgoing IR in the 15 micron wavelenght band. As the atmosphere approaches equilibrium, this IR radiation will tend to increase towards its prior value, but will never reach it. That is because the total outgoing radiation before the disturbance and after equilibrium is reached will be the same, but because the surface is hotter, IR radiation in those wavelengths not absorbed in the atmosphere will carry more energy. To preserve equilibrium, it follows that those IR wavelenghts which do face atmospheric absorption must carry less energy.
    0 0

Prev  1  2  

You need to be logged in to post a comment. Login via the left margin or if you're new, register here.


The Consensus Project Website

THE ESCALATOR

(free to republish)


© Copyright 2024 John Cook
Home | Translations | About Us | Privacy | Contact Us