Climate Science Glossary

Term Lookup

Enter a term in the search box to find its definition.

Settings

Use the controls in the far right panel to increase or decrease the number of terms automatically displayed (or to completely turn that feature off).

Term Lookup

Settings


All IPCC definitions taken from Climate Change 2007: The Physical Science Basis. Working Group I Contribution to the Fourth Assessment Report of the Intergovernmental Panel on Climate Change, Annex I, Glossary, pp. 941-954. Cambridge University Press.

Home Arguments Software Resources Comments The Consensus Project Translations About Support

Bluesky Facebook LinkedIn Mastodon MeWe

Twitter YouTube RSS Posts RSS Comments Email Subscribe


Climate's changed before
It's the sun
It's not bad
There is no consensus
It's cooling
Models are unreliable
Temp record is unreliable
Animals and plants can adapt
It hasn't warmed since 1998
Antarctica is gaining ice
View All Arguments...


Username
Password
New? Register here
Forgot your password?

Latest Posts

Archives

Did Global Warming stop in 1998, 1995, 2002, 2007, 2010?

Posted on 27 December 2010 by villabolo

A common claim, made by those who deny man-made global warming, is that the Earth has been cooling recently. 1998 was the first year claimed by 'skeptics' for "Global Cooling". Then 1995 followed by 2002. 'Skeptics' have also emphasized the year 2007-2008 and most recently the last half of 2010.

NASA and climate scientists throughout the world have said, however, that the years starting since 1998 have been the hottest in all recorded temperature history. Do these claims sound confusing and contradictory? Has the Earth been cooling, lately?

To find out whether there is actually a "cooling trend" it is important to consider all of these claims as a whole since they follow the same pattern. In making these claims, 'skeptics' take short periods of time, usually about 10 years or less, out of context ("Cherry picked.") from 30 years of evidence; the minimum needed to make a valid judgment.

'Skeptics' also take selected areas of the world where cold records for the recent past are being set while ignoring other areas where all time heat records are being set.

The temperature chart below is based on information acquired from NASA heat sensing satellites. It covers a 30 year period from January 1979 to November 2010. The red curve indicates the average temperature throughout the entire Earth.

The red line represents the average temperature. The top of the curves are warmer years caused by El Niño; a weather phenomenon where the Pacific Ocean gives out heat thus warming the Earth. The bottoms of the curves are usually La Niña years which cool the Earth. Volcanic eruptions, like Mount Pinatubo in 1991 will also cool the Earth so they are not counted. Although they are affected by Global Warming, El Niños and La Niñas occur whether or not there is Global Warming.

Figure 1: University of Alabama, Huntsville (UAH) temperature chart from January 1979 to November 2010. This chart is shown with no trend lines so the viewer may make his own judgment.

Below is the same temperature chart, showing how 'skeptics', manipulate the data to give the impression of 'Global Cooling'. First, they choose the warmest most recent year they can find. Then, in this case, they exclude 20 years of previous temperature records. Next, they draw a line from the warmest year (The high peak.) to the lowest La Niña they can find. In doing this they falsely give the impression that an ordinary La Niña is actually a cooling trend.
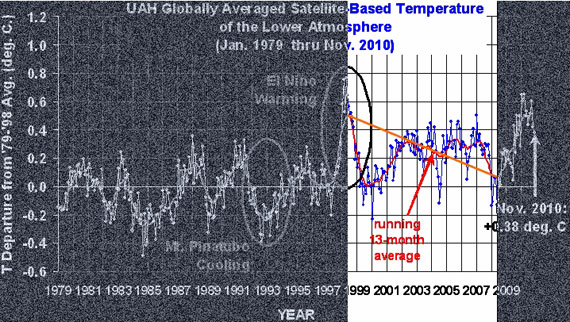
Figure 2: Representation of how 'skeptics' distort the temperature chart. Even though the chart clearly indicates increased warming, 'skeptics' take small portions of out of context to claim the opposite.

What do the past 30 years of temperature data really show? Below is the answer.
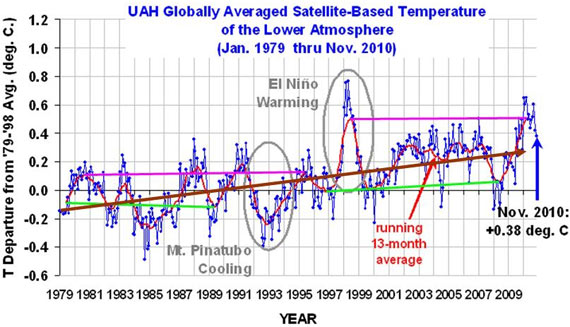
Figure 3: Trend lines showing the sudden jump in temperatures in the 1995 La Niña (Green lines) and the 1998 (Pink lines) El Niño events. Brown line indicates the overall increase in temperatures.

The chart above clearly shows that temperatures have gone up. They are, however, not going up in a steady curve as most people would expect. They are, instead, rising in a staircase fashion. That means they can remain flat for a few years and then suddenly jump up. Then once more they flatten out only jump up again a few years later.

When temperatures for the warm El Niño years (Pink lines) during 1980-1995 are compared to 1998-2010, there is a sudden increase of at least 0.2o Centigrade (0.36o Fahrenheit). Temperatures also jumped up by about 0.15oC (0.27oF) between the cool La Niña years (Green lines) of 1979-1989 and those of 1996-2008 (the eruption of Mount Pinatubo in 1991 lowered the Earth's temperatures in the midst of an El Niño cycle).The overall trend from 1979 through November 2010 (Brown line) shows an unmistakable rise.

While these increases do not sound like much they are more than enough to disrupt weather systems and cause severe damage to crops and human populations.

In spite of these facts, 'skeptics' simply keep changing their dates for 'Global Cooling'.

0 0

Printable Version  |  Link to this page

Comments

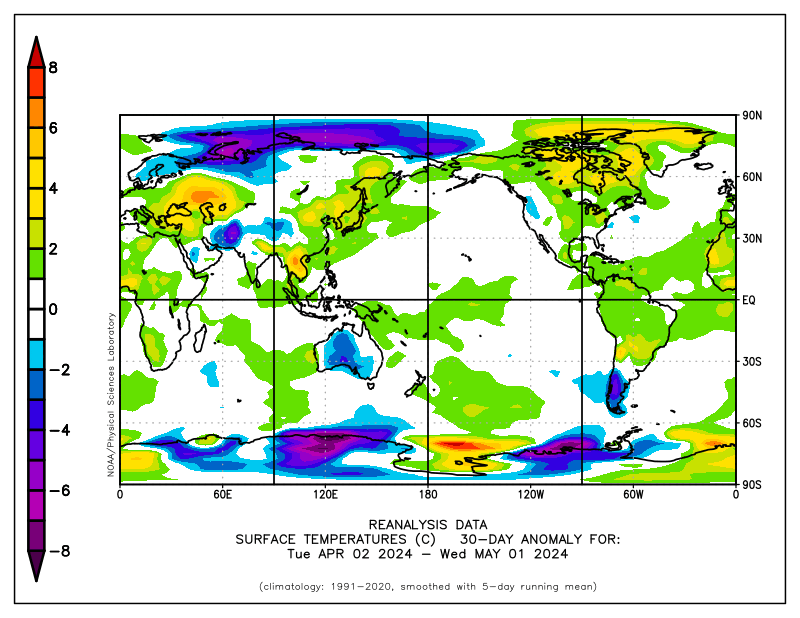
1  2  3  4  Next

Comments 1 to 50 out of 157:

  1. Those green and pink lines are interesting and disturbing, haven't seen that kind of analysis of the El Nino/La Nina contrasts before. The current La NIna, in Australia at least, seems to be an especially strong one, with record rainfall events and record flooding all over the place. Is this perhaps the start of another "jump" in La Nina events, to be followed, by the look of that graph, by a particular severe El Nino and a new level for those horrific (in Australia at least) events? Intuitively, more heat in the oceans and atmosphere should strengthen both La Nina and El Nino, but I had not previously seen an analysis that confirms this intuition. Oh, and Happy New Year to John Cook and all the regulars at SkS.
    0 0
  2. In western europe (Belgium) its now very hard to keep people awake about the GW danger. We have had 53 days of snow this year (a new record). Most people don't understand the difference between weather and climate and between cold and snow. Pfff. Is there a good website where you can see the average world temperatures?
    0 0
  3. http://data.giss.nasa.gov/gistemp/ has a link to Global Maps and station data. Is an average world temperature really what you want? The anomaly is normally used as it is less sensitive to station drop out.
    0 0
  4. Have'nt we been coming out of an ice age for the last 10,000 years? And if so, how is it possible to distinguish the effects of this trend with those possibly caused by man? How different would changes in albedo be as a result of natural Artic ice receding at the "last hours" of an "end of ice age" cycle? Referring back to past climate change... http://www.skepticalscience.com/What-does-past-climate-change-tell-us.html Even in the interim, (as per Figure 1 of the link), huge excursions existed in the past without man...puntuated changes exhibiting sharp slopes which if plotted over a thirty year window would also give the impression of a continuous trend.
    0 0
    Response: This comment is off-topic - the "we're coming out of an ice age" argument has been examined in detail (in fact, at a Basic, Intermediate and Advanced level).
  5. #4: "Have'nt we been coming out of an ice age for the last 10,000 years?" If you believe that, you really must tell that to the deniers who claim 'we're going into an ice age!'. And the ones who claim 'its just warming after the LIA!'. And the ones who claim 'it's UHI!' or 'it's waste heat'. Because you can't have it both ways. A double denial = agreement. In short, no. Technically, we are still in an ice age, but the glacial stage of it ended approx 10kya. If, as some claim, we are warming on a 'ramp' of 1.2 deg/century because of the end of this glacial, that would be 120C. See Ice data made cooler for some nice graphics. But you do suggest an interesting exercise: take a graph like Fig 1 from here and plot it on a 30 year time scale. Those 'sharp slopes' disappear ... except the one that got going in the last century or so.
    0 0
  6. Has anyone done a critique of Syun-Ichi Akasofu's paper "On the recovery from the Little Ice Age"? At first glance it looks interesting, and provides a possible alternate to some of the warming. http://www.scirp.org/journal/NS/
    0 0
    Moderator Response: Discussion of that belongs on the thread We're Coming Out of the Little Ice Age. Find it with the Search field at the top left.
  7. @Turboblock. Thanks for the link. Interesting paper (the 13.12.2010 paper). It would just be nice to put a thermometer in the earts ... to get rid of all those local variations when talking to people :)
    0 0
  8. 4 (RSVP), The fact that past climate changes have occurred without humans causing it is in no way an argument that the current climate change cannot be anthropogenic. That argument is a snake oil distraction. There are reasons why we believe (i.e. there is a consistent logic and evidence of the truth of that logic) that the current climate change is caused by human production of CO2. Study the site and Real Climate to find out why. You also need to study past climate more. For instance, the ice ages (and their termination) are caused by know changes in the earth's orbit and axial tilt. There's no magic there. And we haven't been "coming out of an ice age for the last 10,000 years." We are currently in an interglacial (a warm period amidst an ice age) and have been for about 10,000 years when the last glacial period ended. It's not a gradual thing. Within the interglacial, temperature trends can track up or down. The thing is, for the dramatic climate swings that we've seen in the past, there has always been a reason for them (often a very bad one). They've also often been associated with mass extinction events. Just because it's happened before in geologic history doesn't mean everything is okay and we shouldn't mind if it happens again.
    0 0
  9. Dear David, It actually isn't clear whether or how increased heat will affect the intensity of the ENSO cycle, i.e., El Ninos and La Ninas. The physical oceanography community has been exploring this for two decades. Furthermore, the graphic does not support your intuition. In fact, the ~100 record indicates there has been no measurable change in ENSO. This supports what Ove H-G has been saying for 20 years: it isn't ENSO driving bleaching, it is anthropogenic ocean warming. I am working on a full post on this issue with graphics and references. Respectfully, John
    0 0
  10. Sorry about that last post delete it please. Quibbling about whether it warmed or cooled during the last 12 years is pointless. For all intents and purposes it did neither. Why ? Here is a graph of the PDO from U of Washington. Please http://jisao.washington.edu/pdo/ As Mojib Latif said over short time periods [undefined] natural cycles like the PDO over rides CO2. Notice that from 1998 to 2010 the PDO has been negative as much as it has been negative. Is it just a coincidence that the cool years were when the PDO was negative ? You can see 2001 and 2002 and 2008 quite clearly. This periodic "failure to warm" makes the case for Catastrophic AGW look very thin ! The PDO was negative from 1940 to 1975 almost continuously and by coincidence that is the date of the infamous global cooling Newsweek article. But that is just a coincidence ! RIGHT ?
    0 0
    Moderator Response: [muoncounter] Posts using ALL CAPS tend to be deleted without warning. Also, your continual use of the word 'catastrophic' undermines whatever credibility you may be trying to establish.
  11. IMO "La Nina" is just another way of saying "the ocean is storing the warmth" (see fig 2 in Robust-warming-of-the-global-upper-ocean.html) That means the current El Nino is an example of the ocean is giving up stored warmth and/or not storing the CO2+feedback warmth or even storing the cooling which some say is supposed to occur during low solar activity.
    0 0
  12. Eric @12, Err, there is an unusually strong La Nina on the go right now, since around June 2010 in fact.
    0 0
  13. Sorry, the "recent" El Nino. Those have a shorter time scale than solar influences which are also short term compared to long term CO2 warming. So, for example, we should see an OHC rise over the next few years if the La Nina sticks around.
    0 0
  14. NETDR: This periodic "failure to warm" makes the case for Catastrophic AGW look very thin ! This claim makes no sense whatsoever. Please show your work.
    0 0
  15. @NETDR: posting about the PDO seems off-topic, but since moderators are allowing it allow me to respond. The PDO is a cycle, and as such it's overall trend curve is flat. The temperature increase, however shows a definite positive trend. Therefore, the current warming is not some sort of post-PDO bounce. In fact, the past 30 years show a strong positive trend for temperature, while the PDO index has been going down. "This periodic "failure to warm" makes the case for Catastrophic AGW look very thin !" There is no "failure to warm." "But that is just a coincidence ! RIGHT ?" Don't shout, please. It does not add to your already damaged credibility. While there is some degree of apparent correlation, it does seem it is CO2 that overrides the PDO, not the other way around. Facts simply do not agree with your interpretation of the PDO data.
    0 0
    Moderator Response: You're right, rhis now has gone thoroughly off topic. Comments after this one must go on the PDO thread. No complaining that so-and-so got to post here, so you should be able to follow up here.
  16. Those green and pink lines are interesting and disturbing, haven't seen that kind of analysis of the El Nino/La Nina contrasts before. The current La NIna, in Australia at least, seems to be an especially strong one, with record rainfall events and record flooding all over the place. Is this perhaps the start of another "jump" in La Nina events, to be followed, by the look of that graph, by a particular severe El Nino and a new level for those horrific (in Australia at least) events? Sorry for my late response. I know that 31 years is a short time to be making any dramatic predictions based on a graph alone, but we had a similar jump in temperatures around 1976 and yes, we seem to be on the verge of another one. That would make this our third stepwise "jump". The way things are going, only a few more years (In the context of the past 35 years.) should tell us that this is a certain trend. There are other more disturbing trends that threaten to throw a monkey wrench into our climate but that would take us off subject again.
    0 0
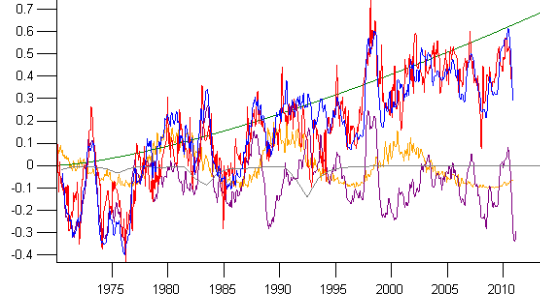
  17. I also expect another stepwise jump over the next few years. The following graph is very sloppy. I only use it as a kind of sketch to easier convey why I think a stepwise jump is imminent. The red line is HadCRUT3. The green line is just an arbitrary "background warming" curve (just to be able to say "hey even a curve fits this data"). The purple line is ENSO (MEI index). The orange line is sunspot number. The gray line is volcanic forcing taken from the modelE data file. The blue line is all the previous lines added together and doing that matches up with HadCRUT quite well. If I leave out the solar cycle I get a much worse fit. I have the scalings all written down and I update it every few months - the graph below goes up to November (except the HadCRUT3 red line which only goes up to October) From this you can see that what skeptics call "global warming stopping", ie the flat period since about 2002 is actually compatible with a background warming of about 0.15C during this period that's pretty well all canceled out by the negative ENSO and solar trend. To stall the warming indefinitely solar output and ENSO would have to keep declining. But they are both pretty well bottomed out now, in fact more likely than not over the next few years both ENSO and the solar cycle will contribute positively, therefore far from negating the longterm warming trend they are going to supplement it. Which is why I think a step change is already underway in global temperature. Although thanks to ENSO noise it will take perhaps a few years to be able to look back on the record and identify a step change has occurred.
    0 0
  18. There is an interesting article in The New York Times by Judah Cohen about the current Northern Hemisphere winter: http://www.nytimes.com/2010/12/26/opinion/26cohen.html?_r=2&ref=opinion Cohen works for AER. I didn't know anything about this company until I read the article. Apparently AER have a new model that shows the Siberian snow having a big impact on the winter elsewhere. It successfully predicted last years winter and this years. News release in 2002: http://www.aer.com/news/pr/2002/2002-11-18-cold_winter.html The main point made is that it is most definitely a feature of global warming.
    0 0
  19. "'Skeptics' also take selected areas of the world where cold records for the recent past are being set while ignoring other areas where all time heat records are being set." Yes, that is true. But don't forget that 'warmists' also frequently take selected areas of the world where heat records for the recent past are being set, while ignoring other areas where cold records are being set. For example, I have seen many comments on this web site, where heat records from the current year, 2010, are taken as strong indications of climate change. That is a time period of less than one year! The key point here seems to be "all time". As soon as there is an all time heat record on Ascension Island or in some town in Finland, it qualifies as evidence of a change in climate. An all time record cold spell in Europe, however, is worth nothing.
    0 0
  20. The impact of Siberian snowcover on NH winter temperatures and weather patterns is not a new idea, that has been around in climate models since the early 1980's. Employing the snowcover data with forecast success in a long term forecast model is new. It is a follow up on the research published by Gong, Frei and Cohen beginning with Gong et al (2003)and a second aper by Gong et al (2003)
    0 0
  21. Argus: "But don't forget that 'warmists' also frequently take selected areas of the world where heat records for the recent past are being set, while ignoring other areas where cold records are being set" That is complete junk. You have created a straw man. eg. you have fabricated an entity in order to knock it down.
    0 0
  22. Re mspelto@20 Thanks for pointing that out.
    0 0
  23. Re Argus @ 19 Rubbish! You are making accusations about articles where references to specific events are made while leaving out the surrounding context. You are "cherry picking" to make a claim of "cherry picking".
    0 0
  24. Actually, The Ville, the strawman's even more flimsy than you say ... "An all time record cold spell in Europe, however, is worth nothing." Argus ... this year's not been an all-time record cold spell in Europe ... and temps in London, for instance, are forecast to hit 50F tomorrow and will then drop into the low 40s later this week ... dead normal. Meanwhile, the capital of Greenland is forecast to be 24F above the historical average for January on Sunday ...
    0 0
  25. #18, #20: See the 'Its freaking cold' thread, where our old friend BP has weighed in on this question.
    0 0
  26. 24 dhogaza So you are using two predicted temperature reading from one location to re-inforce the idea that Argus is a terrible cherry-picker? No comment. Just to be clear you're telling the population of the UK the weather is "dead normal" at the moment?
    0 0
  27. "While these increases do not sound like much they are more than enough to disrupt weather systems and cause severe damage to crops and human populations." Do crops get damaged by weather or climate? Long term agriculture production seems to holding up pretty well in the face of this onslaught.
    0 0
  28. This is why temperature changes need to be considered on the decadal timescale. HM, poor choice of graph. That is just showing yield of crops per unit area which is pretty much meaningless in the context of your argument. Of course crop yields are going to increase as agriculture becomes more intensive. I bet those figures also correlate quite nicely with fertiliser production.
    0 0
  29. HR @27, This thread is about skeptics cherry-picking dates to fallaciously and misleadingly make claims about global temperature trends, and changing their dates for "global cooling". Now either you support that trickery or you do not. So, where do you stand on that? Then you can address your unreferenced graph and claim that crops are holding up "pretty well"-- although that discussion is probably better suited on another thread.
    0 0
  30. Albatross: Now either you support that trickery or you do not. So, where do you stand on that? I think HR's use of a cherrypicked FAO graph answers that question for him. Meanwhile, FAO's 2009 Profile for Climate Change notes that "Climate change negatively affects the basic elements of food production, such as soil, water and biodiversity." Furthermore, "it affects all four dimensions of food security: food availability, food accessibility, the stability of the food supply and the ability of consumers to utilize food including food safety and nutritional value." Therefore, "Action is needed now, [because] inaction will significantly increase future costs." In other words, FAO seems to agree with this article's claim that AGW is "more than enough to disrupt weather systems and cause severe damage to crops and human populations."
    0 0
  31. HR: "Do crops get damaged by weather or climate?" Erm, I live in the UK and often listen to a BBC radio programme called 'farming today'. Firstly lets start with the weather on the South Coast from Sept through to Dec 2010. Basically from Sept to Nov, it was incredibly warm for the time of year. Secondly the warm weather generally has resulted in bumper crops in some cases, the main problem is harvesting vegetables (eg. brussel sprouts). According to a organic farmer on 'farming today', he can harvest most of his crop at temperatures down to -10. Below that, the crop rots when it thaws. Actually what we do have in the UK is crop migration due to warming, which is why Camel Valley vineyard in Cornwall no longer has to use poly-tunnels to protect their vines. You also seem to have forgotten that Wheat prices have shot through the roof due to Russian droughts and wild fires. As has been stated in previous comments, a graph of crop yields has little to do with eventual production figures, carry over etc. The subject of climate change impact on farming and species is complicated. Simple statistics do not show crop migration (farmers adapting to changing climate) and other issues. UK organisations such as the Tree Council and the Forestry Commission are looking at trees that will grow in changing climates in the UK, including Oaks that have adapted to warmer climates in France.
    0 0
    Moderator Response: Additional discussion of crops must move to a more relevant thread such as "It's Not Bad."
  32. "Just to be clear you're telling the population of the UK the weather is "dead normal" at the moment?" As of 8:18 PM the temperature in London was 45F. Average high for January is 45F.
    0 0
  33. #32 (dhogaza): Priceless :) Let us see if the current normal (and above normal temps) in England continue and what Mr. Corbyn will have to say. I would not be surprised if they drop again, though. Something is majorly messed up with the Arctic circulation patterns.
    0 0
  34. About cold and warm temp records: 19 countries set national all time warm records in 2010 while only a single one set an all time low national record. The only thing that is relevant when discussing whether AGW is happening or not is the long term trend in average global temperature. 2010 will almost certainly be the warmest on record in most datasets. In case someone missed it, the average global temperature last week (UAH lower troposphere) was the highest on the posted record. As long as the global average is at the highest level recorded, warm local records are a natural and expected result of that, while local cold records are interesting and shows us that increasing the energy imbalance of the system does not cause even warming all over, but can cause local cold snaps as well. That tells us that it is even more crucial to cut greenhouse emissions and reduce the energy imbalance than if warm weather was the only problem, so skeptics highlighting unusual weather when the average is at record high levels would normally not be such a bright idea. However, the MSM love to lap up the disinformation and feed it to the ignorant masses, so the "skeptic" tactics work.
    0 0
  35. You asked what the past 30 years of temperature data really show. Looking at your graph in Figure 3, I'd say that the data shows warming at a rate of around 0.15 deg/decade. While that amount of warming will undoubtedly cause many changes for our planet, I'm not sure those changes should be labelled "catastrophic". Please note that I am not denying that the world is getting warmer and that human activity is the cause--obviously it is. What I am asking is this: does the current evidence suggest a rate of warming that merits the level of hysteria exhibited by some in the field of climate change? Right now, I would have to say no.
    0 0
  36. Looking at your graph in Figure 3, I'd say that the data shows warming at a rate of around 0.15 deg/decade. While that amount of warming will undoubtedly cause many changes for our planet, I'm not sure those changes should be labelled "catastrophic".
    Note that this will accelerate because 1. the planet hasn't reached equilibrium thus even if CO2 were held constant as of today we'd continue to see temperatures rise for a long time. 2. we're adding CO2 to the atmosphere at an exponential rate, which will increase the rate of additional warming on top of that in the pipeline. Also understand that a 0.15 deg/decade rise in global temps means a rise at two or three times that rate over north america and eurasia. And lastly, "CAGW" is a denialist term. Climate scientists don't use it. And the mainstream position is that we still have time to limit warming to 2C if we take sufficient action now, though it's becoming increasingly obvious that we won't. The point, though, is that it's not scientists talking about "CAGW" as some sort of horror story foregone conclusion.
    0 0
  37. Argus with reference to your comparison between 'skeptics' and 'warmists' in #19 there is a distinction to be made. 'Skeptics" always cherry pick their dates and places as well as give contradictory responses (They would mention 'Global Cooling' one moment and 'natural' warming the next.). It's the big picture that counts-that cannot be said often enough. Let's take the winter of 2009/2010 which was similar to ours. Just by eyeballing NASA satellite images you could tell that only about 10-15% of the Earth was cooler than normal while the other 85%+ was much hotter. The Arctic Ocean and most of Canada was 5-10 degrees Celsius warmer! The Southern Hemisphere had the hottest year on record. It is with this knowledge that you can then proceed to highlight individual events. Skeptics NEVER take the big picture.
    0 0
  38. #35: "... the world is getting warmer and that human activity is the cause--obviously it is." Great! "a rate of warming that merits the level of hysteria exhibited by some in the field of climate change" Can you provide evidence of this 'level of hysteria'? I'm more familiar with deniers becoming hysterical, especially when their claims are refuted. See the existing thread 'Is the IPCC alarmist?' for further discussion.
    0 0
  39. Nederland, with reference to #35 and "hysteria". I stated at the end of the post that there is enough of a temperature change to disrupt weather systems and adversely effect crops. You have to realize that with the Arctic ice cap in decline and the subsequent exposure of more open seas, we are going to see a dramatic change in weather patterns. What's more, this change could start impacting us within a decade or two.
    0 0
  40. We have to remain cognizant that the perception of vast sea of humanity is heavily coloured by the weather (their 'tree-blindness" makes them unable to perceive the forest around them). In Argus' case (being from Sweden), his perceptions and hence his opinions are heavily influenced by this: Perhaps a room at the "It's Freaking Cold" thread could be permanently procured for him... The Yooper
    0 0
  41. Regarding focusing on record highs and lows. An individual high or low record tells us nothing more than that weather exists. If you find many, many more record highs than lows, then you could surmise that we are in a warming trend. Both are true. A post this year on Skeptical Science did the research. More alarmingly, we are in a La Nina (cold regime) and a solar minimum and STILL having record warm temperatures. What do you think will happen when we switch back to neutral or El Nino? What do you think will happen when the sun increases in activity? These two accidents (La Nina and solar minimum) are encouraging the do nothing crowd and when those influences are replaced by the normal to active range, people will clamor for action (and ignorant radicals will say it is ALL due to the sun or the El Nino)
    0 0
  42. Nederland: merits the level of hysteria exhibited by some in the field of climate change? Right now, I would have to say no. "Hysteria" isn't very descriptive, I'm afraid. It's also a rather ugly term thanks to its misogynist roots. I suggest that instead of using intellectually empty and emotionally prejudicial terms like this one, you identify the specific responses to AGW to which you object. That way, we can stick to the facts instead of getting bogged down in identity politics.
    0 0
    Moderator Response: Indeed, and a better place for Nederland to do that is the thread "It's Not Bad."
  43. Daniel Bailey, #40: Please come back soon and show us December as well, and we'll see how that looks!
    0 0
  44. dhogaza at 00:13 AM on 29 December, 2010, "Meanwhile, the capital of Greenland is forecast to be 24F above the historical average for January on Sunday ..." You (unwittingly?) supply the perfect example of "warmist" cherry-picking! One place in Greenland where the forecast is supposed to be proof of global warming...
    0 0
  45. #44: " ...the perfect example of "warmist" cherry-picking!" So now we're even and the cherry-picking can stop. Objectively, the map at #40 should be of concern, whether you happen to temporarily be in an island of blue or not. Even if you take the Spencer graph (Fig 1 in the post) at face value, the lows are all moving higher. So it is no longer relevant to talk about one cold winter as signifying the trend has stopped. If your argument is 'a cold winter means GW has stopped', then you must really panic every year as the days grow shorter.
    0 0
  46. Re: Argus (43) Here's the link. Make sure you re-set the projection to polar before running. December data not yet available. The Yooper
    0 0
  47. Argus @ 43 - Please come back soon and show us December as well From Jeff Masters' Wunderblog here
    0 0
  48. Argus: last 30 day anomaly. If you are interested in learning about the data daily anomaly plots (and 7 day, 30 day, 180 day and 365 day plots are available at NOAA weather site, look for temperature anamolies. Your suggestion that the past month has been cold is wrong. Even a simple eyeball of the data shows much more red than purple. The temperature of the past month is much over average. moderator: my link to the graph is broken. Can you find the problem? thanks.
    0 0
  49. Argus: You (unwittingly?) supply the perfect example of "warmist" cherry-picking! One place in Greenland where the forecast is supposed to be proof of global warming... I think you misunderstand (intentionally?) the reference. The Greenland temperature dhogaza cited isn't proof of anything but the blinkered approach of "skeptics" who routinely present cold weather — in winter, in the Northern Hemisphere — as some sort of rebuttal to AGW, while ignoring any measurements they don't like. In reality, of course, AGW theory predicts and explains cold weather and warming climate, so there'd be no need to downplay the former to insist upon the latter, even if we were in an unusually cold winter, which we're not. The situation with "skeptics" is very different, as your comments and HR's demonstrate, IMO.
    0 0
  50. 'The Greenland temperature dhogaza cited isn't proof of anything but the blinkered approach of "skeptics" who routinely present cold weather — in winter, in the Northern Hemisphere — as some sort of rebuttal to AGW, while ignoring any measurements they don't like.' Exactly ...
    0 0

1  2  3  4  Next

You need to be logged in to post a comment. Login via the left margin or if you're new, register here.


The Consensus Project Website

THE ESCALATOR

(free to republish)


© Copyright 2024 John Cook
Home | Translations | About Us | Privacy | Contact Us