Climate Science Glossary

Term Lookup

Enter a term in the search box to find its definition.

Settings

Use the controls in the far right panel to increase or decrease the number of terms automatically displayed (or to completely turn that feature off).

Term Lookup

Settings


All IPCC definitions taken from Climate Change 2007: The Physical Science Basis. Working Group I Contribution to the Fourth Assessment Report of the Intergovernmental Panel on Climate Change, Annex I, Glossary, pp. 941-954. Cambridge University Press.

Home Arguments Software Resources Comments The Consensus Project Translations About Support

Bluesky Facebook LinkedIn Mastodon MeWe

Twitter YouTube RSS Posts RSS Comments Email Subscribe


Climate's changed before
It's the sun
It's not bad
There is no consensus
It's cooling
Models are unreliable
Temp record is unreliable
Animals and plants can adapt
It hasn't warmed since 1998
Antarctica is gaining ice
View All Arguments...


Username
Password
New? Register here
Forgot your password?

Latest Posts

Archives

Global Warming and Cold Winters

Posted on 15 January 2011 by D.Salmons

Guest post by D.Salmons

If you were to look out most windows as of this writing, there is a good chance that you would be presented with an image of winter. All around me, winter has sprung, dumping measurable inches of frozen precipitation and snarling the usual habits of work and school as we struggle to cope with its effects on modern life. And more than a few of you might be asking yourself, "What happened to global warming?"

Well, the effects of global warming are all around us. That harsh winter that we are experiencing, it is not proof that global warming is not happening, but rather serves as proof that it is indeed happening, and even a bit faster than we might like to think. It also shows why the phrase "Climate Change" is a better term to describe the effects of man on his environment.

Vladimir Petoukhov, a climate scientist at the Potsdam Institute for Climate Impact Research, has recently completed a study on the effect of climate change on winter. According to Petoukhov,

These anomalies could triple the probability of cold winter extremes in Europe and northern Asia. Recent severe winters like last year's or the one of 2005-06 do not conflict with the global warming picture, but rather supplement it.
But how does a colder winter support the idea of a warming earth? It's really simple when you look at the evidence.

Radiative Force Creates Warming
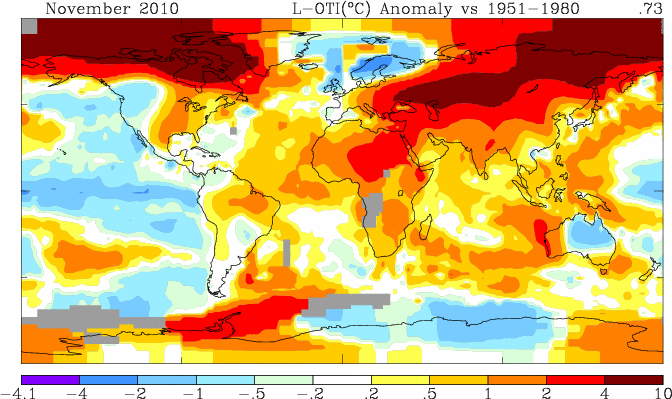


If we look at the Nasa Map above, it shows that the Arctic has been heating up, and studies show that is happening at two to three times the global average. This rising temperature in the Arctic has served to reduce the region's floating ice layer by more than 20%. And as you would expect, when the reflective ice and snow layer is stripped away, it leaves a dark blue sea.

Now, what does the effect of the dark blue sea being exposed have on the Arctic area? Well, the ice and snow layer reflects the majority of the sun's rays harmlessly back into space. But the dark blue of the exposed sea absorbs the rays, aiding the heating process.
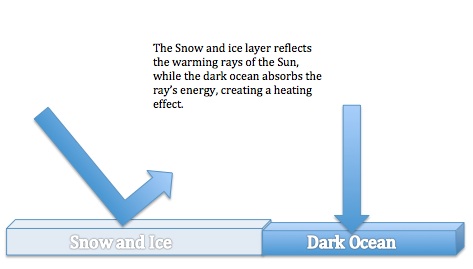
 

In short, as the ice shelf shrinks, the Arctic region becomes a better collector of the Sun's energy, speeding up the warming effect and creating an even wider solar collector from the exposed sea. It should be easy to see how the process accelerates itself.

Global Pressure creates Arctic Corridor

As the ocean gets warmer from the radiative force of the Sun's rays, it is in marked contrast with the polar air above it. The heat from the warmed ocean flows upward into the polar air, creating a high pressure system.

 

This high pressure forces the polar air to move, and soon we have a clockwise swirl that pushes frigid air downwards into Europe and across the globe.
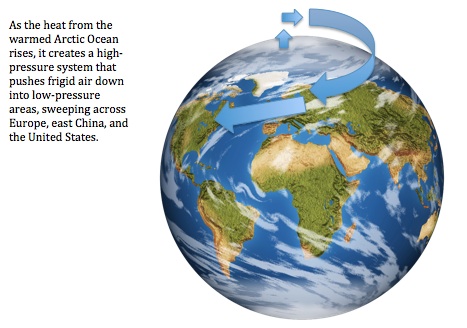
 

This newly formed "Arctic Corridor" pushes the frigid air from Europe into Eastern China and the Americas, dropping temperatures and making winter conditions more extreme than usual.

Records Support The Model
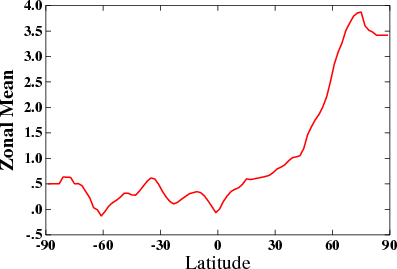
 

Record keeping by NASA and other institutes support the model of the artic corridor. If we look at the NASA's temperature graph by latitude, the temperature shift becomes much more pronounced as you approach the 90-degree mark. The effect, sometimes referred to in the Arctic Dipole Anomaly, explains the shift in weather patterns from established normals.

If the recent past is any indication, we can expect to see more wildly varied weather patterns and temperature shifts. In fact, we can look at the current weather season to see this shift in place. As we huddle in our abodes to avoid the effects of winter, consider that Greenland had temperatures above zero in December. Climate Change may be a very mild description indeed of what is happening to Planet Earth.

Author's bio: D. Salmons is a freelance writer and social media consultant for several companies, ranging from individuals to Fortune 500. She is a bit of a geek and enjoys writing about consumer electronics at Test Freak, a website that collects product information and reviews for the best GPS and other tech gadgets.

0 0

Printable Version  |  Link to this page

Comments

Prev  1  2  

Comments 51 to 63 out of 63:

  1. ....Oh Yooper, that is *hilarious*-it really highlights the alternate universe inhabited by the majority of contrarians. Weather does *not* equal climate. Yet funny how the contrarians only accept that simple fact when *heat* records are getting broken!
    0 0
  2. #49 muoncounter my point was.....GISS makes a large area deep red (as shown in the upper left of the figure on this post) but they do this based on 3 weather stations. my analysis of my local area shows great variability in the trends in various weather stations. so why does GISS assume that thousands of square km can be represented by 3 weather stations when it is obvious that there is great variability in weather stations within a radius of 150 km?
    0 0
  3. You folks who think that 2009 was a cold winter and that 2010 may be even colder fail to realize that the climate has (thankfully) warmed over the last two centuries. The last really cold winter in the northern hemisphere was in 1814 and before that 1795, 1788, 1776 (a year to remember) and 1740. The winters I list make our current "cold winters" look positively balmy.
    0 0
    Moderator Response: [Daniel Bailey] "Thankfully"? You've been pointed to this before but seemed to have ignored it, so here it is again: The negative impacts of global warming on agriculture, health, economy and environment far outweigh any positives. Please try to read it - and understand it - this time.
  4. garythompson (@53), GISS and GHCN have experienced a great loss of thermometers since 1975. The losses have been spectacular at high latitudes even though we are told that climate change should be easier to measure near the poles. Some see this as a plot to introduce a "warming bias" into the ground station records. Personally I doubt this kind of conspiracy theory. More likely it is the result of human fallibilities such as laziness, incompetence and changing priorities. James Hansen (GISS) has pointed out that there is a good correlation between stations separated by over 1,000 km and my own studies of raw data confirm this. However, one still wonders why there should be huge numbers of stations in the USA while much larger land masses such as Russia and Canada have diminishing representation. Here are a couple of links that discuss these issues: http://diggingintheclay.wordpress.com/2010/01/21/the-station-drop-out-problem/ http://diggingintheclay.wordpress.com/2010/01/21/the-station-drop-out-problem/ain-part-1/
    0 0
  5. Gary Thompson & Gallopingcamel-could you please provide decent links to back your claims? When I go to this site: http://data.giss.nasa.gov/gistemp/station_data/ & look at *all* the available data, I don't see your claims backed up at all. All the evidence suggests that GISS has roughly 80% of the NH & 75% of the SH covered by weather stations-which is pretty huge. Also, when I click on the map provided, I'm taken to a list of at least a dozen weather stations in each area-even in places like Greenland & Russia. Of course there are going to be more weather stations in areas like the US & Western Europe-though-because they're more densely populated-making these weather stations less costly to man. I really do recommend that people check their *facts* before dragging out boring old conspiracy theories.
    0 0
  6. On another note-Hadley Climate Research Unit has *fewer* weather stations than GISS, yet they have a smaller warming trend for the period of 1980-2010 than GISS does. So there really is little or no correlation between number of stations & the so-called "warming bias". If anything, the correlation seems to work in the opposite direction implied-that more stations will show a *steeper* warming curve than fewer stations!
    0 0
  7. Moderator, Actually 2010 is over. If you had looked at the data I linked to it would be clear that the calendar year 2010 had normal snow extent for the year as a whole. It was exactly +0.15 million square kilometers for the northern hemisphere. Statistically it is dead on normal. Therefore the claim that 2010 was abnormal is factually incorrect. The jury is not out on the year as a whole. Spring was low, Fall was heavy. That is weather. Averaged out, 2010 was normal. That is what the data says very clearly.
    0 0
    Moderator Response: [Daniel Bailey] My comment referred to this winter, 2010/2011, as not being over. My graphic from Rutgers was clearly labeled as being Spring NH Snow Extent. Meteorological winter is DJF. Thus the graphic has the latest published info available from official sources, which are the preferred sources. I avoid "skeptic blogs".
  8. William (#32), "It is cold in North America as well as in Europe. The Arctic is not anomalously warm." It was cold in Europe. Quite mild now (overnight double-figure minima for parts of the UK, for example). During the cold late November-December period, which this piece is more concerned with, the Arctic was indeed anomalously warm. For an extreme example, on the morning of November 27th, the area of Wales where I lived went down to a November record-breaking -18C. At the same time, Kangerlussuaq (Greenland, within the Arctic Circle) was at +9C. Crazy stuff! I had a look at the recent literature too: http://www.geologywales.co.uk/storms/winter1011a.htm The climate stuff is halfway down the page past all the snowy photos! Cheers - John
    0 0
  9. GC @ 55 - GISS and GHCN have experienced a great loss of thermometers since 1975. The appropriate thread for your comment is here: Why are there fewer weather stations and what's the effect?
    0 0
  10. #50 villabolo at 15:11 PM on 16 January, 2011 it's the ocean that warms up the air, not the air cooling off those warm waters The point is the heat sucked out of the ocean by the colder atmosphere above by whatever means (evaporation, radiative transfer, conductance). This excess heat that makes Arctic air let's say -10°C instead of -40°C has nowhere to go but space. As there are always extremely dry patches of air around the Arctic in many locations the so called "Arctic window" (16-30 μm) is also open, making direct radiative transfer of heat from near surface regions to space much more efficient irrespective of the exact width of the narrow CO2 absorption band in between.
    0 0
  11. In reply to #38. 2010 http://ocean.dmi.dk/arctic/meant80n.uk.php You provided a link to 2011 high latitude Northern temperatures. Click on 2010. No anomalously high temperatures. Was December in Europe cold or warm? 2010/2011 http://ocean.dmi.dk/arctic/meant80n.uk.php Click on 2010. What are you observing? Why the sudden change in ocean temperatures? Ocean temperature anomaly http://www.osdpd.noaa.gov/data/sst/anomaly/2011/anomnight.1.13.2011.gif How does the temperature at the high arctic change? Why? 1972 http://ocean.dmi.dk/arctic/meant80n.uk.php http://news.yahoo.com/s/livescience/20110114/sc_livescience/currentlaniacouldbestrongesteverrecorded Current La Nina Could be Strongest Ever Recorded Satellite images of the Pacific Ocean reveal La Nina stayed strong in the final two months of 2010. "The solid record of La Nina strength only goes back about 50 years and this latest event appears to be one of the strongest ones over this time period," said Bill Patzert, a climatologist at NASA's Jet Propulsion Laboratory in Pasadena, Calif.
    0 0
  12. Berényi Péter the arctic window opens up during winter due to the very low temperatures and dry air. Warming will partially close it, the standard water vapour positive feedback.
    0 0
  13. #58: "Averaged out, 2010 was normal." Must be a new definition of 'normal'. The graph in #43 demonstrates clearly that not only is the snow extent trend still down, but 2010 was well below the trend line. But your statement reads as if you think the entire year was normal. The year that's tied for the hottest ever. But maybe you're right and that is the new normal.
    0 0
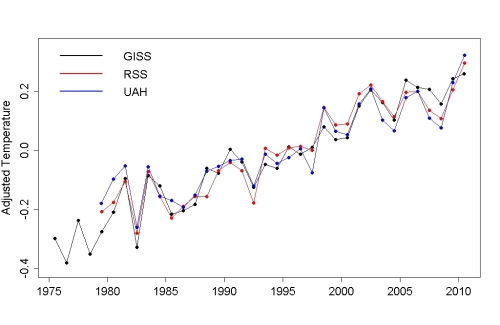
  14. #53: "thousands of square km can be represented by 3 weather stations when it is obvious that there is great variability in weather stations within a radius of 150 km?" Because the variability within short distances averages out. This is climate, not weather. No one would suggest that two locations 150 km apart have different climates unless they are separated by some huge physical feature. Your posting of a dozen sites doesn't specify that. When I looked at the first of your 'flat' 1950-2010 locations in #45, I saw this, which has a clearly increasing trend since the mid 50's. At close to 0.2 degC/decade, we do not call it 'flat'. But let's not have a blizzard of of individual station records, this is about trends over large areas.
    0 0
  15. #62 (William): Are you saying that there are no anomalously high temperatures on this graph (2010 values)? http://ocean.dmi.dk/arctic/meant80n.uk.php Please check it again. Hint: the green line is the average, the red line is the 2010 values. The red line is way above normal through most of December, with the expection of the last few days before New Years, when it went below average, before spiking back to way above average right after New Year. At the warmest, temperatures spiked to 22F above average in the middle of December. December was cold in northern and western Europe (but very warm in southeast, like Bulgaria). At the same time, eastern Canada and western Greenland were were way above average. The blocking high pressure has now faded and Greenland has now cooled to more normal temps and Europe has warmed to temperatures way above average, with heavy rain and massive flooding as the result. BTW, you mention that the La Nina might be the strongest on record. What is the effect of the La Nina on the global average temperature? What conclusion can you draw from the fact that 2010 set a record/tied global average temperature in a year with the possibly strongest La Nina on record, max cooling effect from the deepest solar minimum in more than 100 years, negative PDO and the volcanic eruption at Eyafjella? (the El Nino was short lived and far from record setting)
    0 0
  16. The contrarians and "skeptics" should be careful about hyping this La Nina and the attendant cooling. Yes, it is a strong event, but that means it should reduce global SATs by up to 0.2 C in 2011. In 1976, following a La Nina of similar strength to the current event the global SAT anomaly (from GISTEMP) was -0.16 C (w.r.t 1951-19080 baseline). The PDO is also currently strongly negative which should allegedly lead to cooler global SATs. In contrast, the UK Met office expects the most likely global SAT anomaly in 2011 to be near +0.44 C. So according to the contrarians who say that the role of anthro GHGs does not play a role, or plays an insignificant role, the global SATs in 2011 should be below the 1951-1980 mean, that is negative. Especially given that we are emerging from a prolonged solar minimum in the 11-yr cycle. Looking at the ONI data here, shows that this is currently not the strong La Nina on record, 1955/1956 and 1973/1974 and 1975/1976 were all stronger. I am going to be only too happy to remind them of the positive global SAT anomalies for the year 2011.
    0 0
  17. Daniel Bailey (moderator), Thanks for that link (#53) concerning all the bad news associated with rising temperatures. I am in a "Catch 22" situation as a detailed reply will be ruled "Off Topic" for this thread, so I restrict myself to this question: "How do you explain that empires rise during climate optima (warm periods) and fall during cold periods?" This thread is quite wrong ti imply that recent winters in the northern hemisphere are "Cold". Actually, winter temperatures are well within the range that one would expect given the generally warming climate. In a truly cold winter we would see the Thames freezing over in London and there would be ice floes on the Delaware as in December 1776: "The crossing of the River using the Durham boats, ferry boats and other craft took longer than expected as a nor'easter effected the area causing sleet and freezing rain to pelt the weary troops. Large ice flows and flood-like conditions hindered the nighttime maneuvers."
    0 0
    Moderator Response: As you know perfectly well, you can reply in detail on the appropriate thread and post on this thread a simple link to your reply. Stop pretending that you do not know that, and that you are being censored.
  18. Albatross (#67), the 1976 SAT of -0.16 came after three years of continuous La Nina, see http://www.cpc.ncep.noaa.gov/products/analysis_monitoring/ensostuff/ensoyears.shtml If that happens again, we'll talk in 2.5 years and I will readily admit that whatever warming is shown between 1976 and mid 2013 is due to AGW.
    0 0
  19. #63 Riccardo at 01:06 AM on 17 January, 2011 the arctic window opens up during winter due to the very low temperatures and dry air. Warming will partially close it, the standard water vapour positive feedback It was still damn cold in most of the Arctic except in western Greenland, North-Eastern Canada & the Eastern tip of Siberia with plenty of opportunity to dry-freeze huge air masses. As winds are blowing around all the time, dry air gets mixed with humid one in a fractal-like manner by turbulent flows. Fractal dimension of humid patches is below one in Arctic winter, so there are plenty of see-through holes in the distribution. I keep telling you average humidity tells nothing about optical depth of the atmosphere at specific H2O absorption lines, as transparency is a heavily non-linear function of water vapor mixing ratio, but unfortunately you still don't get the message. Also, with increasing temperatures there, thermal IR radiation flux goes up steeply. Black body radiation flux is 62% higher at -10°C than at -40°C and emissivity of a snow covered surface (or airborne ice needles) is pretty close to a black body in thermal IR.
    0 0
  20. Aren't we only talking about 1 million sq km's less of ice, which is only 600 miles by 600 miles square? That amount of ice free ocean is controlling the worlds climate??
    0 0
  21. Just a (almost certainly wrong) thought. There was a volcanic eruption last year that put a lot of dust into the atmosphere in the northern hemisphere. Could that have had any effect?
    0 0
  22. 68, gallopingcamel,
    "How do you explain that empires rise during climate optima (warm periods) and fall during cold periods?"
    Let me help you to answer your own question by filling in the important missing details:
    "How do you explain that pre-industrial empires restricted to areas encompassing a fraction of the earth's land surface rise during climate optima (warm periods) and fall during cold periods?"
    0 0
  23. 53, garythompson,
    ...so why does GISS assume that thousands of square km can be represented by 3 weather stations when it is obvious that there is great variability in weather stations within a radius of 150 km?
    Because after extensive study they've found that while daily temperatures vary widely between locations, mean anomalies do not. That is, while it may be 3˚C warmer at a spot just a 150 km away from another (maybe at a different altitude, or more affected by a nearby large body of water, for instance), the difference in average temperature (i.e. temperature anomaly) between that spot and the first averaged for all of the days in any given month is not going to be noticeably different. To put it another way, the temperature anomaly (the difference between what the thermometer says today, and what it normally says on this particular day of the month in any given year), when averaged over thirty days, is pretty darn consistent whether you go 100, 200, 500 or even 1000 km away. Anomalies (difference from the multi-year average for a particular day), not absolute temperatures. Averages for a reasonably large string of days, not readings for a single, particular day. And they didn't just assume this. They learned this over time by looking at loads of data, analyzing it, and realizing that much of it was redundant and superfluous to the problem at hand. Why do you assume that your common sense approach, and level of education and intelligence, is superior to that of people who have dedicated their lives to studying this, and do it as a full time job, all year long, for years and years and years? I'm not asking you to just accept what they say because they are authorities, but your bristling assumption that you know better than they do is rather (annoyingly) astounding. The hubris of some people amazes me.
    0 0
  24. Gary Thompson and GC-could you please move the discussion about the SAT record to the appropriate thread/s. I know that those global SAT fields are inconvenient to you "skeptics", but raising red herrings (e.g., the alleged station dropout issue has been dealt with at length) are trying to call the validity of the SAT records is not going to help your case. And neither is pushing your Arctic window obsession, BP. Is it not more interesting to try and understand more about how the loss of Arctic ice is potentially affecting regional climate?
    0 0
    Moderator Response: Yes, please *everybody* discuss on appropriate threads.
  25. Eric @69, My post @67 was directed at William's comment about La Nina. Now I'm not sure how you managed to miss my point. There are several other examples of single year La Nina events several decades ago (e.g., 54/55, 64/65, 70/71) which were associated with cooler global SATs than observed following recent La Ninas (e.g., 2000, 2008)-- you very likely know that or should. La Nina's still act to cool the global SAT (and troposphere) temperatures of course, but those anomalies are now superimposed on an underlying, long-term warming trend, so instead of getting a global SAT of around -0.1 C, one nowadays gets a global SAT anomaly of near +0.4 C (we'll see what 2011 brings) following a La Nina (and barring a major equatorial volcano blowing its top). This is what one gets (i.e., Tamino) when you remove the signal of ENSO and volcanoes from the SAT record from 1975. My point was, and is, that the strategy of the "skeptics" is to at all times focus on anything that permits them to refer to "cool" or "cold", or a "record cooling La Nina". And with internal climate modes, regional variability and weather, they are always able to repeatedly draw their targets' attention away from the inconvenient and important big picture of long-term warming. It is totally transparent and disingenuous, but sadly very effective. So no need to wait 2.5 years for multi-year La Nina. We can meet back here in early 2012. In fact, that is not even necessary, just look at Tamino's graphic...
    0 0
  26. Eric, PS: If you want to discuss this further, we can take it to a relevant thread.
    0 0
  27. This thread wants to reconcile the recent "cold" winters with "Global Warming". This is quite unnecessary as these winters are well within the range of random variability. During my lifetime there has been nothing to match (at least in south Wales) the winter of 1947 which dumped six feet of snow on a Welsh county known for its palm trees (thanks to the "Gulf Stream"). The snow persisted for six weeks starting in mid February. Few of the palm trees survived. Just to provide some contrast, the record cold winter of 1947 in south Wales was followed by a record hot summer. As I have pointed out more than once, what we perceive as "cold" winters are positively balmy compared to cold winters during the "Little Ice Age". During the LIA, there were 24 years when the Thames froze over. Enjoy the current warming. Long may it last!
    0 0
  28. Spaerica - "Because after extensive study they've found that while daily temperatures vary widely between locations, mean anomalies do not." This comes up a lot - I know its covered in Hansen 1988, but I think it would be good if someone did a Skepsci article on this, referencing the data, graphics from studies that actually established this. If you have a reference to a good review paper on the spatial stability of temperature anomalies, I would appreciate the reference.
    0 0
  29. #78: "positively balmy compared to cold winters during the "Little Ice Age" I don't know what the relevance of that statement is to this thread or any other -- except as a sound byte on threads on the LIA. This thread and Northern hemisphere warming rates both originate in the desperate 'skeptic' claims that even a single winter snowstorm 'proves' warming is over or was never real. And unlike the 'skeptic non-science' of 'natural cycles,' actual climate science must reconcile strong early winter storms with deteriorating Arctic ice and all of the other fingerprints. Denial is easy; science is hard work.
    0 0
  30. GC: Enjoy the current warming. Long may it last! This sort of braying certainty really isn't compatible with your attempts to present yourself as a humble amateur truthseeker. Maybe you should approach your own opinions with the same skepticism you recommend when discussing the findings of people who actually have some expertise.
    0 0
  31. muoncounter, I think it is too soon to discern a trend in early versus late winter snowstorms. IMO, I don't think we have had enough years of very low ice yet.
    0 0
  32. Both Esop #66 and John Brookes #72: Eyjafjallajokull had little impact on global climate for several reasons. 1: It was a relatively small eruption on the global scale - VEI 3-4 and ~0.25 cubic km of ejected material. Pinatubo was VEI 6 and ~10 cubic km of material. 2: It was at a high latitude - Eruptions that can significantly affect global climate through aerosols stand a much better chance of doing so if they are near the Equator. 3: The Eyja eruption column was not very high - ~8km, and so did not inject much material into the stratosphere. Large Plinian eruption columns such as Pinatubo (>20km high eruption column) inject material directly into the stratosphere, notably statospheric sulphuric acid, influencing climate. Part of the reason Eyjafjallajokull was even as explosive as it was is the presence of the glacier and consequent abundant water around the magma producing phreatomagmatic activity enhancing the explosivity of the andesitic eruption. But that explosivity still isn't very large. Eyja is not going to feature very high on a global list of 21st Century eruptions. So while it's tempting to relate the Eyjafjallajokull 2010 volcanic eruption to snowy weather, it's not relevant here, as Eyjafjallajokull was orders of magnitude too small to have much of a global or climatic impact. The fine ash, the wind direction, and subsequent entrainment of fine ash into higher altitudes of the troposphere course led to plenty of travel disruption and media attention...
    0 0
  33. "If we look at the Nasa Map above, it shows that the Arctic has been heating up" I have to nitpick here. A 1-month anomaly map is not a good indicator, as there's major weather noise in that. Hansen also notes the extreme negative configuration of the AO has had a lot to do with recent cold couple of winters in some mid-latitute areas. http://data.giss.nasa.gov/gistemp/2010november/ Now is the AO changing as a result of Arctic warming? Seems like an interesting question, but I'm not convinced colder regional winters will be the norm going forward.
    0 0
  34. Phila (#81), you said: "This sort of braying certainty really isn't compatible with your attempts to present yourself as a humble amateur truthseeker." That one stung a bit; you accurately described my self assessment. While I respect the opinion of "Climate Scientists", I respect the opinion of historians much more. Historians tell us that warm periods are associated with growth and prosperity while cold periods are associated with hardship and misery.
    0 0
    Moderator Response: [Daniel Bailey] I, too, love history. The problem with your statement, GC, is that you assume warming periods documented in the historical record will approximate that yet to come in this century (2 degrees C or more), when there's no evidence to suggest any such thing.
  35. You can not ignore the opinions of this discussion, Professor Mike Lockwood: “There is no doubt that the frequency of those blocking events in winter is higher when solar activity is low,” says Lockwood. “What was a slight surprise is that the sun was changing the jet stream, but only when the jet stream has travelled across the Atlantic and begins hitting land over Europe.” At present in the Arctic - the Arctic Circle - half a year continues night. Large extra warmth can come only from the equatorial zone (system: NAO - AO - AMO - AMOC).
    0 0
  36. Phila (#88), Climate change can be very sudden as you can see in Richard Alley's study of the "Younger Dryas": http://www.ncdc.noaa.gov/paleo/pubs/alley2000/alley2000.html You may have a point when you say that the climate could warm "too much". How much warming would be too much? I won't try to answer the question as it would only attract another "Yellow Card" for being "Off Topic". Dragging myself "On Topic" again, on average there is at least one cold winter in the UK every 13 years. These cold winters are just "Weather" in the sense that they do not disprove what all the instrumental data is telling us. The climate is growing warmer.
    0 0
  37. "Climate change can be very sudden" - yep. Broecker commented too that climate change that rapid would destroy temperature food production in NH as how would farmers know what to plant? However, these very rapid reversals only appear in the historical record when coming out of a glacial. If there was a risk of such an event due to current climate behaviour then we would be in a grave position indeed but there is little evidence for such a risk. There may be more than one cause for YD-type, Heinrich events and such like but none of theories suggest a risk that would operate now.
    0 0
  38. The "Global Warming and Cold Winters" post is quite good, but it over-simplifies things in a way that I found confusing. Since the air pressure at any point is almost exactly equal to the weight of the air above, per unit area, and the density of air depends (inversely) on the temperature, one would think that the result would be a low pressure system. My guess is that the author is talking about polar air that, even warmed by the ocean, is colder than air to the south, and is therefore more dense than air to the south. So the result would be high pressure relative to conditions to the south. Does this make sense?
    0 0
  39. Arrhenius's finding that more CO2 causes more warming is incorrect and not scientifically valid. More CO2 does not mean more warming. In the Greenhouse Effect (GHE), you must add photons to get the warming. Shut off the photons and our nights are still colder than our days despite adding more CO2. It's the photons that create the warming, not the CO2. With such an excess of water vapor and other GHGs, the reality is, because CO2 temperature increases are logarithmic, there are not enough photons available for absorption by CO2 to cause a meaningful increased warming above about 100 ppm. Warming during the day and cooling at night is still a reality. Check out this site: http://www.c3headlines.com/2011/01/noaa-confirms-recent-global-temperature-change-is-historically-small-warming-is-decelerating.html The NOAA/NCDC dataset chart shows the annual global temperature change from 1880-2010 vs. the rising levels of CO2. Note that these rising levels of CO2 have no impact on the annual global temperatures. To claim unprecedented global warming for the last decade is wrong when, clearly, the temperature changes are within natural variability.
    0 0
    Moderator Response: [muoncounter] This is your 3rd posting of a link to a total misinterpretation of basic data. Repetition serves no purpose other than to undermine your own credibility.
  40. Henry, you seem to be having trouble understanding the objections to you link. Consider a linear trend like: Year 1 10 Year 2 20 Year 3 30 Year 4 40 Year 5 50 Now, instead look at year minus previous year. Year 1 10 Year 2 10 Year 3 10 Year 4 10 Year 5 10 See? Taking differences de-trends a series. You can make no conclusions about a trend from data like. Your desire to find contrary evidence for climate theory is clouding your judgement.
    0 0
  41. Henry, I've posted a response in "Has the Greenhouse Effect Been Falsified", which is where your last post should have been made.
    0 0
  42. We still seem to be making record lows, so can the probability distribution have shifted much? Probably not when the tiny temperature increase since the beginning of the 20th century is viewed in context with a retreat from the mini ice age. The fact is these models are inherently extremely complex and sensitive. In the absence of clear cut warming consistent with a 24% rise in CO2, one must remain unconvinced.
    0 0
  43. "The fact is these models are inherently extremely complex and sensitive. In the absence of clear cut warming consistent with a 24% rise in CO2, one must remain unconvinced." mozart - there are problem with this statement. Can I suggest you get a better background by reading the relevant sections in IPCC WG1. Firstly, the models aren't "sensitive" in the normal sense of the word. They do not have the skill to make decade (or less) level predictions. However, the models unequivocal at the 30 year level. Secondly, the model/data concordance is excellent for a sensitivity of 3 degree per doubling. See here for a discussion.
    0 0
  44. I apologize for being vague. They are sensitive to minor changes in dependent variable settings...they are not sensitive in terms of prediction. As for a doubling of CO2....we wont see that this century, given we have a 24% increase for the whole of the 20th century. More realistic is a doubling by 2200 with a 1.5% C increase in temperatures. If...and it's a big if...we don't adapt to lower carbon usage by sheer economic pressures. What is missing here is a sense of what will happen as our crude supplies dwindle. The natural economic forces unleashed by attendant price increases will stimulate real(not subsidised) search for alternative fuels. Leave it to the market. So I'd be offering odds for less than a one degree C rise....if only I'd be around to cash in.
    0 0
  45. Mozart, Even if CO2 emissions remained at the current 2.2 parts per million per year, we would see more than a doubling of pre-industrial CO2 levels by the end of the twenty-first century. Unfortunately our CO2 emissions have increased exponentially since the start of the industrial revolution. The key point when looking at an exponential increase is that one cannot expect future growth to look similar to that observed in the past. An exponential increase looks linear until it hits a certain point, at which time that slowly rising line on the graph suddenly looks a lot more vertical.
    0 0
  46. #95: "we wont see that this century, given we have a 24% increase for the whole of the 20th century." That's not a valid trendology. The rate of fossil fuel CO2 emissions boomed after WW2; we've released half of the total of all CO2 emissions just since 1974. CDIAC has these numbers. Reasonable scenarios put doubling -- 560ppm -- shortly after mid century. Your 'dwindling crude supplies' won't play: there's lots of coal. But that's a topic for Its not us or Human CO2 is a tiny %.
    0 0
  47. Mozart: According to this link in August, 17 countries had recorded record highs while only one had recorded a record low during 2010. I have not seen the final yearly data (does anyone have a link?). Are you suggesting that there have to be zero record lows before you agree that it is getting warmer? It seems to me that 17:1 is a significant shift in the probability distribution from the expected 1:1 ratio. How high does it need to go before you think it is significant? 25:1? 100:1? 1,000:1?
    0 0
  48. Mozart - They are sensitive to minor changes in dependent variable settings. ??? I dont think I am understanding you are all. What a model should be doing, is predicting the long term trends for a given scenario of forcings. Are you suggesting that those trends are sensitive to minor changes in model parameters? Can you provide some link or other evidence to support this? As to "we wont double this century", well as CO2 is increasing at 3ppm/year, I make that 57 years to 560. For more detail on what the scenarios actually assume and how the calculations are done, see SRES. Read instead of guessing.
    0 0
  49. And Michael if you look at records so far in 2011 you find lows far outnumber highs. But of course this is too short a time frame...as is 2010 as a whole. Nobody is denying there is an increase in temperatures.....it's the extrapolations that are at issue. CO2 increased 17% (approx) from 1950 to 2000....but it's going to increase 100% from 2000 to 2050. Temperature increased less than one degree in 150 years and now it's going to soar 6 degrees or more, depending on the model. And the figure was much higher than that, until the models were improved. None of this takes into acount changes in economic behaviour, fuel shortages, or the effect of carbon saturation on heat retention. It's a model projection....true or false....not a reality. And anybody who has worked with mathematical models knows how easily they are tweeked...the dropping forecasts being a good example. Of course, none of this even begins to address the question of how we change things. We are facing unrest around the world as we chat....the product of food shortages. Misguided attempts to divert arable land to ethanol production are playing an increasing role in this. Attempt a rapid switch from fossil fuels and the Global Financial Crisis will be a minor inconvenience by comparison. We have a vast infrastructure based on fossil fuels and rapidly growing populations that will ensure this network is used. Take a look at the rush hour in any big city and ask yourself how we change that picture in a hurry. Fortunately the effect on climate continues to be modest at best.
    0 0
  50. "None of this takes into acount changes in economic behaviour, fuel shortages, or the effect of carbon saturation on heat retention. It's a model projection....true or false....not a reality. " What are we to make of you asserting the above when I gave you a link the SRES scenarios above which shows that this is not true? Your percentage calculation is ignoring that preindustrial baseline is around 280. This is screwing up your logic. Use the trend and extrapolate if you want simplistic results. However, SRES scenarios are not simplistic. As to other points - these seem to also uninformed but there are too many and you should take them to the appropriate places on the website. (especially Its not bad). And please back your assertions.
    0 0

Prev  1  2  

You need to be logged in to post a comment. Login via the left margin or if you're new, register here.


The Consensus Project Website

THE ESCALATOR

(free to republish)


© Copyright 2024 John Cook
Home | Translations | About Us | Privacy | Contact Us